

Key Insights
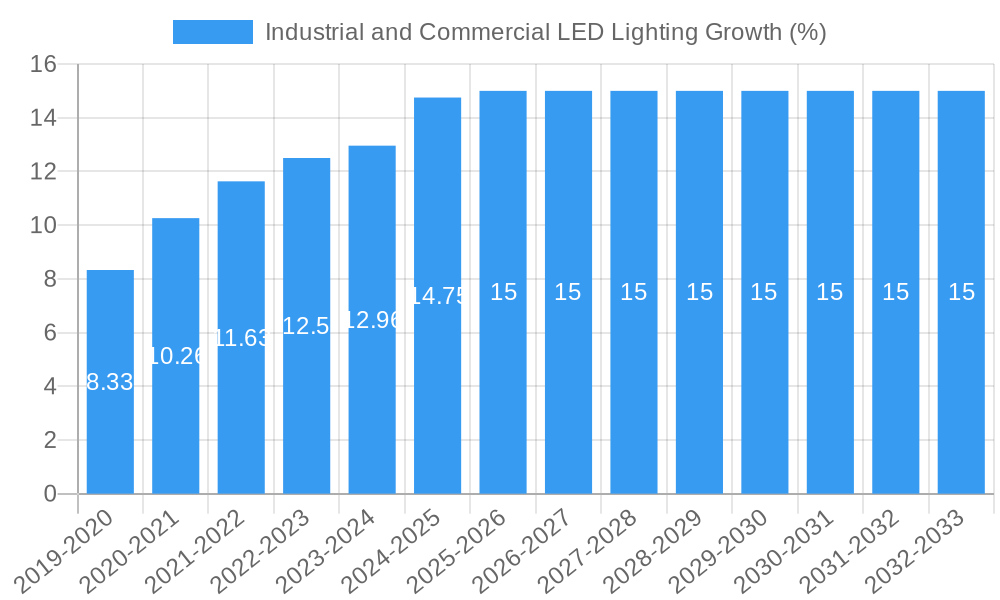
The Industrial and Commercial LED Lighting market is poised for significant expansion, projected to reach a valuation of approximately $35,000 million by 2025. This growth is fueled by a robust Compound Annual Growth Rate (CAGR) of around 15%, indicating a sustained and dynamic market trajectory through 2033. The primary drivers behind this surge are the escalating demand for energy-efficient lighting solutions across industries and the increasing awareness of the long-term cost savings offered by LED technology. Furthermore, government regulations and incentives promoting the adoption of sustainable and energy-saving products are acting as significant catalysts. The market is observing a pronounced shift from traditional lighting systems to advanced LED solutions, driven by their superior performance, extended lifespan, and reduced environmental impact.
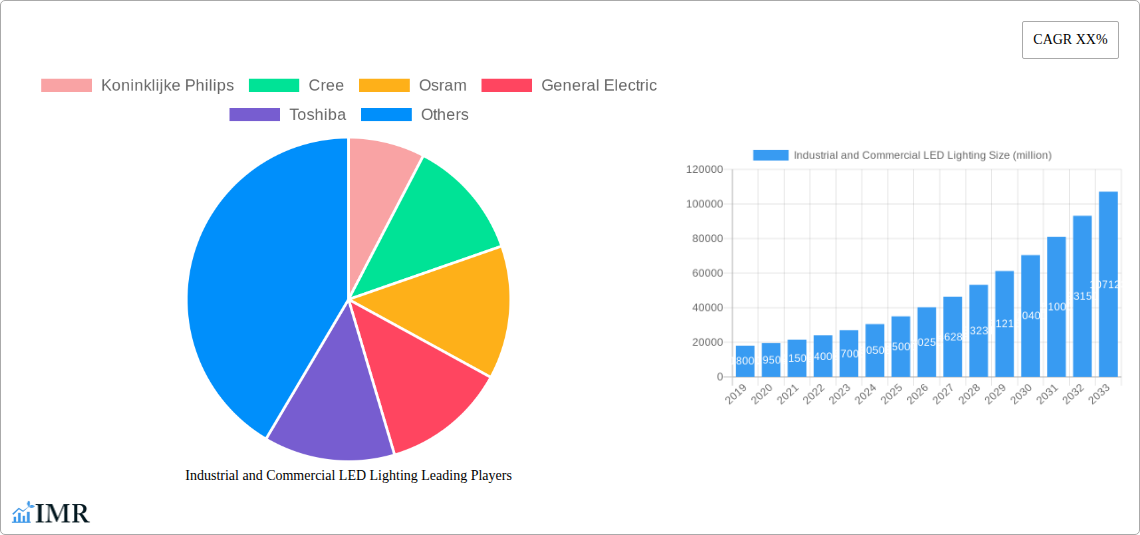
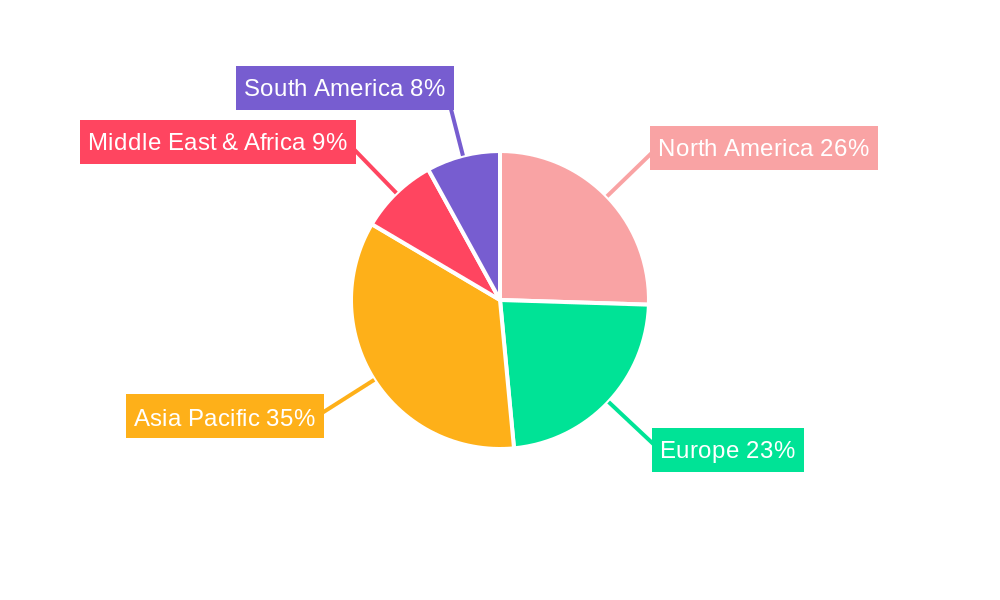
The market is segmented by application, with Retail, Manufacturing, and Warehouses & Storage emerging as key growth areas due to the high concentration of facilities requiring extensive illumination and the constant need for operational efficiency. High Power (Above 300W) LEDs are witnessing substantial demand, particularly in industrial settings where powerful and reliable lighting is paramount. Key companies like Koninklijke Philips, Cree, Osram, and General Electric are at the forefront, investing heavily in research and development to innovate and capture market share. Restraints, such as the initial high upfront cost for certain advanced LED systems and the availability of cheaper, less efficient alternatives, are being steadily overcome by falling LED prices and the proven return on investment. The Asia Pacific region, led by China and India, is expected to be the fastest-growing market, driven by rapid industrialization and infrastructure development.
Industrial and Commercial LED Lighting Market Dynamics & Structure
The global industrial and commercial LED lighting market is characterized by a moderately concentrated structure, with a few major players holding significant market share, but also a growing number of niche manufacturers contributing to competitive intensity. Technological innovation remains the primary driver, propelled by advancements in LED efficacy, smart lighting controls, and integration with the Internet of Things (IoT). Regulatory frameworks, particularly those promoting energy efficiency and phasing out traditional lighting technologies, are continuously shaping market adoption. Competitive product substitutes, while diminishing with LED advancements, still include traditional fluorescent and high-intensity discharge (HID) lighting, particularly in cost-sensitive applications. End-user demographics are shifting towards sustainability-conscious businesses prioritizing long-term cost savings and enhanced operational efficiency. Mergers and acquisitions (M&A) are a notable trend, with larger companies acquiring innovative smaller firms to expand their product portfolios and market reach. For instance, the market saw approximately 30-40 M&A deals between 2019 and 2024, with an average deal value of USD 50-150 million, indicating consolidation and strategic integration.
- Market Concentration: Dominated by 5-7 key global players, with regional strengths for others.
- Technological Innovation: Driven by higher lumen output, lower energy consumption, smart features, and color tuning.
- Regulatory Frameworks: Stringent energy efficiency standards and phase-out mandates for older technologies.
- Competitive Substitutes: Primarily legacy lighting technologies, facing significant pressure from LED advancements.
- End-User Demographics: Growing demand from energy-conscious sectors seeking ROI and operational improvements.
- M&A Trends: Strategic acquisitions focused on intellectual property, market access, and expanded product lines.
Industrial and Commercial LED Lighting Growth Trends & Insights
The industrial and commercial LED lighting market is projected for robust expansion, driven by increasing awareness of energy efficiency benefits, declining LED costs, and supportive government initiatives. The market size is estimated to reach USD 65,000 million in 2025, exhibiting a compound annual growth rate (CAGR) of 12.5% from the historical period of 2019-2024, and is forecast to ascend to USD 150,000 million by 2033. This significant growth trajectory is fueled by the inherent advantages of LED technology, including longer lifespan, reduced maintenance costs, and superior illumination quality compared to conventional lighting systems. Adoption rates are accelerating across diverse applications, from expansive manufacturing facilities and large-scale warehouses to bustling retail environments and modern office buildings. Technological disruptions are constantly reshaping the landscape, with the integration of smart controls, daylight harvesting, and occupancy sensors playing a crucial role in optimizing energy consumption and enhancing user experience. Consumer behavior shifts are evident, with businesses increasingly prioritizing sustainable practices and seeking solutions that contribute to their environmental, social, and governance (ESG) goals. The market penetration of LED lighting in the industrial and commercial sectors has already surpassed 70% in developed economies and is rapidly increasing in emerging markets, indicating a substantial runway for future growth. The continuous improvement in lumen per watt (lm/W) ratios, moving from an average of 100 lm/W in 2019 to over 150 lm/W in 2025, further solidifies LED's competitive edge. The total market volume is expected to grow from approximately 750 million units in 2025 to over 1,500 million units by 2033.
Dominant Regions, Countries, or Segments in Industrial and Commercial LED Lighting
North America, particularly the United States, has emerged as a dominant region in the industrial and commercial LED lighting market. This leadership is underpinned by a strong emphasis on energy efficiency, stringent building codes, and significant government incentives promoting the adoption of LED technologies. The Manufacturing segment within the industrial and commercial sector is a key driver of growth, accounting for an estimated 30% of the total market share in 2025. This dominance is attributed to the critical need for high-quality, reliable, and energy-efficient lighting in production environments to ensure safety, productivity, and product quality. Advanced manufacturing facilities are increasingly opting for smart lighting solutions that can be integrated with automation systems, further enhancing operational efficiency. The High Power (Above 300W) category within the Types segment is also experiencing substantial traction, driven by the demanding lighting requirements of industrial settings such as factories, foundries, and large-scale warehouses. The growing investment in infrastructure development and the expansion of e-commerce, leading to the construction of larger and more sophisticated warehouses, are also contributing significantly to the demand for high-power LED solutions. Economic policies promoting industrial modernization and the push for sustainable manufacturing practices further solidify the dominance of the manufacturing sector and high-power LED solutions in this market.
- Dominant Region: North America (primarily the United States)
- Leading Application Segment: Manufacturing
- Key Drivers:
- High demand for improved visibility and safety in production lines.
- Energy cost reduction initiatives in factories.
- Integration with smart manufacturing and Industry 4.0 technologies.
- Strict regulations for industrial workplace lighting standards.
- Key Drivers:
- Leading Type Segment: High Power (Above 300W)
- Key Drivers:
- Need for powerful illumination in large industrial spaces and warehouses.
- Durability and long lifespan suitable for harsh industrial environments.
- Advancements in thermal management for high-output LEDs.
- Cost-effectiveness over the lifecycle for high-intensity lighting needs.
- Key Drivers:
Industrial and Commercial LED Lighting Product Landscape
The industrial and commercial LED lighting product landscape is characterized by rapid innovation focused on enhancing performance, energy savings, and functionality. Key product innovations include the development of higher efficacy LEDs with improved lumen output per watt, advanced thermal management systems for extended product life, and the widespread integration of smart controls such as dimming, color tuning, and remote management capabilities. Applications are expanding beyond basic illumination to encompass task lighting, emergency lighting, and specialized lighting for specific industrial processes. Performance metrics such as Color Rendering Index (CRI) are consistently improving, ensuring better visual acuity and reduced eye strain for workers. Unique selling propositions often lie in the durability of fixtures designed for harsh environments, resistance to vibration and extreme temperatures, and the ability to integrate seamlessly with building management systems (BMS) and IoT platforms, offering predictive maintenance and energy optimization insights.
Key Drivers, Barriers & Challenges in Industrial and Commercial LED Lighting
Key Drivers: The industrial and commercial LED lighting market is primarily propelled by escalating energy costs, necessitating greater energy efficiency. Supportive government regulations and subsidies encouraging the adoption of sustainable technologies provide a significant boost. Technological advancements in LED efficacy and smart lighting controls further enhance their appeal. The long operational lifespan and reduced maintenance requirements of LEDs translate into substantial cost savings for businesses.
Barriers & Challenges: Despite robust growth, the market faces challenges. The initial higher upfront cost compared to traditional lighting, though decreasing, can be a barrier for some small and medium-sized enterprises. Supply chain disruptions, as observed in recent years, can impact availability and pricing. Evolving standardization and interoperability issues with smart lighting systems can also pose challenges. Intense competition from numerous manufacturers, both established and emerging, can lead to price pressures and market fragmentation. Regulatory hurdles in specific regions or for niche applications can also slow adoption.
Emerging Opportunities in Industrial and Commercial LED Lighting
Emerging opportunities lie in the connected and intelligent lighting solutions that go beyond illumination. The integration of sensors within LED fixtures for environmental monitoring (e.g., air quality, temperature) and security surveillance presents a significant untapped market. The growing demand for human-centric lighting, which mimics natural daylight cycles to improve worker well-being and productivity, is another key area. Furthermore, specialized LED solutions for niche industrial applications, such as horticulture lighting for vertical farms or explosion-proof lighting for hazardous environments, offer substantial growth potential. The expansion of smart city initiatives also creates opportunities for standardized and scalable LED lighting deployments in public infrastructure.
Growth Accelerators in the Industrial and Commercial LED Lighting Industry
Several catalysts are accelerating the growth of the industrial and commercial LED lighting industry. The increasing global focus on sustainability and carbon footprint reduction is a major driver, compelling businesses to adopt energy-efficient solutions like LEDs. Technological breakthroughs in miniaturization, improved thermal dissipation, and enhanced spectral control are continuously expanding the application possibilities. Strategic partnerships between LED manufacturers and building automation companies are facilitating the seamless integration of lighting into comprehensive smart building ecosystems. Moreover, government mandates and incentives for energy-efficient retrofits and new constructions are creating a predictable and favorable market environment for LED adoption. The ongoing digitalization of industries also fuels demand for intelligent lighting that can contribute to data collection and operational optimization.
Key Players Shaping the Industrial and Commercial LED Lighting Market
- Koninklijke Philips
- Cree
- Osram
- General Electric
- Toshiba
- ABB (Cooper Industries)
- Eaton
- Illumitex
- Dialight
- Hubbell Lighting
- DECO Enterprises
- Zumtobel Group
Notable Milestones in Industrial and Commercial LED Lighting Sector
- 2019: Introduction of advanced smart lighting platforms with AI-driven energy management.
- 2020: Significant supply chain adjustments due to global events, leading to increased focus on regional manufacturing.
- 2021: Launch of ultra-high efficacy LED chips exceeding 200 lm/W, setting new performance benchmarks.
- 2022: Increased adoption of modular and upgradeable LED lighting systems for extended product lifecycles.
- 2023: Growing integration of LED lighting with advanced sensor technologies for IoT applications.
- 2024: Key mergers and acquisitions aimed at consolidating market share and expanding technological capabilities.
In-Depth Industrial and Commercial LED Lighting Market Outlook
The industrial and commercial LED lighting market outlook remains exceptionally positive, driven by a confluence of technological advancements, escalating energy efficiency demands, and favorable regulatory landscapes. Growth accelerators such as the increasing adoption of Industry 4.0 principles, the expansion of e-commerce necessitating efficient warehouse lighting, and the global push towards decarbonization will continue to fuel market expansion. Strategic opportunities lie in the development of increasingly intelligent and connected lighting solutions that offer data analytics for operational optimization and predictive maintenance. Furthermore, the growing focus on employee well-being through human-centric lighting presents a significant avenue for product differentiation and market penetration. The market is poised for sustained growth, with a strong emphasis on integrated, sustainable, and data-driven lighting solutions.
Industrial and Commercial LED Lighting Segmentation
-
1. Application
- 1.1. Retail
- 1.2. Manufacturing
- 1.3. Hospitality
- 1.4. Warehouses & Storage
- 1.5. Office Buildings
- 1.6. Others
-
2. Types
- 2.1. Low Power (Below 300W)
- 2.2. High Power (Above 300W)
Industrial and Commercial LED Lighting Segmentation By Geography
-
1. North America
- 1.1. United States
- 1.2. Canada
- 1.3. Mexico
-
2. South America
- 2.1. Brazil
- 2.2. Argentina
- 2.3. Rest of South America
-
3. Europe
- 3.1. United Kingdom
- 3.2. Germany
- 3.3. France
- 3.4. Italy
- 3.5. Spain
- 3.6. Russia
- 3.7. Benelux
- 3.8. Nordics
- 3.9. Rest of Europe
-
4. Middle East & Africa
- 4.1. Turkey
- 4.2. Israel
- 4.3. GCC
- 4.4. North Africa
- 4.5. South Africa
- 4.6. Rest of Middle East & Africa
-
5. Asia Pacific
- 5.1. China
- 5.2. India
- 5.3. Japan
- 5.4. South Korea
- 5.5. ASEAN
- 5.6. Oceania
- 5.7. Rest of Asia Pacific
Industrial and Commercial LED Lighting REPORT HIGHLIGHTS
| Aspects | Details |
|---|---|
| Study Period | 2019-2033 |
| Base Year | 2024 |
| Estimated Year | 2025 |
| Forecast Period | 2025-2033 |
| Historical Period | 2019-2024 |
| Growth Rate | CAGR of XX% from 2019-2033 |
| Segmentation |
|
Table of Contents
- 1. Introduction
- 1.1. Research Scope
- 1.2. Market Segmentation
- 1.3. Research Methodology
- 1.4. Definitions and Assumptions
- 2. Executive Summary
- 2.1. Introduction
- 3. Market Dynamics
- 3.1. Introduction
- 3.2. Market Drivers
- 3.3. Market Restrains
- 3.4. Market Trends
- 4. Market Factor Analysis
- 4.1. Porters Five Forces
- 4.2. Supply/Value Chain
- 4.3. PESTEL analysis
- 4.4. Market Entropy
- 4.5. Patent/Trademark Analysis
- 5. Global Industrial and Commercial LED Lighting Analysis, Insights and Forecast, 2019-2031
- 5.1. Market Analysis, Insights and Forecast - by Application
- 5.1.1. Retail
- 5.1.2. Manufacturing
- 5.1.3. Hospitality
- 5.1.4. Warehouses & Storage
- 5.1.5. Office Buildings
- 5.1.6. Others
- 5.2. Market Analysis, Insights and Forecast - by Types
- 5.2.1. Low Power (Below 300W)
- 5.2.2. High Power (Above 300W)
- 5.3. Market Analysis, Insights and Forecast - by Region
- 5.3.1. North America
- 5.3.2. South America
- 5.3.3. Europe
- 5.3.4. Middle East & Africa
- 5.3.5. Asia Pacific
- 5.1. Market Analysis, Insights and Forecast - by Application
- 6. North America Industrial and Commercial LED Lighting Analysis, Insights and Forecast, 2019-2031
- 6.1. Market Analysis, Insights and Forecast - by Application
- 6.1.1. Retail
- 6.1.2. Manufacturing
- 6.1.3. Hospitality
- 6.1.4. Warehouses & Storage
- 6.1.5. Office Buildings
- 6.1.6. Others
- 6.2. Market Analysis, Insights and Forecast - by Types
- 6.2.1. Low Power (Below 300W)
- 6.2.2. High Power (Above 300W)
- 6.1. Market Analysis, Insights and Forecast - by Application
- 7. South America Industrial and Commercial LED Lighting Analysis, Insights and Forecast, 2019-2031
- 7.1. Market Analysis, Insights and Forecast - by Application
- 7.1.1. Retail
- 7.1.2. Manufacturing
- 7.1.3. Hospitality
- 7.1.4. Warehouses & Storage
- 7.1.5. Office Buildings
- 7.1.6. Others
- 7.2. Market Analysis, Insights and Forecast - by Types
- 7.2.1. Low Power (Below 300W)
- 7.2.2. High Power (Above 300W)
- 7.1. Market Analysis, Insights and Forecast - by Application
- 8. Europe Industrial and Commercial LED Lighting Analysis, Insights and Forecast, 2019-2031
- 8.1. Market Analysis, Insights and Forecast - by Application
- 8.1.1. Retail
- 8.1.2. Manufacturing
- 8.1.3. Hospitality
- 8.1.4. Warehouses & Storage
- 8.1.5. Office Buildings
- 8.1.6. Others
- 8.2. Market Analysis, Insights and Forecast - by Types
- 8.2.1. Low Power (Below 300W)
- 8.2.2. High Power (Above 300W)
- 8.1. Market Analysis, Insights and Forecast - by Application
- 9. Middle East & Africa Industrial and Commercial LED Lighting Analysis, Insights and Forecast, 2019-2031
- 9.1. Market Analysis, Insights and Forecast - by Application
- 9.1.1. Retail
- 9.1.2. Manufacturing
- 9.1.3. Hospitality
- 9.1.4. Warehouses & Storage
- 9.1.5. Office Buildings
- 9.1.6. Others
- 9.2. Market Analysis, Insights and Forecast - by Types
- 9.2.1. Low Power (Below 300W)
- 9.2.2. High Power (Above 300W)
- 9.1. Market Analysis, Insights and Forecast - by Application
- 10. Asia Pacific Industrial and Commercial LED Lighting Analysis, Insights and Forecast, 2019-2031
- 10.1. Market Analysis, Insights and Forecast - by Application
- 10.1.1. Retail
- 10.1.2. Manufacturing
- 10.1.3. Hospitality
- 10.1.4. Warehouses & Storage
- 10.1.5. Office Buildings
- 10.1.6. Others
- 10.2. Market Analysis, Insights and Forecast - by Types
- 10.2.1. Low Power (Below 300W)
- 10.2.2. High Power (Above 300W)
- 10.1. Market Analysis, Insights and Forecast - by Application
- 11. Competitive Analysis
- 11.1. Global Market Share Analysis 2024
- 11.2. Company Profiles
- 11.2.1 Koninklijke Philips
- 11.2.1.1. Overview
- 11.2.1.2. Products
- 11.2.1.3. SWOT Analysis
- 11.2.1.4. Recent Developments
- 11.2.1.5. Financials (Based on Availability)
- 11.2.2 Cree
- 11.2.2.1. Overview
- 11.2.2.2. Products
- 11.2.2.3. SWOT Analysis
- 11.2.2.4. Recent Developments
- 11.2.2.5. Financials (Based on Availability)
- 11.2.3 Osram
- 11.2.3.1. Overview
- 11.2.3.2. Products
- 11.2.3.3. SWOT Analysis
- 11.2.3.4. Recent Developments
- 11.2.3.5. Financials (Based on Availability)
- 11.2.4 General Electric
- 11.2.4.1. Overview
- 11.2.4.2. Products
- 11.2.4.3. SWOT Analysis
- 11.2.4.4. Recent Developments
- 11.2.4.5. Financials (Based on Availability)
- 11.2.5 Toshiba
- 11.2.5.1. Overview
- 11.2.5.2. Products
- 11.2.5.3. SWOT Analysis
- 11.2.5.4. Recent Developments
- 11.2.5.5. Financials (Based on Availability)
- 11.2.6 ABB(Cooper Industries)
- 11.2.6.1. Overview
- 11.2.6.2. Products
- 11.2.6.3. SWOT Analysis
- 11.2.6.4. Recent Developments
- 11.2.6.5. Financials (Based on Availability)
- 11.2.7 Eaton
- 11.2.7.1. Overview
- 11.2.7.2. Products
- 11.2.7.3. SWOT Analysis
- 11.2.7.4. Recent Developments
- 11.2.7.5. Financials (Based on Availability)
- 11.2.8 Illumitex
- 11.2.8.1. Overview
- 11.2.8.2. Products
- 11.2.8.3. SWOT Analysis
- 11.2.8.4. Recent Developments
- 11.2.8.5. Financials (Based on Availability)
- 11.2.9 Dialight
- 11.2.9.1. Overview
- 11.2.9.2. Products
- 11.2.9.3. SWOT Analysis
- 11.2.9.4. Recent Developments
- 11.2.9.5. Financials (Based on Availability)
- 11.2.10 Hubbell Lighting
- 11.2.10.1. Overview
- 11.2.10.2. Products
- 11.2.10.3. SWOT Analysis
- 11.2.10.4. Recent Developments
- 11.2.10.5. Financials (Based on Availability)
- 11.2.11 DECO Enterprises
- 11.2.11.1. Overview
- 11.2.11.2. Products
- 11.2.11.3. SWOT Analysis
- 11.2.11.4. Recent Developments
- 11.2.11.5. Financials (Based on Availability)
- 11.2.12 Zumtobel Group
- 11.2.12.1. Overview
- 11.2.12.2. Products
- 11.2.12.3. SWOT Analysis
- 11.2.12.4. Recent Developments
- 11.2.12.5. Financials (Based on Availability)
- 11.2.1 Koninklijke Philips
List of Figures
- Figure 1: Global Industrial and Commercial LED Lighting Revenue Breakdown (million, %) by Region 2024 & 2032
- Figure 2: North America Industrial and Commercial LED Lighting Revenue (million), by Application 2024 & 2032
- Figure 3: North America Industrial and Commercial LED Lighting Revenue Share (%), by Application 2024 & 2032
- Figure 4: North America Industrial and Commercial LED Lighting Revenue (million), by Types 2024 & 2032
- Figure 5: North America Industrial and Commercial LED Lighting Revenue Share (%), by Types 2024 & 2032
- Figure 6: North America Industrial and Commercial LED Lighting Revenue (million), by Country 2024 & 2032
- Figure 7: North America Industrial and Commercial LED Lighting Revenue Share (%), by Country 2024 & 2032
- Figure 8: South America Industrial and Commercial LED Lighting Revenue (million), by Application 2024 & 2032
- Figure 9: South America Industrial and Commercial LED Lighting Revenue Share (%), by Application 2024 & 2032
- Figure 10: South America Industrial and Commercial LED Lighting Revenue (million), by Types 2024 & 2032
- Figure 11: South America Industrial and Commercial LED Lighting Revenue Share (%), by Types 2024 & 2032
- Figure 12: South America Industrial and Commercial LED Lighting Revenue (million), by Country 2024 & 2032
- Figure 13: South America Industrial and Commercial LED Lighting Revenue Share (%), by Country 2024 & 2032
- Figure 14: Europe Industrial and Commercial LED Lighting Revenue (million), by Application 2024 & 2032
- Figure 15: Europe Industrial and Commercial LED Lighting Revenue Share (%), by Application 2024 & 2032
- Figure 16: Europe Industrial and Commercial LED Lighting Revenue (million), by Types 2024 & 2032
- Figure 17: Europe Industrial and Commercial LED Lighting Revenue Share (%), by Types 2024 & 2032
- Figure 18: Europe Industrial and Commercial LED Lighting Revenue (million), by Country 2024 & 2032
- Figure 19: Europe Industrial and Commercial LED Lighting Revenue Share (%), by Country 2024 & 2032
- Figure 20: Middle East & Africa Industrial and Commercial LED Lighting Revenue (million), by Application 2024 & 2032
- Figure 21: Middle East & Africa Industrial and Commercial LED Lighting Revenue Share (%), by Application 2024 & 2032
- Figure 22: Middle East & Africa Industrial and Commercial LED Lighting Revenue (million), by Types 2024 & 2032
- Figure 23: Middle East & Africa Industrial and Commercial LED Lighting Revenue Share (%), by Types 2024 & 2032
- Figure 24: Middle East & Africa Industrial and Commercial LED Lighting Revenue (million), by Country 2024 & 2032
- Figure 25: Middle East & Africa Industrial and Commercial LED Lighting Revenue Share (%), by Country 2024 & 2032
- Figure 26: Asia Pacific Industrial and Commercial LED Lighting Revenue (million), by Application 2024 & 2032
- Figure 27: Asia Pacific Industrial and Commercial LED Lighting Revenue Share (%), by Application 2024 & 2032
- Figure 28: Asia Pacific Industrial and Commercial LED Lighting Revenue (million), by Types 2024 & 2032
- Figure 29: Asia Pacific Industrial and Commercial LED Lighting Revenue Share (%), by Types 2024 & 2032
- Figure 30: Asia Pacific Industrial and Commercial LED Lighting Revenue (million), by Country 2024 & 2032
- Figure 31: Asia Pacific Industrial and Commercial LED Lighting Revenue Share (%), by Country 2024 & 2032
List of Tables
- Table 1: Global Industrial and Commercial LED Lighting Revenue million Forecast, by Region 2019 & 2032
- Table 2: Global Industrial and Commercial LED Lighting Revenue million Forecast, by Application 2019 & 2032
- Table 3: Global Industrial and Commercial LED Lighting Revenue million Forecast, by Types 2019 & 2032
- Table 4: Global Industrial and Commercial LED Lighting Revenue million Forecast, by Region 2019 & 2032
- Table 5: Global Industrial and Commercial LED Lighting Revenue million Forecast, by Application 2019 & 2032
- Table 6: Global Industrial and Commercial LED Lighting Revenue million Forecast, by Types 2019 & 2032
- Table 7: Global Industrial and Commercial LED Lighting Revenue million Forecast, by Country 2019 & 2032
- Table 8: United States Industrial and Commercial LED Lighting Revenue (million) Forecast, by Application 2019 & 2032
- Table 9: Canada Industrial and Commercial LED Lighting Revenue (million) Forecast, by Application 2019 & 2032
- Table 10: Mexico Industrial and Commercial LED Lighting Revenue (million) Forecast, by Application 2019 & 2032
- Table 11: Global Industrial and Commercial LED Lighting Revenue million Forecast, by Application 2019 & 2032
- Table 12: Global Industrial and Commercial LED Lighting Revenue million Forecast, by Types 2019 & 2032
- Table 13: Global Industrial and Commercial LED Lighting Revenue million Forecast, by Country 2019 & 2032
- Table 14: Brazil Industrial and Commercial LED Lighting Revenue (million) Forecast, by Application 2019 & 2032
- Table 15: Argentina Industrial and Commercial LED Lighting Revenue (million) Forecast, by Application 2019 & 2032
- Table 16: Rest of South America Industrial and Commercial LED Lighting Revenue (million) Forecast, by Application 2019 & 2032
- Table 17: Global Industrial and Commercial LED Lighting Revenue million Forecast, by Application 2019 & 2032
- Table 18: Global Industrial and Commercial LED Lighting Revenue million Forecast, by Types 2019 & 2032
- Table 19: Global Industrial and Commercial LED Lighting Revenue million Forecast, by Country 2019 & 2032
- Table 20: United Kingdom Industrial and Commercial LED Lighting Revenue (million) Forecast, by Application 2019 & 2032
- Table 21: Germany Industrial and Commercial LED Lighting Revenue (million) Forecast, by Application 2019 & 2032
- Table 22: France Industrial and Commercial LED Lighting Revenue (million) Forecast, by Application 2019 & 2032
- Table 23: Italy Industrial and Commercial LED Lighting Revenue (million) Forecast, by Application 2019 & 2032
- Table 24: Spain Industrial and Commercial LED Lighting Revenue (million) Forecast, by Application 2019 & 2032
- Table 25: Russia Industrial and Commercial LED Lighting Revenue (million) Forecast, by Application 2019 & 2032
- Table 26: Benelux Industrial and Commercial LED Lighting Revenue (million) Forecast, by Application 2019 & 2032
- Table 27: Nordics Industrial and Commercial LED Lighting Revenue (million) Forecast, by Application 2019 & 2032
- Table 28: Rest of Europe Industrial and Commercial LED Lighting Revenue (million) Forecast, by Application 2019 & 2032
- Table 29: Global Industrial and Commercial LED Lighting Revenue million Forecast, by Application 2019 & 2032
- Table 30: Global Industrial and Commercial LED Lighting Revenue million Forecast, by Types 2019 & 2032
- Table 31: Global Industrial and Commercial LED Lighting Revenue million Forecast, by Country 2019 & 2032
- Table 32: Turkey Industrial and Commercial LED Lighting Revenue (million) Forecast, by Application 2019 & 2032
- Table 33: Israel Industrial and Commercial LED Lighting Revenue (million) Forecast, by Application 2019 & 2032
- Table 34: GCC Industrial and Commercial LED Lighting Revenue (million) Forecast, by Application 2019 & 2032
- Table 35: North Africa Industrial and Commercial LED Lighting Revenue (million) Forecast, by Application 2019 & 2032
- Table 36: South Africa Industrial and Commercial LED Lighting Revenue (million) Forecast, by Application 2019 & 2032
- Table 37: Rest of Middle East & Africa Industrial and Commercial LED Lighting Revenue (million) Forecast, by Application 2019 & 2032
- Table 38: Global Industrial and Commercial LED Lighting Revenue million Forecast, by Application 2019 & 2032
- Table 39: Global Industrial and Commercial LED Lighting Revenue million Forecast, by Types 2019 & 2032
- Table 40: Global Industrial and Commercial LED Lighting Revenue million Forecast, by Country 2019 & 2032
- Table 41: China Industrial and Commercial LED Lighting Revenue (million) Forecast, by Application 2019 & 2032
- Table 42: India Industrial and Commercial LED Lighting Revenue (million) Forecast, by Application 2019 & 2032
- Table 43: Japan Industrial and Commercial LED Lighting Revenue (million) Forecast, by Application 2019 & 2032
- Table 44: South Korea Industrial and Commercial LED Lighting Revenue (million) Forecast, by Application 2019 & 2032
- Table 45: ASEAN Industrial and Commercial LED Lighting Revenue (million) Forecast, by Application 2019 & 2032
- Table 46: Oceania Industrial and Commercial LED Lighting Revenue (million) Forecast, by Application 2019 & 2032
- Table 47: Rest of Asia Pacific Industrial and Commercial LED Lighting Revenue (million) Forecast, by Application 2019 & 2032
Frequently Asked Questions
1. What is the projected Compound Annual Growth Rate (CAGR) of the Industrial and Commercial LED Lighting?
The projected CAGR is approximately XX%.
2. Which companies are prominent players in the Industrial and Commercial LED Lighting?
Key companies in the market include Koninklijke Philips, Cree, Osram, General Electric, Toshiba, ABB(Cooper Industries), Eaton, Illumitex, Dialight, Hubbell Lighting, DECO Enterprises, Zumtobel Group.
3. What are the main segments of the Industrial and Commercial LED Lighting?
The market segments include Application, Types.
4. Can you provide details about the market size?
The market size is estimated to be USD XXX million as of 2022.
5. What are some drivers contributing to market growth?
N/A
6. What are the notable trends driving market growth?
N/A
7. Are there any restraints impacting market growth?
N/A
8. Can you provide examples of recent developments in the market?
N/A
9. What pricing options are available for accessing the report?
Pricing options include single-user, multi-user, and enterprise licenses priced at USD 2900.00, USD 4350.00, and USD 5800.00 respectively.
10. Is the market size provided in terms of value or volume?
The market size is provided in terms of value, measured in million.
11. Are there any specific market keywords associated with the report?
Yes, the market keyword associated with the report is "Industrial and Commercial LED Lighting," which aids in identifying and referencing the specific market segment covered.
12. How do I determine which pricing option suits my needs best?
The pricing options vary based on user requirements and access needs. Individual users may opt for single-user licenses, while businesses requiring broader access may choose multi-user or enterprise licenses for cost-effective access to the report.
13. Are there any additional resources or data provided in the Industrial and Commercial LED Lighting report?
While the report offers comprehensive insights, it's advisable to review the specific contents or supplementary materials provided to ascertain if additional resources or data are available.
14. How can I stay updated on further developments or reports in the Industrial and Commercial LED Lighting?
To stay informed about further developments, trends, and reports in the Industrial and Commercial LED Lighting, consider subscribing to industry newsletters, following relevant companies and organizations, or regularly checking reputable industry news sources and publications.
Methodology
Step 1 - Identification of Relevant Samples Size from Population Database


Step 2 - Approaches for Defining Global Market Size (Value, Volume* & Price*)

Note*: In applicable scenarios
Step 3 - Data Sources
Primary Research
- Web Analytics
- Survey Reports
- Research Institute
- Latest Research Reports
- Opinion Leaders
Secondary Research
- Annual Reports
- White Paper
- Latest Press Release
- Industry Association
- Paid Database
- Investor Presentations

Step 4 - Data Triangulation
Involves using different sources of information in order to increase the validity of a study
These sources are likely to be stakeholders in a program - participants, other researchers, program staff, other community members, and so on.
Then we put all data in single framework & apply various statistical tools to find out the dynamic on the market.
During the analysis stage, feedback from the stakeholder groups would be compared to determine areas of agreement as well as areas of divergence
