

Key Insights
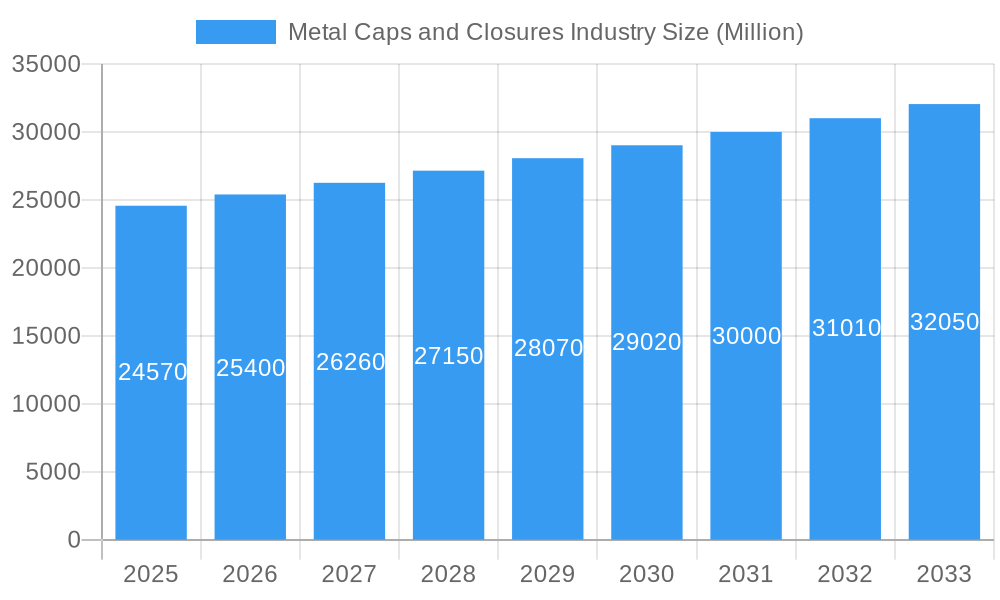
The global metal caps and closures market, valued at $24.57 billion in 2025, is projected to experience steady growth, driven by the burgeoning food and beverage industry, particularly within the non-alcoholic segment. A Compound Annual Growth Rate (CAGR) of 3.38% is anticipated from 2025 to 2033, indicating a robust market outlook. Increased consumer demand for convenient and tamper-evident packaging solutions fuels this growth. The prevalence of crown caps, screw caps, and twist metal caps across various applications, including pharmaceuticals and personal care, further supports market expansion. While aluminum remains a dominant material due to its lightweight and recyclable nature, the market also sees significant utilization of steel and tin, each catering to specific product requirements and price sensitivities. Growth is expected to be particularly strong in developing economies in Asia, driven by rising disposable incomes and changing consumption patterns. However, fluctuating raw material prices and the increasing adoption of alternative packaging materials present challenges to sustained market growth. The competitive landscape is characterized by a mix of large multinational corporations and regional players, with intense competition based on pricing, innovation, and supply chain efficiency.
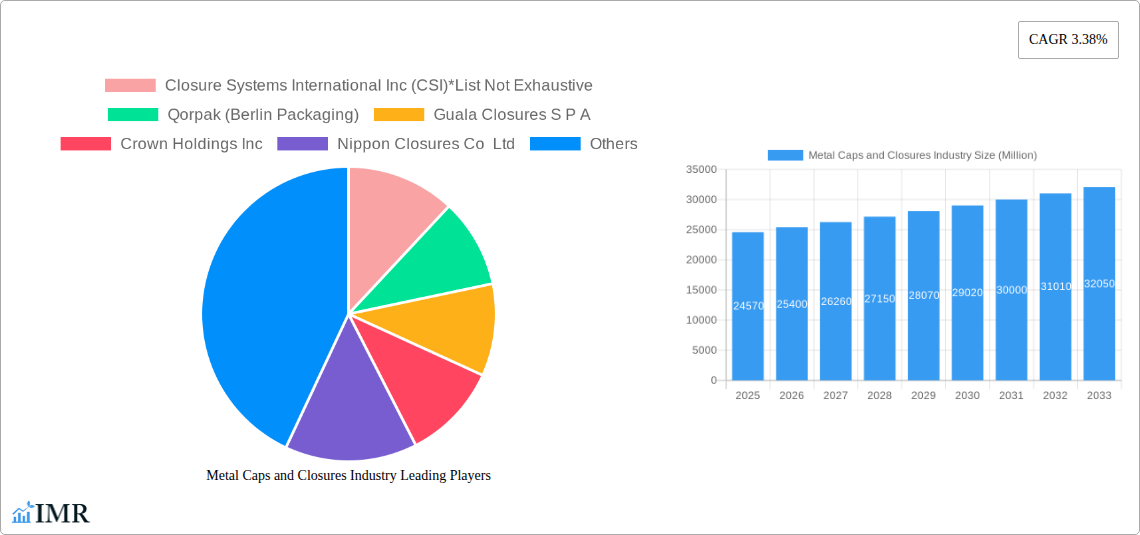
Metal Caps and Closures Industry Market Size (In Billion)
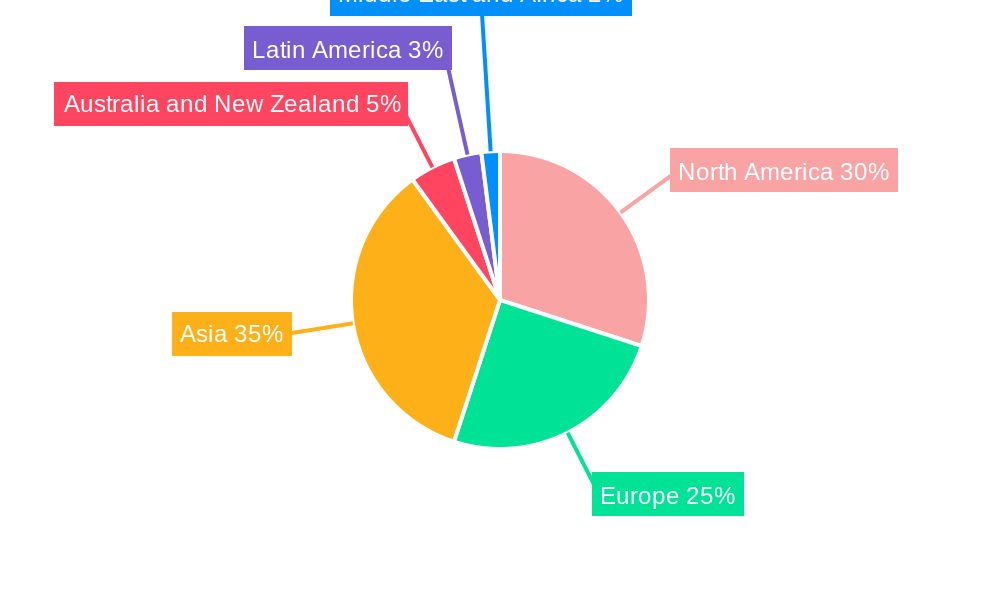
The segment analysis reveals a significant contribution from the food and beverage sector, with beverages accounting for a major share. Within closures, crown caps maintain a sizable market share due to their long-standing use and suitability for carbonated drinks. However, the screw cap segment is witnessing substantial growth due to its ease of use and consumer preference for convenience. The adoption of innovative closure types, such as easy-open ends and ROPP (Roll-On Pilfer Proof) metal caps, is expected to drive further market segmentation and expansion. Regional variations in market size will be influenced by factors such as economic development, consumer preferences, and regulatory frameworks. North America and Europe are anticipated to maintain significant market shares, while Asia-Pacific is poised for substantial growth due to its rapidly expanding consumer base. Continuous innovation in closure design, focusing on sustainability and improved functionality, will be a key determinant of future market trends.
Metal Caps and Closures Industry Company Market Share
Metal Caps and Closures Industry Market Report: 2019-2033
This comprehensive report provides a detailed analysis of the global metal caps and closures industry, offering invaluable insights for industry professionals, investors, and strategic decision-makers. The study period spans from 2019 to 2033, with a base year of 2025 and a forecast period from 2025 to 2033. The report covers key segments, including material types (aluminum, steel, tin), closure types (crown caps, screw caps, twist metal caps, easy open ends, ROPP metal caps), and end-user industries (food, beverages, pharmaceuticals, personal care, and others). Market size is presented in million units.
Metal Caps and Closures Industry Market Dynamics & Structure
The metal caps and closures market is characterized by a moderately consolidated structure, with several major players commanding significant market share. The industry witnesses continuous technological innovation, driven by the need for improved sealing performance, sustainability, and ease of use. Stringent regulatory frameworks concerning food safety and environmental protection influence manufacturing practices and material selection. Competitive pressures from alternative packaging solutions, such as plastic closures, necessitate continuous product development and differentiation. End-user demographics, particularly shifting consumer preferences towards convenience and eco-friendly packaging, also influence market trends. Mergers and acquisitions (M&A) activity remains moderately high, reflecting industry consolidation and the pursuit of economies of scale.
- Market Concentration: Moderately consolidated, with top 10 players holding approximately xx% market share in 2024.
- Technological Innovation: Focus on lightweighting, improved sealing, tamper-evident features, and sustainable materials.
- Regulatory Landscape: Stringent regulations on food safety and recyclability are driving innovation in materials and manufacturing processes.
- Competitive Substitutes: Plastic and other alternative closure materials present significant competitive pressure.
- M&A Activity: Moderate level of M&A activity, primarily driven by consolidation and expansion into new markets. xx deals recorded between 2019 and 2024.
Metal Caps and Closures Industry Growth Trends & Insights
The global metal caps and closures market has experienced consistent growth over the historical period (2019-2024), driven by the robust growth in the food and beverage industry, particularly in emerging economies. The increasing demand for packaged food and beverages, coupled with the preference for metal closures due to their barrier properties and recyclability, has fueled market expansion. Technological advancements, including the introduction of innovative closure designs and sustainable materials, have further stimulated growth. Consumer behavior shifts towards convenience and premium packaging are also contributing factors. The market is expected to maintain a steady CAGR of xx% during the forecast period (2025-2033), reaching xx million units by 2033. Market penetration is expected to increase by xx% in emerging markets. Technological disruptions, such as the adoption of smart packaging solutions, are expected to shape future growth trajectories.
Dominant Regions, Countries, or Segments in Metal Caps and Closures Industry
The Asia-Pacific region is projected to be the dominant region in the metal caps and closures market during the forecast period, followed by North America and Europe. Within the segments, aluminum closures are expected to maintain a leading position due to their lightweight nature, recyclability, and cost-effectiveness. Crown caps remain the dominant closure type, particularly in the beverage industry. The food and beverage sector continues to be the largest end-user, driven by the growing demand for packaged food and beverages globally.
- Key Drivers (Asia-Pacific): Rapid economic growth, rising disposable incomes, increasing urbanization, and expanding food and beverage industries.
- Dominance Factors (Aluminum): Lightweight, recyclable, cost-effective, and good barrier properties.
- Growth Potential (Crown Caps): High demand in the beverage industry, particularly carbonated soft drinks and beer.
- Market Share (Food & Beverage): xx% in 2024, expected to reach xx% by 2033.
Metal Caps and Closures Industry Product Landscape
Metal caps and closures are constantly evolving, incorporating features such as tamper-evident seals, improved sealing mechanisms, and sustainable materials. Innovations focus on enhancing product safety, shelf life, and consumer convenience. Technological advancements, such as lightweighting and improved recyclability, are key aspects of product development. Unique selling propositions include superior barrier properties, recyclability, and customization options to meet specific brand requirements.
Key Drivers, Barriers & Challenges in Metal Caps and Closures Industry
Key Drivers:
- Growing demand for packaged food and beverages.
- Increasing consumer preference for convenience and tamper-evident packaging.
- Technological advancements leading to improved product performance and sustainability.
- Stringent government regulations on food safety and environmental protection.
Key Challenges:
- Fluctuations in raw material prices (e.g., aluminum, steel).
- Intense competition from alternative packaging materials.
- Supply chain disruptions impacting production and distribution.
- Regulatory hurdles and compliance costs related to environmental regulations.
Emerging Opportunities in Metal Caps and Closures Industry
- Expansion into untapped markets in developing economies.
- Development of sustainable and eco-friendly metal closures.
- Growth in the demand for customized and specialty closures.
- Innovation in smart packaging solutions for improved product traceability and consumer engagement.
Growth Accelerators in the Metal Caps and Closures Industry Industry
Technological breakthroughs in material science and manufacturing processes, coupled with strategic partnerships and collaborations across the value chain, are key growth accelerators. Market expansion strategies targeting emerging economies and new applications (e.g., pharmaceuticals, personal care) will further fuel market growth. Focus on sustainability and recyclability is attracting consumers and investors.
Key Players Shaping the Metal Caps and Closures Industry Market
- Closure Systems International Inc (CSI)
- Qorpak (Berlin Packaging)
- Guala Closures S P A
- Crown Holdings Inc
- Nippon Closures Co Ltd
- Amcor PLC
- Pelliconi & C SpA
- Sks Bottle & Packaging Inc
- Alameda Packaging LLC
- Silgan White Cap LLC
- O Berk Company
Notable Milestones in Metal Caps and Closures Industry Sector
- January 2023: Guala Closures Group achieves SBTi validation for its 2030 GHG emission targets, aligning with the 1.5°C goal.
- March 2022: Pelliconi opens an innovation outpost in San Francisco, focusing on identifying emerging trends in the Food & Beverage industry.
In-Depth Metal Caps and Closures Industry Market Outlook
The metal caps and closures market is poised for continued growth, driven by robust demand from the food and beverage sector, technological advancements, and increasing focus on sustainability. Strategic opportunities lie in expanding into emerging markets, developing innovative closure designs, and adopting sustainable manufacturing practices. The market's future is bright, with significant potential for growth and innovation.
Metal Caps and Closures Industry Segmentation
-
1. Material Type
- 1.1. Aluminium
- 1.2. Steel
- 1.3. Tin
-
2. Closures Type
- 2.1. Crown Caps
- 2.2. Screw Caps
- 2.3. Twist Metal Caps
- 2.4. Other Cl
-
3. End-User Industry
- 3.1. Food
-
3.2. Beverages
- 3.2.1. Alcoholic
- 3.2.2. Non-Alcoholic
- 3.3. Pharmaceuticals
- 3.4. Personal Care
- 3.5. Other End-User Industries
Metal Caps and Closures Industry Segmentation By Geography
- 1. North America
- 2. Europe
- 3. Asia
- 4. Australia and New Zealand
- 5. Latin America
- 6. Middle East and Africa
Metal Caps and Closures Industry Regional Market Share
Geographic Coverage of Metal Caps and Closures Industry
Metal Caps and Closures Industry REPORT HIGHLIGHTS
| Aspects | Details |
|---|---|
| Study Period | 2020-2034 |
| Base Year | 2025 |
| Estimated Year | 2026 |
| Forecast Period | 2026-2034 |
| Historical Period | 2020-2025 |
| Growth Rate | CAGR of 3.38% from 2020-2034 |
| Segmentation |
|
Table of Contents
- 1. Introduction
- 1.1. Research Scope
- 1.2. Market Segmentation
- 1.3. Research Methodology
- 1.4. Definitions and Assumptions
- 2. Executive Summary
- 2.1. Introduction
- 3. Market Dynamics
- 3.1. Introduction
- 3.2. Market Drivers
- 3.2.1. Increasing Consumption of Beverages with a Rising Need for Sustainable Packaging Materials; Superior Properties Compared to Other Closure Materials
- 3.3. Market Restrains
- 3.3.1. High Adoption Rate of Other Types of Closure Materials
- 3.4. Market Trends
- 3.4.1. Pharmaceutical Application Offers Potential Growth
- 4. Market Factor Analysis
- 4.1. Porters Five Forces
- 4.2. Supply/Value Chain
- 4.3. PESTEL analysis
- 4.4. Market Entropy
- 4.5. Patent/Trademark Analysis
- 5. Global Metal Caps and Closures Industry Analysis, Insights and Forecast, 2020-2032
- 5.1. Market Analysis, Insights and Forecast - by Material Type
- 5.1.1. Aluminium
- 5.1.2. Steel
- 5.1.3. Tin
- 5.2. Market Analysis, Insights and Forecast - by Closures Type
- 5.2.1. Crown Caps
- 5.2.2. Screw Caps
- 5.2.3. Twist Metal Caps
- 5.2.4. Other Cl
- 5.3. Market Analysis, Insights and Forecast - by End-User Industry
- 5.3.1. Food
- 5.3.2. Beverages
- 5.3.2.1. Alcoholic
- 5.3.2.2. Non-Alcoholic
- 5.3.3. Pharmaceuticals
- 5.3.4. Personal Care
- 5.3.5. Other End-User Industries
- 5.4. Market Analysis, Insights and Forecast - by Region
- 5.4.1. North America
- 5.4.2. Europe
- 5.4.3. Asia
- 5.4.4. Australia and New Zealand
- 5.4.5. Latin America
- 5.4.6. Middle East and Africa
- 5.1. Market Analysis, Insights and Forecast - by Material Type
- 6. North America Metal Caps and Closures Industry Analysis, Insights and Forecast, 2020-2032
- 6.1. Market Analysis, Insights and Forecast - by Material Type
- 6.1.1. Aluminium
- 6.1.2. Steel
- 6.1.3. Tin
- 6.2. Market Analysis, Insights and Forecast - by Closures Type
- 6.2.1. Crown Caps
- 6.2.2. Screw Caps
- 6.2.3. Twist Metal Caps
- 6.2.4. Other Cl
- 6.3. Market Analysis, Insights and Forecast - by End-User Industry
- 6.3.1. Food
- 6.3.2. Beverages
- 6.3.2.1. Alcoholic
- 6.3.2.2. Non-Alcoholic
- 6.3.3. Pharmaceuticals
- 6.3.4. Personal Care
- 6.3.5. Other End-User Industries
- 6.1. Market Analysis, Insights and Forecast - by Material Type
- 7. Europe Metal Caps and Closures Industry Analysis, Insights and Forecast, 2020-2032
- 7.1. Market Analysis, Insights and Forecast - by Material Type
- 7.1.1. Aluminium
- 7.1.2. Steel
- 7.1.3. Tin
- 7.2. Market Analysis, Insights and Forecast - by Closures Type
- 7.2.1. Crown Caps
- 7.2.2. Screw Caps
- 7.2.3. Twist Metal Caps
- 7.2.4. Other Cl
- 7.3. Market Analysis, Insights and Forecast - by End-User Industry
- 7.3.1. Food
- 7.3.2. Beverages
- 7.3.2.1. Alcoholic
- 7.3.2.2. Non-Alcoholic
- 7.3.3. Pharmaceuticals
- 7.3.4. Personal Care
- 7.3.5. Other End-User Industries
- 7.1. Market Analysis, Insights and Forecast - by Material Type
- 8. Asia Metal Caps and Closures Industry Analysis, Insights and Forecast, 2020-2032
- 8.1. Market Analysis, Insights and Forecast - by Material Type
- 8.1.1. Aluminium
- 8.1.2. Steel
- 8.1.3. Tin
- 8.2. Market Analysis, Insights and Forecast - by Closures Type
- 8.2.1. Crown Caps
- 8.2.2. Screw Caps
- 8.2.3. Twist Metal Caps
- 8.2.4. Other Cl
- 8.3. Market Analysis, Insights and Forecast - by End-User Industry
- 8.3.1. Food
- 8.3.2. Beverages
- 8.3.2.1. Alcoholic
- 8.3.2.2. Non-Alcoholic
- 8.3.3. Pharmaceuticals
- 8.3.4. Personal Care
- 8.3.5. Other End-User Industries
- 8.1. Market Analysis, Insights and Forecast - by Material Type
- 9. Australia and New Zealand Metal Caps and Closures Industry Analysis, Insights and Forecast, 2020-2032
- 9.1. Market Analysis, Insights and Forecast - by Material Type
- 9.1.1. Aluminium
- 9.1.2. Steel
- 9.1.3. Tin
- 9.2. Market Analysis, Insights and Forecast - by Closures Type
- 9.2.1. Crown Caps
- 9.2.2. Screw Caps
- 9.2.3. Twist Metal Caps
- 9.2.4. Other Cl
- 9.3. Market Analysis, Insights and Forecast - by End-User Industry
- 9.3.1. Food
- 9.3.2. Beverages
- 9.3.2.1. Alcoholic
- 9.3.2.2. Non-Alcoholic
- 9.3.3. Pharmaceuticals
- 9.3.4. Personal Care
- 9.3.5. Other End-User Industries
- 9.1. Market Analysis, Insights and Forecast - by Material Type
- 10. Latin America Metal Caps and Closures Industry Analysis, Insights and Forecast, 2020-2032
- 10.1. Market Analysis, Insights and Forecast - by Material Type
- 10.1.1. Aluminium
- 10.1.2. Steel
- 10.1.3. Tin
- 10.2. Market Analysis, Insights and Forecast - by Closures Type
- 10.2.1. Crown Caps
- 10.2.2. Screw Caps
- 10.2.3. Twist Metal Caps
- 10.2.4. Other Cl
- 10.3. Market Analysis, Insights and Forecast - by End-User Industry
- 10.3.1. Food
- 10.3.2. Beverages
- 10.3.2.1. Alcoholic
- 10.3.2.2. Non-Alcoholic
- 10.3.3. Pharmaceuticals
- 10.3.4. Personal Care
- 10.3.5. Other End-User Industries
- 10.1. Market Analysis, Insights and Forecast - by Material Type
- 11. Middle East and Africa Metal Caps and Closures Industry Analysis, Insights and Forecast, 2020-2032
- 11.1. Market Analysis, Insights and Forecast - by Material Type
- 11.1.1. Aluminium
- 11.1.2. Steel
- 11.1.3. Tin
- 11.2. Market Analysis, Insights and Forecast - by Closures Type
- 11.2.1. Crown Caps
- 11.2.2. Screw Caps
- 11.2.3. Twist Metal Caps
- 11.2.4. Other Cl
- 11.3. Market Analysis, Insights and Forecast - by End-User Industry
- 11.3.1. Food
- 11.3.2. Beverages
- 11.3.2.1. Alcoholic
- 11.3.2.2. Non-Alcoholic
- 11.3.3. Pharmaceuticals
- 11.3.4. Personal Care
- 11.3.5. Other End-User Industries
- 11.1. Market Analysis, Insights and Forecast - by Material Type
- 12. Competitive Analysis
- 12.1. Global Market Share Analysis 2025
- 12.2. Company Profiles
- 12.2.1 Closure Systems International Inc (CSI)*List Not Exhaustive
- 12.2.1.1. Overview
- 12.2.1.2. Products
- 12.2.1.3. SWOT Analysis
- 12.2.1.4. Recent Developments
- 12.2.1.5. Financials (Based on Availability)
- 12.2.2 Qorpak (Berlin Packaging)
- 12.2.2.1. Overview
- 12.2.2.2. Products
- 12.2.2.3. SWOT Analysis
- 12.2.2.4. Recent Developments
- 12.2.2.5. Financials (Based on Availability)
- 12.2.3 Guala Closures S P A
- 12.2.3.1. Overview
- 12.2.3.2. Products
- 12.2.3.3. SWOT Analysis
- 12.2.3.4. Recent Developments
- 12.2.3.5. Financials (Based on Availability)
- 12.2.4 Crown Holdings Inc
- 12.2.4.1. Overview
- 12.2.4.2. Products
- 12.2.4.3. SWOT Analysis
- 12.2.4.4. Recent Developments
- 12.2.4.5. Financials (Based on Availability)
- 12.2.5 Nippon Closures Co Ltd
- 12.2.5.1. Overview
- 12.2.5.2. Products
- 12.2.5.3. SWOT Analysis
- 12.2.5.4. Recent Developments
- 12.2.5.5. Financials (Based on Availability)
- 12.2.6 Amcor PLC
- 12.2.6.1. Overview
- 12.2.6.2. Products
- 12.2.6.3. SWOT Analysis
- 12.2.6.4. Recent Developments
- 12.2.6.5. Financials (Based on Availability)
- 12.2.7 Pelliconi & C SpA
- 12.2.7.1. Overview
- 12.2.7.2. Products
- 12.2.7.3. SWOT Analysis
- 12.2.7.4. Recent Developments
- 12.2.7.5. Financials (Based on Availability)
- 12.2.8 Sks Bottle & Packaging Inc
- 12.2.8.1. Overview
- 12.2.8.2. Products
- 12.2.8.3. SWOT Analysis
- 12.2.8.4. Recent Developments
- 12.2.8.5. Financials (Based on Availability)
- 12.2.9 Alameda Packaging LLC
- 12.2.9.1. Overview
- 12.2.9.2. Products
- 12.2.9.3. SWOT Analysis
- 12.2.9.4. Recent Developments
- 12.2.9.5. Financials (Based on Availability)
- 12.2.10 Silgan White Cap LLC
- 12.2.10.1. Overview
- 12.2.10.2. Products
- 12.2.10.3. SWOT Analysis
- 12.2.10.4. Recent Developments
- 12.2.10.5. Financials (Based on Availability)
- 12.2.11 O Berk Company
- 12.2.11.1. Overview
- 12.2.11.2. Products
- 12.2.11.3. SWOT Analysis
- 12.2.11.4. Recent Developments
- 12.2.11.5. Financials (Based on Availability)
- 12.2.1 Closure Systems International Inc (CSI)*List Not Exhaustive
List of Figures
- Figure 1: Global Metal Caps and Closures Industry Revenue Breakdown (Million, %) by Region 2025 & 2033
- Figure 2: North America Metal Caps and Closures Industry Revenue (Million), by Material Type 2025 & 2033
- Figure 3: North America Metal Caps and Closures Industry Revenue Share (%), by Material Type 2025 & 2033
- Figure 4: North America Metal Caps and Closures Industry Revenue (Million), by Closures Type 2025 & 2033
- Figure 5: North America Metal Caps and Closures Industry Revenue Share (%), by Closures Type 2025 & 2033
- Figure 6: North America Metal Caps and Closures Industry Revenue (Million), by End-User Industry 2025 & 2033
- Figure 7: North America Metal Caps and Closures Industry Revenue Share (%), by End-User Industry 2025 & 2033
- Figure 8: North America Metal Caps and Closures Industry Revenue (Million), by Country 2025 & 2033
- Figure 9: North America Metal Caps and Closures Industry Revenue Share (%), by Country 2025 & 2033
- Figure 10: Europe Metal Caps and Closures Industry Revenue (Million), by Material Type 2025 & 2033
- Figure 11: Europe Metal Caps and Closures Industry Revenue Share (%), by Material Type 2025 & 2033
- Figure 12: Europe Metal Caps and Closures Industry Revenue (Million), by Closures Type 2025 & 2033
- Figure 13: Europe Metal Caps and Closures Industry Revenue Share (%), by Closures Type 2025 & 2033
- Figure 14: Europe Metal Caps and Closures Industry Revenue (Million), by End-User Industry 2025 & 2033
- Figure 15: Europe Metal Caps and Closures Industry Revenue Share (%), by End-User Industry 2025 & 2033
- Figure 16: Europe Metal Caps and Closures Industry Revenue (Million), by Country 2025 & 2033
- Figure 17: Europe Metal Caps and Closures Industry Revenue Share (%), by Country 2025 & 2033
- Figure 18: Asia Metal Caps and Closures Industry Revenue (Million), by Material Type 2025 & 2033
- Figure 19: Asia Metal Caps and Closures Industry Revenue Share (%), by Material Type 2025 & 2033
- Figure 20: Asia Metal Caps and Closures Industry Revenue (Million), by Closures Type 2025 & 2033
- Figure 21: Asia Metal Caps and Closures Industry Revenue Share (%), by Closures Type 2025 & 2033
- Figure 22: Asia Metal Caps and Closures Industry Revenue (Million), by End-User Industry 2025 & 2033
- Figure 23: Asia Metal Caps and Closures Industry Revenue Share (%), by End-User Industry 2025 & 2033
- Figure 24: Asia Metal Caps and Closures Industry Revenue (Million), by Country 2025 & 2033
- Figure 25: Asia Metal Caps and Closures Industry Revenue Share (%), by Country 2025 & 2033
- Figure 26: Australia and New Zealand Metal Caps and Closures Industry Revenue (Million), by Material Type 2025 & 2033
- Figure 27: Australia and New Zealand Metal Caps and Closures Industry Revenue Share (%), by Material Type 2025 & 2033
- Figure 28: Australia and New Zealand Metal Caps and Closures Industry Revenue (Million), by Closures Type 2025 & 2033
- Figure 29: Australia and New Zealand Metal Caps and Closures Industry Revenue Share (%), by Closures Type 2025 & 2033
- Figure 30: Australia and New Zealand Metal Caps and Closures Industry Revenue (Million), by End-User Industry 2025 & 2033
- Figure 31: Australia and New Zealand Metal Caps and Closures Industry Revenue Share (%), by End-User Industry 2025 & 2033
- Figure 32: Australia and New Zealand Metal Caps and Closures Industry Revenue (Million), by Country 2025 & 2033
- Figure 33: Australia and New Zealand Metal Caps and Closures Industry Revenue Share (%), by Country 2025 & 2033
- Figure 34: Latin America Metal Caps and Closures Industry Revenue (Million), by Material Type 2025 & 2033
- Figure 35: Latin America Metal Caps and Closures Industry Revenue Share (%), by Material Type 2025 & 2033
- Figure 36: Latin America Metal Caps and Closures Industry Revenue (Million), by Closures Type 2025 & 2033
- Figure 37: Latin America Metal Caps and Closures Industry Revenue Share (%), by Closures Type 2025 & 2033
- Figure 38: Latin America Metal Caps and Closures Industry Revenue (Million), by End-User Industry 2025 & 2033
- Figure 39: Latin America Metal Caps and Closures Industry Revenue Share (%), by End-User Industry 2025 & 2033
- Figure 40: Latin America Metal Caps and Closures Industry Revenue (Million), by Country 2025 & 2033
- Figure 41: Latin America Metal Caps and Closures Industry Revenue Share (%), by Country 2025 & 2033
- Figure 42: Middle East and Africa Metal Caps and Closures Industry Revenue (Million), by Material Type 2025 & 2033
- Figure 43: Middle East and Africa Metal Caps and Closures Industry Revenue Share (%), by Material Type 2025 & 2033
- Figure 44: Middle East and Africa Metal Caps and Closures Industry Revenue (Million), by Closures Type 2025 & 2033
- Figure 45: Middle East and Africa Metal Caps and Closures Industry Revenue Share (%), by Closures Type 2025 & 2033
- Figure 46: Middle East and Africa Metal Caps and Closures Industry Revenue (Million), by End-User Industry 2025 & 2033
- Figure 47: Middle East and Africa Metal Caps and Closures Industry Revenue Share (%), by End-User Industry 2025 & 2033
- Figure 48: Middle East and Africa Metal Caps and Closures Industry Revenue (Million), by Country 2025 & 2033
- Figure 49: Middle East and Africa Metal Caps and Closures Industry Revenue Share (%), by Country 2025 & 2033
List of Tables
- Table 1: Global Metal Caps and Closures Industry Revenue Million Forecast, by Material Type 2020 & 2033
- Table 2: Global Metal Caps and Closures Industry Revenue Million Forecast, by Closures Type 2020 & 2033
- Table 3: Global Metal Caps and Closures Industry Revenue Million Forecast, by End-User Industry 2020 & 2033
- Table 4: Global Metal Caps and Closures Industry Revenue Million Forecast, by Region 2020 & 2033
- Table 5: Global Metal Caps and Closures Industry Revenue Million Forecast, by Material Type 2020 & 2033
- Table 6: Global Metal Caps and Closures Industry Revenue Million Forecast, by Closures Type 2020 & 2033
- Table 7: Global Metal Caps and Closures Industry Revenue Million Forecast, by End-User Industry 2020 & 2033
- Table 8: Global Metal Caps and Closures Industry Revenue Million Forecast, by Country 2020 & 2033
- Table 9: Global Metal Caps and Closures Industry Revenue Million Forecast, by Material Type 2020 & 2033
- Table 10: Global Metal Caps and Closures Industry Revenue Million Forecast, by Closures Type 2020 & 2033
- Table 11: Global Metal Caps and Closures Industry Revenue Million Forecast, by End-User Industry 2020 & 2033
- Table 12: Global Metal Caps and Closures Industry Revenue Million Forecast, by Country 2020 & 2033
- Table 13: Global Metal Caps and Closures Industry Revenue Million Forecast, by Material Type 2020 & 2033
- Table 14: Global Metal Caps and Closures Industry Revenue Million Forecast, by Closures Type 2020 & 2033
- Table 15: Global Metal Caps and Closures Industry Revenue Million Forecast, by End-User Industry 2020 & 2033
- Table 16: Global Metal Caps and Closures Industry Revenue Million Forecast, by Country 2020 & 2033
- Table 17: Global Metal Caps and Closures Industry Revenue Million Forecast, by Material Type 2020 & 2033
- Table 18: Global Metal Caps and Closures Industry Revenue Million Forecast, by Closures Type 2020 & 2033
- Table 19: Global Metal Caps and Closures Industry Revenue Million Forecast, by End-User Industry 2020 & 2033
- Table 20: Global Metal Caps and Closures Industry Revenue Million Forecast, by Country 2020 & 2033
- Table 21: Global Metal Caps and Closures Industry Revenue Million Forecast, by Material Type 2020 & 2033
- Table 22: Global Metal Caps and Closures Industry Revenue Million Forecast, by Closures Type 2020 & 2033
- Table 23: Global Metal Caps and Closures Industry Revenue Million Forecast, by End-User Industry 2020 & 2033
- Table 24: Global Metal Caps and Closures Industry Revenue Million Forecast, by Country 2020 & 2033
- Table 25: Global Metal Caps and Closures Industry Revenue Million Forecast, by Material Type 2020 & 2033
- Table 26: Global Metal Caps and Closures Industry Revenue Million Forecast, by Closures Type 2020 & 2033
- Table 27: Global Metal Caps and Closures Industry Revenue Million Forecast, by End-User Industry 2020 & 2033
- Table 28: Global Metal Caps and Closures Industry Revenue Million Forecast, by Country 2020 & 2033
Frequently Asked Questions
1. What is the projected Compound Annual Growth Rate (CAGR) of the Metal Caps and Closures Industry?
The projected CAGR is approximately 3.38%.
2. Which companies are prominent players in the Metal Caps and Closures Industry?
Key companies in the market include Closure Systems International Inc (CSI)*List Not Exhaustive, Qorpak (Berlin Packaging), Guala Closures S P A, Crown Holdings Inc, Nippon Closures Co Ltd, Amcor PLC, Pelliconi & C SpA, Sks Bottle & Packaging Inc, Alameda Packaging LLC, Silgan White Cap LLC, O Berk Company.
3. What are the main segments of the Metal Caps and Closures Industry?
The market segments include Material Type, Closures Type, End-User Industry.
4. Can you provide details about the market size?
The market size is estimated to be USD 24.57 Million as of 2022.
5. What are some drivers contributing to market growth?
Increasing Consumption of Beverages with a Rising Need for Sustainable Packaging Materials; Superior Properties Compared to Other Closure Materials.
6. What are the notable trends driving market growth?
Pharmaceutical Application Offers Potential Growth.
7. Are there any restraints impacting market growth?
High Adoption Rate of Other Types of Closure Materials.
8. Can you provide examples of recent developments in the market?
January 2023: Guala Closures Group, a prominent manufacturer of aluminum and specialty closures, received validation from the Science Based Targets Initiative (SBTi) for its 2030 Greenhouse Gas (GHG) emission targets. The targets have been recognized as meeting the ambitious 1.5°C goal, which is a significant milestone in the group's sustainability journey. The company has pledged to reduce absolute scope 1 and 2 GHG emissions by 44% by 2030, based on a 2020 starting point, by adopting science-based targets.
9. What pricing options are available for accessing the report?
Pricing options include single-user, multi-user, and enterprise licenses priced at USD 4750, USD 5250, and USD 8750 respectively.
10. Is the market size provided in terms of value or volume?
The market size is provided in terms of value, measured in Million.
11. Are there any specific market keywords associated with the report?
Yes, the market keyword associated with the report is "Metal Caps and Closures Industry," which aids in identifying and referencing the specific market segment covered.
12. How do I determine which pricing option suits my needs best?
The pricing options vary based on user requirements and access needs. Individual users may opt for single-user licenses, while businesses requiring broader access may choose multi-user or enterprise licenses for cost-effective access to the report.
13. Are there any additional resources or data provided in the Metal Caps and Closures Industry report?
While the report offers comprehensive insights, it's advisable to review the specific contents or supplementary materials provided to ascertain if additional resources or data are available.
14. How can I stay updated on further developments or reports in the Metal Caps and Closures Industry?
To stay informed about further developments, trends, and reports in the Metal Caps and Closures Industry, consider subscribing to industry newsletters, following relevant companies and organizations, or regularly checking reputable industry news sources and publications.
Methodology
Step 1 - Identification of Relevant Samples Size from Population Database


Step 2 - Approaches for Defining Global Market Size (Value, Volume* & Price*)

Note*: In applicable scenarios
Step 3 - Data Sources
Primary Research
- Web Analytics
- Survey Reports
- Research Institute
- Latest Research Reports
- Opinion Leaders
Secondary Research
- Annual Reports
- White Paper
- Latest Press Release
- Industry Association
- Paid Database
- Investor Presentations

Step 4 - Data Triangulation
Involves using different sources of information in order to increase the validity of a study
These sources are likely to be stakeholders in a program - participants, other researchers, program staff, other community members, and so on.
Then we put all data in single framework & apply various statistical tools to find out the dynamic on the market.
During the analysis stage, feedback from the stakeholder groups would be compared to determine areas of agreement as well as areas of divergence