

Key Insights
The North American (NA) ampoules packaging market, encompassing glass and plastic materials, is experiencing robust growth, driven by the increasing demand for injectable pharmaceuticals and the rising prevalence of chronic diseases. The market's Compound Annual Growth Rate (CAGR) of 9.00% from 2019 to 2024 suggests a significant expansion, projected to continue throughout the forecast period (2025-2033). Key drivers include the pharmaceutical industry's continuous innovation in drug delivery systems, stringent regulatory requirements favoring sterile packaging solutions like ampoules, and the expanding biotechnology sector. Furthermore, advancements in materials science are leading to the development of more durable, lightweight, and environmentally friendly ampoule packaging options. While the market faces certain restraints, such as fluctuating raw material prices and the potential for supply chain disruptions, these are likely to be offset by the overall positive growth trajectory. The United States and Canada, constituting the core of the NA market, demonstrate strong demand, with the US holding a larger market share due to its extensive pharmaceutical manufacturing and distribution networks. Leading players like Wheaton Group, James Alexander Corporation, and Stevanato Group are shaping market dynamics through strategic partnerships, capacity expansions, and technological advancements. Market segmentation by material (glass and plastic) reveals a preference for glass ampoules due to their inertness and barrier properties, although plastic ampoules are gaining traction due to cost-effectiveness and reduced breakage risk.
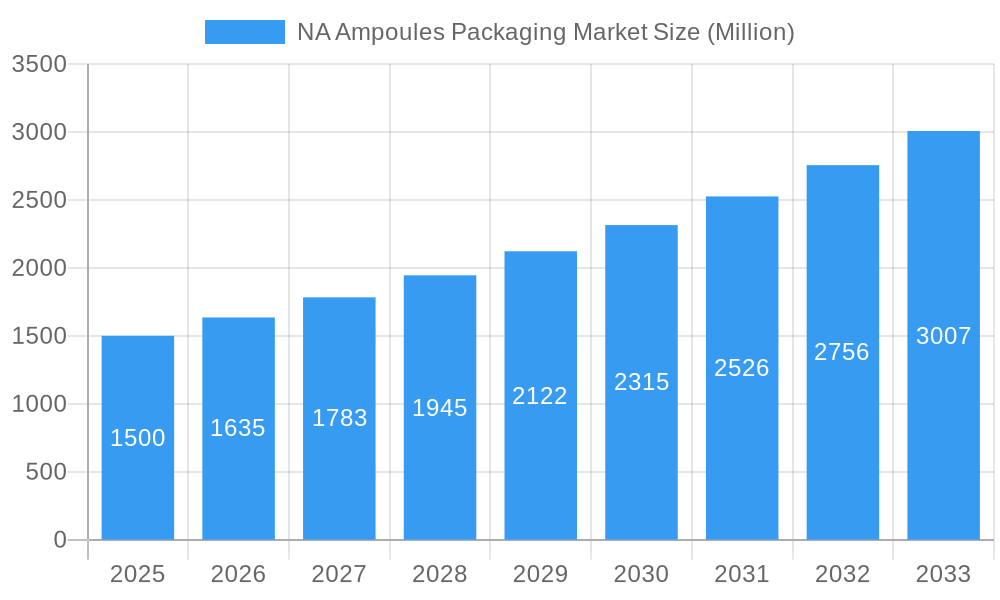
NA Ampoules Packaging Market Market Size (In Billion)
The forecast for the NA ampoules packaging market from 2025 onwards anticipates sustained expansion, fueled by the continuous growth of the pharmaceutical and biotechnology sectors. The predicted CAGR suggests a substantial increase in market value over the coming years. Geographic expansion and diversification of production facilities by key players are likely to further solidify the market's position. Technological advancements will likely focus on improving the sterility, durability, and ease of use of ampoule packaging. The increasing adoption of advanced technologies in manufacturing processes, such as automation and robotics, will enhance efficiency and reduce production costs. Ongoing regulatory scrutiny will ensure the safety and quality of ampoules and their packaging, contributing to overall market stability and growth. Competition will likely intensify as new entrants and existing players vie for market share, driving innovation and potentially lowering prices.
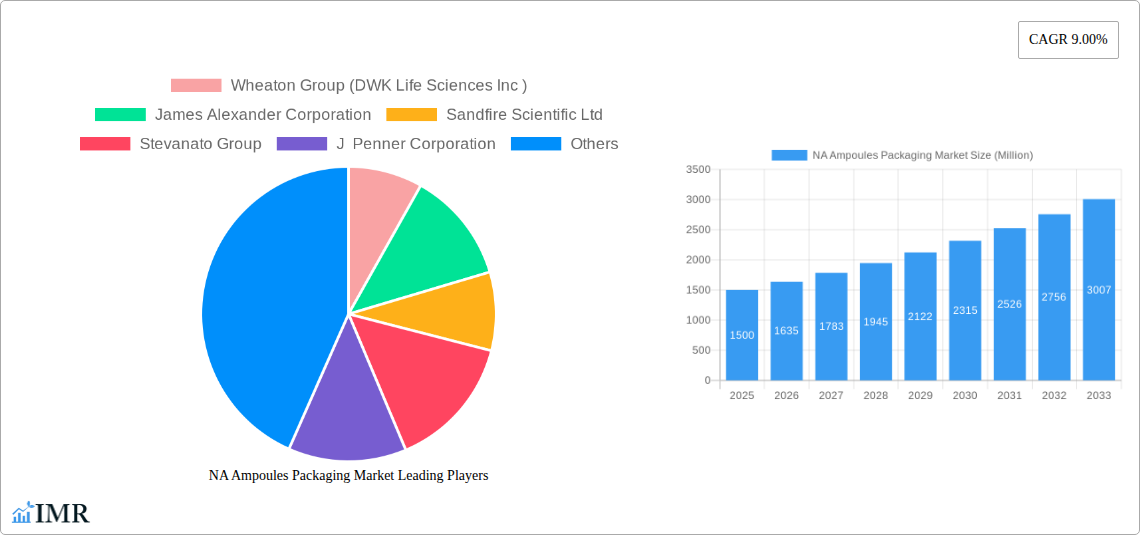
NA Ampoules Packaging Market Company Market Share
NA Ampoules Packaging Market: A Comprehensive Report (2019-2033)
This comprehensive report provides a detailed analysis of the North American (NA) ampoules packaging market, encompassing market dynamics, growth trends, regional performance, competitive landscape, and future outlook. The report covers the period from 2019 to 2033, with 2025 as the base year and a forecast period of 2025-2033. The market is segmented by material (glass, plastic) and country (United States, Canada). This report is essential for industry professionals, investors, and stakeholders seeking a deep understanding of this dynamic market. The parent market is the pharmaceutical packaging market, and the child market is specifically NA ampoules packaging. Market values are presented in million units.
NA Ampoules Packaging Market Market Dynamics & Structure
The NA ampoules packaging market is characterized by moderate concentration, with a few major players holding significant market share. The market is driven by technological advancements in materials science, leading to the development of more robust, tamper-evident, and environmentally friendly packaging solutions. Stringent regulatory frameworks concerning pharmaceutical packaging safety and traceability also influence market dynamics. Competition from alternative packaging formats (e.g., pre-filled syringes) presents a challenge. The end-user demographic is primarily pharmaceutical companies and contract manufacturers. M&A activity has been relatively low in recent years, with xx deals recorded between 2019 and 2024, representing an average of xx deals per year.
- Market Concentration: Moderately concentrated, with the top 5 players holding approximately xx% of the market share in 2024.
- Technological Innovation: Driven by the need for improved barrier properties, enhanced sterility, and reduced environmental impact.
- Regulatory Framework: Stringent regulations concerning product safety, traceability, and environmental compliance.
- Competitive Substitutes: Pre-filled syringes and other injectable drug delivery systems pose a competitive threat.
- End-User Demographics: Primarily pharmaceutical companies and contract manufacturers.
- M&A Trends: Relatively low M&A activity in recent years, with xx deals recorded between 2019 and 2024.
NA Ampoules Packaging Market Growth Trends & Insights
The NA ampoules packaging market experienced steady growth during the historical period (2019-2024), with a CAGR of xx%. This growth is attributed to factors such as the increasing demand for injectable drugs, technological advancements in packaging materials, and the growing emphasis on patient safety and convenience. Market penetration for advanced packaging technologies, such as those incorporating RFID tags for enhanced traceability, remains relatively low at xx% in 2024 but is expected to increase significantly in the forecast period. Consumer behavior shifts, including the preference for convenient and safe drug delivery systems, are further fueling market expansion. The market size is estimated to be xx million units in 2025 and is projected to reach xx million units by 2033, driven by continued growth in the pharmaceutical industry and rising adoption of advanced packaging solutions.
Dominant Regions, Countries, or Segments in NA Ampoules Packaging Market
The United States dominates the NA ampoules packaging market, accounting for xx% of the total market value in 2024. This dominance is attributed to several factors, including a large and mature pharmaceutical industry, robust healthcare infrastructure, and high adoption rates of advanced packaging technologies. The glass segment holds a significant market share (xx%), owing to its superior barrier properties and compatibility with a wide range of pharmaceutical products. Canada represents a smaller but growing market, with potential for expansion driven by increasing healthcare expenditure and government initiatives promoting pharmaceutical innovation.
- United States: Large pharmaceutical industry, robust healthcare infrastructure, high adoption of advanced technologies.
- Canada: Growing market, increasing healthcare expenditure, government initiatives promoting pharmaceutical innovation.
- Glass Segment: Superior barrier properties, compatibility with various pharmaceuticals.
NA Ampoules Packaging Market Product Landscape
The NA ampoules packaging market offers a variety of products, including standard glass ampoules, plastic ampoules, and specialized ampoules with features like pre-filled configurations or integrated safety mechanisms. Innovations are focused on enhancing barrier properties, improving sterility assurance, and incorporating traceability features. Technological advancements include the development of lighter-weight, more durable materials, and improved manufacturing processes that enhance efficiency and reduce waste. Key features increasingly sought by customers are enhanced tamper evidence, ease of handling, and improved environmental sustainability.
Key Drivers, Barriers & Challenges in NA Ampoules Packaging Market
Key Drivers: The increasing demand for injectable pharmaceuticals, stringent regulatory requirements for product safety and traceability, and the growing adoption of advanced packaging technologies are key drivers of market growth. Government initiatives aimed at strengthening the pharmaceutical supply chain and fostering innovation also contribute to market expansion.
Challenges: Supply chain disruptions, increasing raw material costs, and intense competition among packaging manufacturers pose significant challenges. Regulatory hurdles related to the approval of new packaging materials and designs can also delay product launches and increase costs.
Emerging Opportunities in NA Ampoules Packaging Market
The growing demand for personalized medicine and the increasing use of biologics are creating new opportunities for specialized ampoules packaging. Opportunities exist in developing sustainable and environmentally friendly packaging materials and incorporating advanced technologies, such as smart packaging and RFID tagging, to enhance traceability and security.
Growth Accelerators in the NA Ampoules Packaging Market Industry
Technological advancements, strategic partnerships between packaging manufacturers and pharmaceutical companies, and market expansion into niche segments (e.g., personalized medicine) are accelerating market growth. Investments in research and development of innovative packaging materials and technologies are key to long-term growth.
Key Players Shaping the NA Ampoules Packaging Market Market
- Wheaton Group (DWK Life Sciences Inc)
- James Alexander Corporation
- Sandfire Scientific Ltd
- Stevanato Group
- J Penner Corporation
- Syntegon Technology GmbH
- Amposan S
- SCHOTT AG
Notable Milestones in NA Ampoules Packaging Market Sector
- 2021-Q3: Schott AG launches a new line of sustainable glass ampoules.
- 2022-Q1: Stevanato Group acquires a company specializing in ampoule filling technology.
- 2023-Q2: New FDA guidelines on pharmaceutical packaging traceability are released.
In-Depth NA Ampoules Packaging Market Market Outlook
The NA ampoules packaging market is poised for continued growth, driven by ongoing technological advancements, increasing demand for injectable drugs, and the growing importance of patient safety and convenience. Strategic investments in research and development, strategic partnerships, and expansion into new market segments will be critical for sustained growth and success in this competitive landscape. The market presents significant opportunities for companies that can offer innovative, sustainable, and cost-effective solutions.
NA Ampoules Packaging Market Segmentation
-
1. Material
- 1.1. Glass
- 1.2. Plastic
NA Ampoules Packaging Market Segmentation By Geography
-
1. North America
- 1.1. United States
- 1.2. Canada
- 1.3. Mexico
-
2. South America
- 2.1. Brazil
- 2.2. Argentina
- 2.3. Rest of South America
-
3. Europe
- 3.1. United Kingdom
- 3.2. Germany
- 3.3. France
- 3.4. Italy
- 3.5. Spain
- 3.6. Russia
- 3.7. Benelux
- 3.8. Nordics
- 3.9. Rest of Europe
-
4. Middle East & Africa
- 4.1. Turkey
- 4.2. Israel
- 4.3. GCC
- 4.4. North Africa
- 4.5. South Africa
- 4.6. Rest of Middle East & Africa
-
5. Asia Pacific
- 5.1. China
- 5.2. India
- 5.3. Japan
- 5.4. South Korea
- 5.5. ASEAN
- 5.6. Oceania
- 5.7. Rest of Asia Pacific
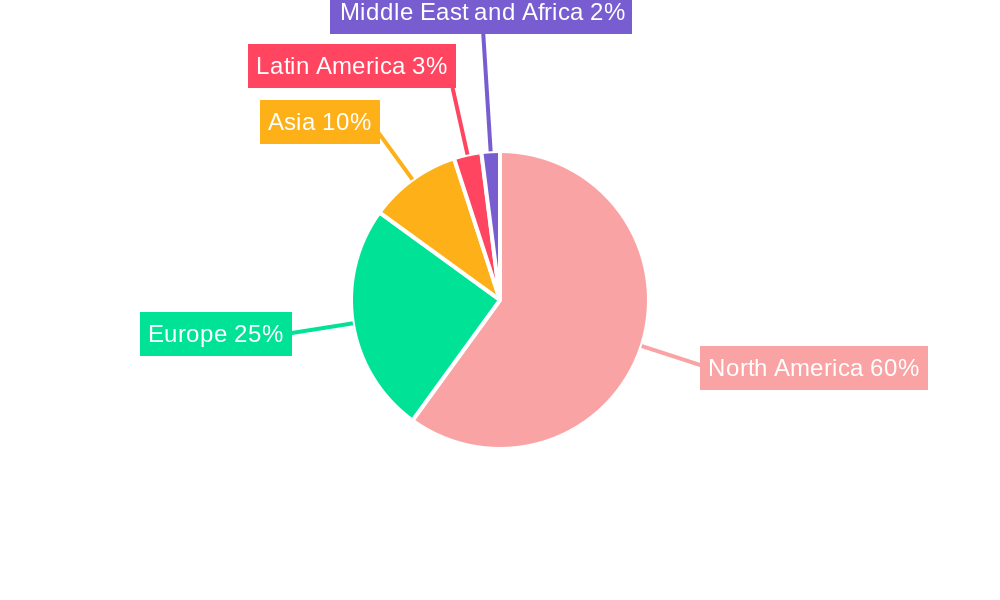
NA Ampoules Packaging Market Regional Market Share
Geographic Coverage of NA Ampoules Packaging Market
NA Ampoules Packaging Market REPORT HIGHLIGHTS
| Aspects | Details |
|---|---|
| Study Period | 2020-2034 |
| Base Year | 2025 |
| Estimated Year | 2026 |
| Forecast Period | 2026-2034 |
| Historical Period | 2020-2025 |
| Growth Rate | CAGR of 9.00% from 2020-2034 |
| Segmentation |
|
Table of Contents
- 1. Introduction
- 1.1. Research Scope
- 1.2. Market Segmentation
- 1.3. Research Objective
- 1.4. Definitions and Assumptions
- 2. Executive Summary
- 2.1. Market Snapshot
- 3. Market Dynamics
- 3.1. Market Drivers
- 3.2. Market Restrains
- 3.3. Market Trends
- 3.4. Market Opportunities
- 4. Market Factor Analysis
- 4.1. Porters Five Forces
- 4.1.1. Bargaining Power of Suppliers
- 4.1.2. Bargaining Power of Buyers
- 4.1.3. Threat of New Entrants
- 4.1.4. Threat of Substitutes
- 4.1.5. Competitive Rivalry
- 4.2. PESTEL analysis
- 4.3. BCG Analysis
- 4.3.1. Stars (High Growth, High Market Share)
- 4.3.2. Cash Cows (Low Growth, High Market Share)
- 4.3.3. Question Mark (High Growth, Low Market Share)
- 4.3.4. Dogs (Low Growth, Low Market Share)
- 4.4. Ansoff Matrix Analysis
- 4.5. Supply Chain Analysis
- 4.6. Regulatory Landscape
- 4.7. Current Market Potential and Opportunity Assessment (TAM–SAM–SOM Framework)
- 4.8. IMR Analyst Note
- 4.1. Porters Five Forces
- 5. Market Analysis, Insights and Forecast 2021-2033
- 5.1. Market Analysis, Insights and Forecast - by Material
- 5.1.1. Glass
- 5.1.2. Plastic
- 5.2. Market Analysis, Insights and Forecast - by Region
- 5.2.1. North America
- 5.2.2. South America
- 5.2.3. Europe
- 5.2.4. Middle East & Africa
- 5.2.5. Asia Pacific
- 5.1. Market Analysis, Insights and Forecast - by Material
- 6. Global NA Ampoules Packaging Market Analysis, Insights and Forecast, 2021-2033
- 6.1. Market Analysis, Insights and Forecast - by Material
- 6.1.1. Glass
- 6.1.2. Plastic
- 6.1. Market Analysis, Insights and Forecast - by Material
- 7. North America NA Ampoules Packaging Market Analysis, Insights and Forecast, 2020-2032
- 7.1. Market Analysis, Insights and Forecast - by Material
- 7.1.1. Glass
- 7.1.2. Plastic
- 7.1. Market Analysis, Insights and Forecast - by Material
- 8. South America NA Ampoules Packaging Market Analysis, Insights and Forecast, 2020-2032
- 8.1. Market Analysis, Insights and Forecast - by Material
- 8.1.1. Glass
- 8.1.2. Plastic
- 8.1. Market Analysis, Insights and Forecast - by Material
- 9. Europe NA Ampoules Packaging Market Analysis, Insights and Forecast, 2020-2032
- 9.1. Market Analysis, Insights and Forecast - by Material
- 9.1.1. Glass
- 9.1.2. Plastic
- 9.1. Market Analysis, Insights and Forecast - by Material
- 10. Middle East & Africa NA Ampoules Packaging Market Analysis, Insights and Forecast, 2020-2032
- 10.1. Market Analysis, Insights and Forecast - by Material
- 10.1.1. Glass
- 10.1.2. Plastic
- 10.1. Market Analysis, Insights and Forecast - by Material
- 11. Asia Pacific NA Ampoules Packaging Market Analysis, Insights and Forecast, 2020-2032
- 11.1. Market Analysis, Insights and Forecast - by Material
- 11.1.1. Glass
- 11.1.2. Plastic
- 11.1. Market Analysis, Insights and Forecast - by Material
- 12. Competitive Analysis
- 12.1. Company Profiles
- 12.1.1 Wheaton Group (DWK Life Sciences Inc )
- 12.1.1.1. Company Overview
- 12.1.1.2. Products
- 12.1.1.3. Company Financials
- 12.1.1.4. SWOT Analysis
- 12.1.2 James Alexander Corporation
- 12.1.2.1. Company Overview
- 12.1.2.2. Products
- 12.1.2.3. Company Financials
- 12.1.2.4. SWOT Analysis
- 12.1.3 Sandfire Scientific Ltd
- 12.1.3.1. Company Overview
- 12.1.3.2. Products
- 12.1.3.3. Company Financials
- 12.1.3.4. SWOT Analysis
- 12.1.4 Stevanato Group
- 12.1.4.1. Company Overview
- 12.1.4.2. Products
- 12.1.4.3. Company Financials
- 12.1.4.4. SWOT Analysis
- 12.1.5 J Penner Corporation
- 12.1.5.1. Company Overview
- 12.1.5.2. Products
- 12.1.5.3. Company Financials
- 12.1.5.4. SWOT Analysis
- 12.1.6 Syntegon Technology GmbH
- 12.1.6.1. Company Overview
- 12.1.6.2. Products
- 12.1.6.3. Company Financials
- 12.1.6.4. SWOT Analysis
- 12.1.7 Amposan S
- 12.1.7.1. Company Overview
- 12.1.7.2. Products
- 12.1.7.3. Company Financials
- 12.1.7.4. SWOT Analysis
- 12.1.8 SCHOTT AG
- 12.1.8.1. Company Overview
- 12.1.8.2. Products
- 12.1.8.3. Company Financials
- 12.1.8.4. SWOT Analysis
- 12.1.1 Wheaton Group (DWK Life Sciences Inc )
- 12.2. Market Entropy
- 12.2.1 Company's Key Areas Served
- 12.2.2 Recent Developments
- 12.3. Company Market Share Analysis 2025
- 12.3.1 Top 5 Companies Market Share Analysis
- 12.3.2 Top 3 Companies Market Share Analysis
- 12.4. List of Potential Customers
- 13. Research Methodology
List of Figures
- Figure 1: Global NA Ampoules Packaging Market Revenue Breakdown (Million, %) by Region 2025 & 2033
- Figure 2: North America NA Ampoules Packaging Market Revenue (Million), by Material 2025 & 2033
- Figure 3: North America NA Ampoules Packaging Market Revenue Share (%), by Material 2025 & 2033
- Figure 4: North America NA Ampoules Packaging Market Revenue (Million), by Country 2025 & 2033
- Figure 5: North America NA Ampoules Packaging Market Revenue Share (%), by Country 2025 & 2033
- Figure 6: South America NA Ampoules Packaging Market Revenue (Million), by Material 2025 & 2033
- Figure 7: South America NA Ampoules Packaging Market Revenue Share (%), by Material 2025 & 2033
- Figure 8: South America NA Ampoules Packaging Market Revenue (Million), by Country 2025 & 2033
- Figure 9: South America NA Ampoules Packaging Market Revenue Share (%), by Country 2025 & 2033
- Figure 10: Europe NA Ampoules Packaging Market Revenue (Million), by Material 2025 & 2033
- Figure 11: Europe NA Ampoules Packaging Market Revenue Share (%), by Material 2025 & 2033
- Figure 12: Europe NA Ampoules Packaging Market Revenue (Million), by Country 2025 & 2033
- Figure 13: Europe NA Ampoules Packaging Market Revenue Share (%), by Country 2025 & 2033
- Figure 14: Middle East & Africa NA Ampoules Packaging Market Revenue (Million), by Material 2025 & 2033
- Figure 15: Middle East & Africa NA Ampoules Packaging Market Revenue Share (%), by Material 2025 & 2033
- Figure 16: Middle East & Africa NA Ampoules Packaging Market Revenue (Million), by Country 2025 & 2033
- Figure 17: Middle East & Africa NA Ampoules Packaging Market Revenue Share (%), by Country 2025 & 2033
- Figure 18: Asia Pacific NA Ampoules Packaging Market Revenue (Million), by Material 2025 & 2033
- Figure 19: Asia Pacific NA Ampoules Packaging Market Revenue Share (%), by Material 2025 & 2033
- Figure 20: Asia Pacific NA Ampoules Packaging Market Revenue (Million), by Country 2025 & 2033
- Figure 21: Asia Pacific NA Ampoules Packaging Market Revenue Share (%), by Country 2025 & 2033
List of Tables
- Table 1: Global NA Ampoules Packaging Market Revenue Million Forecast, by Material 2020 & 2033
- Table 2: Global NA Ampoules Packaging Market Revenue Million Forecast, by Region 2020 & 2033
- Table 3: Global NA Ampoules Packaging Market Revenue Million Forecast, by Material 2020 & 2033
- Table 4: Global NA Ampoules Packaging Market Revenue Million Forecast, by Country 2020 & 2033
- Table 5: United States NA Ampoules Packaging Market Revenue (Million) Forecast, by Application 2020 & 2033
- Table 6: Canada NA Ampoules Packaging Market Revenue (Million) Forecast, by Application 2020 & 2033
- Table 7: Mexico NA Ampoules Packaging Market Revenue (Million) Forecast, by Application 2020 & 2033
- Table 8: Global NA Ampoules Packaging Market Revenue Million Forecast, by Material 2020 & 2033
- Table 9: Global NA Ampoules Packaging Market Revenue Million Forecast, by Country 2020 & 2033
- Table 10: Brazil NA Ampoules Packaging Market Revenue (Million) Forecast, by Application 2020 & 2033
- Table 11: Argentina NA Ampoules Packaging Market Revenue (Million) Forecast, by Application 2020 & 2033
- Table 12: Rest of South America NA Ampoules Packaging Market Revenue (Million) Forecast, by Application 2020 & 2033
- Table 13: Global NA Ampoules Packaging Market Revenue Million Forecast, by Material 2020 & 2033
- Table 14: Global NA Ampoules Packaging Market Revenue Million Forecast, by Country 2020 & 2033
- Table 15: United Kingdom NA Ampoules Packaging Market Revenue (Million) Forecast, by Application 2020 & 2033
- Table 16: Germany NA Ampoules Packaging Market Revenue (Million) Forecast, by Application 2020 & 2033
- Table 17: France NA Ampoules Packaging Market Revenue (Million) Forecast, by Application 2020 & 2033
- Table 18: Italy NA Ampoules Packaging Market Revenue (Million) Forecast, by Application 2020 & 2033
- Table 19: Spain NA Ampoules Packaging Market Revenue (Million) Forecast, by Application 2020 & 2033
- Table 20: Russia NA Ampoules Packaging Market Revenue (Million) Forecast, by Application 2020 & 2033
- Table 21: Benelux NA Ampoules Packaging Market Revenue (Million) Forecast, by Application 2020 & 2033
- Table 22: Nordics NA Ampoules Packaging Market Revenue (Million) Forecast, by Application 2020 & 2033
- Table 23: Rest of Europe NA Ampoules Packaging Market Revenue (Million) Forecast, by Application 2020 & 2033
- Table 24: Global NA Ampoules Packaging Market Revenue Million Forecast, by Material 2020 & 2033
- Table 25: Global NA Ampoules Packaging Market Revenue Million Forecast, by Country 2020 & 2033
- Table 26: Turkey NA Ampoules Packaging Market Revenue (Million) Forecast, by Application 2020 & 2033
- Table 27: Israel NA Ampoules Packaging Market Revenue (Million) Forecast, by Application 2020 & 2033
- Table 28: GCC NA Ampoules Packaging Market Revenue (Million) Forecast, by Application 2020 & 2033
- Table 29: North Africa NA Ampoules Packaging Market Revenue (Million) Forecast, by Application 2020 & 2033
- Table 30: South Africa NA Ampoules Packaging Market Revenue (Million) Forecast, by Application 2020 & 2033
- Table 31: Rest of Middle East & Africa NA Ampoules Packaging Market Revenue (Million) Forecast, by Application 2020 & 2033
- Table 32: Global NA Ampoules Packaging Market Revenue Million Forecast, by Material 2020 & 2033
- Table 33: Global NA Ampoules Packaging Market Revenue Million Forecast, by Country 2020 & 2033
- Table 34: China NA Ampoules Packaging Market Revenue (Million) Forecast, by Application 2020 & 2033
- Table 35: India NA Ampoules Packaging Market Revenue (Million) Forecast, by Application 2020 & 2033
- Table 36: Japan NA Ampoules Packaging Market Revenue (Million) Forecast, by Application 2020 & 2033
- Table 37: South Korea NA Ampoules Packaging Market Revenue (Million) Forecast, by Application 2020 & 2033
- Table 38: ASEAN NA Ampoules Packaging Market Revenue (Million) Forecast, by Application 2020 & 2033
- Table 39: Oceania NA Ampoules Packaging Market Revenue (Million) Forecast, by Application 2020 & 2033
- Table 40: Rest of Asia Pacific NA Ampoules Packaging Market Revenue (Million) Forecast, by Application 2020 & 2033
Frequently Asked Questions
1. What is the projected Compound Annual Growth Rate (CAGR) of the NA Ampoules Packaging Market?
The projected CAGR is approximately 9.00%.
2. Which companies are prominent players in the NA Ampoules Packaging Market?
Key companies in the market include Wheaton Group (DWK Life Sciences Inc ), James Alexander Corporation, Sandfire Scientific Ltd, Stevanato Group, J Penner Corporation, Syntegon Technology GmbH, Amposan S, SCHOTT AG.
3. What are the main segments of the NA Ampoules Packaging Market?
The market segments include Material.
4. Can you provide details about the market size?
The market size is estimated to be USD XX Million as of 2022.
5. What are some drivers contributing to market growth?
; Increasing Demand for Sterile and Tamper-Proof Packaging Solutions for the Pharmaceutical Industry; Stringent Government Regulations and Standards.
6. What are the notable trends driving market growth?
Pharmaceutical Industry Expected to Exhibit the Maximum Number of Adoption.
7. Are there any restraints impacting market growth?
; Concerns Regarding Dumping of Used Ampoules.
8. Can you provide examples of recent developments in the market?
N/A
9. What pricing options are available for accessing the report?
Pricing options include single-user, multi-user, and enterprise licenses priced at USD 4750, USD 4950, and USD 6800 respectively.
10. Is the market size provided in terms of value or volume?
The market size is provided in terms of value, measured in Million.
11. Are there any specific market keywords associated with the report?
Yes, the market keyword associated with the report is "NA Ampoules Packaging Market," which aids in identifying and referencing the specific market segment covered.
12. How do I determine which pricing option suits my needs best?
The pricing options vary based on user requirements and access needs. Individual users may opt for single-user licenses, while businesses requiring broader access may choose multi-user or enterprise licenses for cost-effective access to the report.
13. Are there any additional resources or data provided in the NA Ampoules Packaging Market report?
While the report offers comprehensive insights, it's advisable to review the specific contents or supplementary materials provided to ascertain if additional resources or data are available.
14. How can I stay updated on further developments or reports in the NA Ampoules Packaging Market?
To stay informed about further developments, trends, and reports in the NA Ampoules Packaging Market, consider subscribing to industry newsletters, following relevant companies and organizations, or regularly checking reputable industry news sources and publications.
Methodology
Step 1 - Identification of Relevant Samples Size from Population Database


Step 2 - Approaches for Defining Global Market Size (Value, Volume* & Price*)

Note*: In applicable scenarios
Step 3 - Data Sources
Primary Research
- Web Analytics
- Survey Reports
- Research Institute
- Latest Research Reports
- Opinion Leaders
Secondary Research
- Annual Reports
- White Paper
- Latest Press Release
- Industry Association
- Paid Database
- Investor Presentations

Step 4 - Data Triangulation
Involves using different sources of information in order to increase the validity of a study
These sources are likely to be stakeholders in a program - participants, other researchers, program staff, other community members, and so on.
Then we put all data in single framework & apply various statistical tools to find out the dynamic on the market.
During the analysis stage, feedback from the stakeholder groups would be compared to determine areas of agreement as well as areas of divergence