

Key Insights
The Non-Auxiliary NFC Products market is poised for substantial growth, with an estimated market size of approximately $5,500 million in 2025, projecting a Compound Annual Growth Rate (CAGR) of around 12.5% throughout the forecast period extending to 2033. This expansion is primarily driven by the ubiquitous integration of Near Field Communication (NFC) technology across a diverse range of applications. Key sectors fueling this growth include Retail, where contactless payments and loyalty programs are becoming standard, and the Transportation industry, which is adopting NFC for ticketing and access control systems. The Automotive sector is also a significant contributor, leveraging NFC for keyless entry, in-car payments, and enhanced user experiences. Furthermore, the increasing adoption of smart devices in Residential & Commercial spaces for building access and automation, coupled with the growing demand for secure and efficient solutions in Medical & Healthcare and Banking & Finance, underpins the robust market trajectory. The consumer electronics segment, with its widespread use of NFC in smartphones and wearables for contactless transactions and data sharing, continues to be a cornerstone of market expansion.
The market's growth is further bolstered by several emerging trends, including the rise of NFC-enabled Internet of Things (IoT) devices, which allow for seamless interaction and data exchange between physical objects and digital platforms. Advancements in NFC technology, such as improved read ranges and enhanced security features, are also driving adoption. The market segmentation by type reveals a strong performance in both NFC ICs & Antennas and NFC Tags, reflecting the foundational components necessary for NFC ecosystem development. However, the market faces certain restraints, including the initial cost of implementing NFC infrastructure in some applications and ongoing concerns regarding data security and privacy, although these are being addressed through stringent regulations and technological advancements. Geographically, the Asia Pacific region, led by China and India, is expected to dominate the market due to rapid technological adoption, a large consumer base, and government initiatives promoting digital payments and smart city development. North America and Europe also represent significant markets, driven by innovation and established NFC ecosystems.
Non Auxiliary NFC Products Market Analysis Report: Decoding the Future of Connected Transactions
This comprehensive report offers an in-depth analysis of the global Non Auxiliary NFC Products market, charting its trajectory from 2019 to 2033. Focusing on critical market dynamics, growth trends, regional dominance, product innovation, and key industry players, this study provides actionable insights for stakeholders navigating the rapidly evolving landscape of Near Field Communication technologies. We delve into the intricate interplay of market concentration, technological advancements, and regulatory frameworks that shape the adoption of NFC across diverse applications and industries.
Non Auxiliary Nfc Products Market Dynamics & Structure
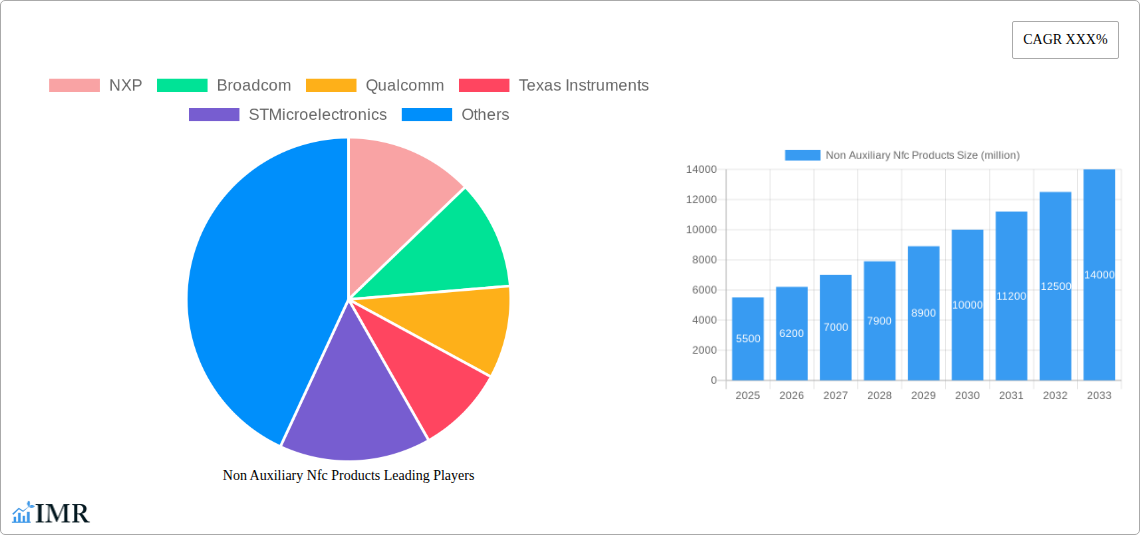
The Non Auxiliary NFC Products market exhibits a moderately concentrated structure, with key players like NXP, Broadcom, Qualcomm, Texas Instruments, STMicroelectronics, Thales Group, Infineon, ams, and HID holding significant influence. Technological innovation is a primary driver, fueled by advancements in miniaturization, power efficiency, and enhanced security protocols for NFC chips and antennas. The proliferation of smart devices and the increasing demand for contactless payment and secure access solutions are accelerating market adoption. Regulatory frameworks, particularly around data privacy and security standards, play a crucial role in shaping product development and market entry. Competitive product substitutes, such as Bluetooth Low Energy (BLE) and QR codes, present a challenge, but NFC’s unique combination of security, simplicity, and low power consumption in close proximity continues to solidify its position. End-user demographics are increasingly tech-savvy, with a growing preference for seamless and secure transaction experiences across retail, transportation, and consumer electronics. Mergers and acquisitions (M&A) are also a notable trend, as companies seek to consolidate market share, acquire key technologies, and expand their product portfolios. The global market share of NFC ICS & Antennas is estimated at 55% of the total Non Auxiliary NFC Products market, while NFC Tags hold 30% and NFC Readers 15% in the base year 2025.
- Market Concentration: Key players include NXP, Broadcom, Qualcomm, Texas Instruments, STMicroelectronics, Thales Group, Infineon, ams, HID.
- Technological Innovation Drivers: Miniaturization, power efficiency, enhanced security, interoperability standards.
- Regulatory Frameworks: Data privacy (e.g., GDPR), security certifications (e.g., EMVCo).
- Competitive Product Substitutes: Bluetooth Low Energy (BLE), QR Codes, RFID.
- End-User Demographics: Growing demand from tech-savvy consumers and businesses for secure, convenient transactions.
- M&A Trends: Strategic acquisitions to gain market share and technological capabilities.
- Segment Market Share (2025): NFC ICS & Antennas (55 million units), NFC Tags (30 million units), NFC Readers (15 million units).
Non Auxiliary Nfc Products Growth Trends & Insights
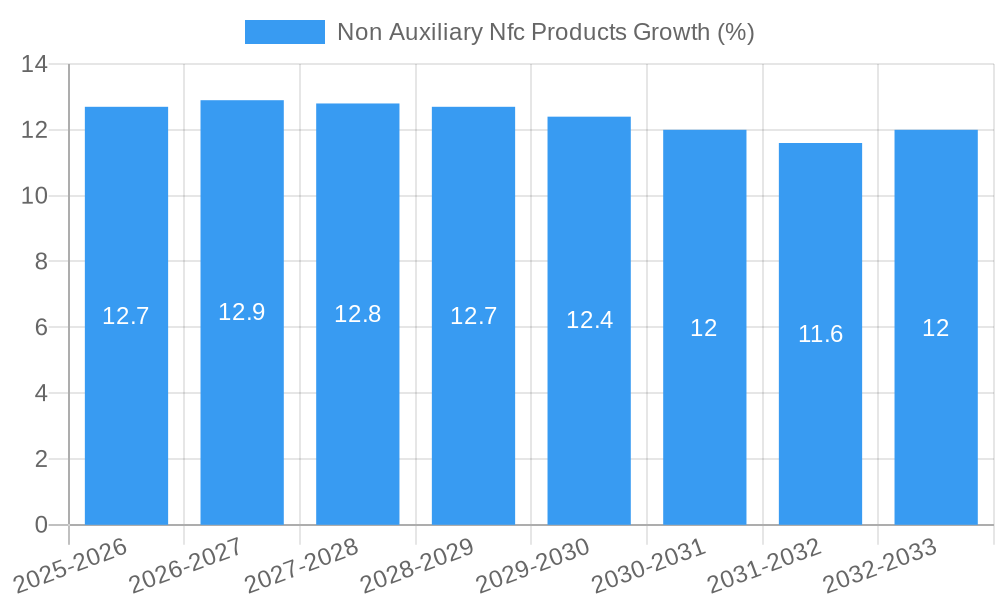
The global Non Auxiliary NFC Products market is poised for robust growth, driven by a confluence of accelerating adoption rates, continuous technological disruptions, and evolving consumer behaviors. The market size is projected to expand significantly, with a Compound Annual Growth Rate (CAGR) of approximately 15% during the forecast period of 2025–2033. This growth is underpinned by the increasing penetration of NFC-enabled devices across various sectors. In the Retail segment, contactless payments are becoming the norm, with an estimated 80% of all point-of-sale transactions expected to be contactless by 2030, driving demand for NFC tags and readers. The Transportation sector is witnessing widespread implementation of NFC for ticketing and access control, with transit authorities globally upgrading their infrastructure. The Automotive industry is integrating NFC for secure keyless entry, digital car keys, and in-car payment systems, a trend projected to see a CAGR of 18% within this segment. The Residential & Commercial sectors are also embracing NFC for smart home access and building management. In Medical & Healthcare, NFC is finding applications in patient identification, secure medical device access, and contactless data transfer. The Consumer Electronics market continues to be a strong driver, with smartphones and wearables routinely featuring NFC capabilities for payments, pairing, and data exchange. Banking & Finance remains a cornerstone, with NFC facilitating secure and swift payment solutions. The "Others" segment, encompassing industrial applications and event management, also presents substantial growth opportunities. Technological disruptions, such as the development of ultra-low-power NFC chips and advanced encryption techniques, are further fueling adoption. Consumer behavior is increasingly favoring convenience and security, making NFC-based solutions highly attractive. The overall market penetration of NFC technology in consumer devices is expected to surpass 70% by 2028. The total market volume is projected to reach 150 million units by 2033, up from approximately 50 million units in 2019.
Dominant Regions, Countries, or Segments in Non Auxiliary Nfc Products
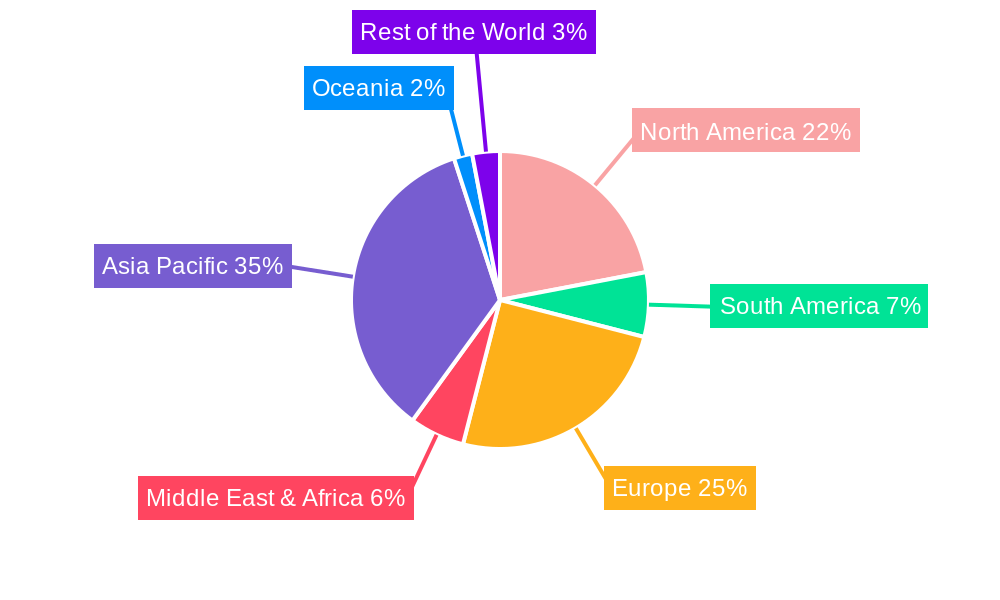
The Asia Pacific region is emerging as the dominant force in the Non Auxiliary NFC Products market, driven by its vast consumer base, rapid digital transformation, and supportive government initiatives. Countries like China, South Korea, and India are at the forefront, significantly contributing to the market’s expansion across various application segments.
In the Retail sector, the widespread adoption of mobile payment solutions, accelerated by the pandemic, has made Asia Pacific the leader in NFC-enabled transactions. China, with its mature mobile payment ecosystem, accounts for a substantial portion of global NFC retail transactions.
The Transportation segment in this region is experiencing massive investment in smart transit systems. Cities are rapidly deploying NFC-based ticketing and access control, improving commuter convenience and operational efficiency. South Korea's advanced public transportation networks are a prime example of this dominance.
The Consumer Electronics segment is another key driver for Asia Pacific’s leadership. The region is a global hub for electronics manufacturing, and NFC integration into smartphones, wearables, and other consumer devices is exceptionally high.
- Dominant Region: Asia Pacific
- Key Countries: China, South Korea, India, Japan
- Key Application Segments Driving Dominance: Retail, Transportation, Consumer Electronics, Banking & Finance.
- Drivers of Dominance in Asia Pacific:
- Large and tech-savvy population driving high adoption rates.
- Significant government investment in smart city initiatives and digital infrastructure.
- Rapid growth of the e-commerce and mobile payment ecosystems.
- Strong presence of global consumer electronics manufacturers.
- Increasing demand for contactless solutions in public spaces and for access control.
The market share for NFC ICS & Antennas in Asia Pacific is estimated at 60 million units in 2025, while NFC Tags are projected at 35 million units, and NFC Readers at 20 million units. The region is expected to maintain its leading position throughout the forecast period due to continuous innovation and strategic market expansion by key players.
Non Auxiliary Nfc Products Product Landscape
The Non Auxiliary NFC Products landscape is characterized by continuous innovation in NFC ICS & Antennas, focusing on enhanced security, reduced power consumption, and miniaturization for seamless integration into a wide array of devices. Leading companies are developing next-generation NFC controllers with advanced encryption capabilities and improved anti-tampering features. NFC Tags are evolving with greater memory capacity, enhanced durability, and specialized functionalities, such as those embedded in smart labels for supply chain management and authentication. NFC Readers are becoming more versatile, supporting multiple NFC standards and offering faster read/write speeds for improved user experience in payment terminals, access control systems, and ticketing solutions. Unique selling propositions include ultra-secure transaction capabilities, low-latency communication, and user-friendly contactless interactions.
Key Drivers, Barriers & Challenges in Non Auxiliary Nfc Products
Key Drivers: The Non Auxiliary NFC Products market is propelled by the ever-increasing demand for secure, contactless transactions, especially in retail and banking. The proliferation of smartphones and wearables with embedded NFC capabilities serves as a significant catalyst. Government initiatives promoting digital payments and smart city infrastructure further accelerate adoption. Technological advancements in miniaturization and power efficiency are enabling broader integration into diverse devices. The growing need for enhanced security in access control and identity verification also drives the market.
Barriers & Challenges: Despite strong growth, the market faces challenges such as the need for widespread consumer education and acceptance of contactless technologies in certain demographics. High initial implementation costs for infrastructure upgrades can be a barrier for smaller businesses. Regulatory fragmentation across different regions regarding data security and privacy can create complexities. Intense competition from alternative wireless technologies like Bluetooth and QR codes also poses a restraint. Supply chain disruptions and the availability of skilled labor for integration can impact market expansion.
Emerging Opportunities in Non Auxiliary NFC Products
Emerging opportunities lie in the expanding use of NFC in the Internet of Things (IoT) for device pairing, authentication, and secure data transfer between smart home devices and industrial sensors. The healthcare sector presents a significant untapped market for NFC in patient monitoring, medication adherence tracking, and secure access to medical records. The growth of the metaverse and gaming industries offers new avenues for NFC integration in digital asset ownership and in-world transactions. Furthermore, the development of NFC-based digital identity solutions for secure authentication and verification beyond payments is a promising area. The increasing focus on sustainability also opens doors for NFC in smart packaging and product lifecycle management.
Growth Accelerators in the Non Auxiliary NFC Products Industry
Several catalysts are driving long-term growth in the Non Auxiliary NFC Products industry. Technological breakthroughs in areas like Ultra-Wideband (UWB) co-existence with NFC, enabling richer spatial awareness and enhanced security, are expanding the possibilities. Strategic partnerships between chip manufacturers, device makers, and service providers are crucial for creating seamless end-to-end solutions and fostering broader ecosystem development. Market expansion strategies targeting emerging economies and underserved sectors will unlock new revenue streams. The continued evolution of NFC standards to support more complex transactions and data exchange will also fuel sustained growth.
Key Players Shaping the Non Auxiliary NFC Products Market
- NXP
- Broadcom
- Qualcomm
- Texas Instruments
- STMicroelectronics
- Thales Group
- Infineon
- ams
- HID
Notable Milestones in Non Auxiliary NFC Products Sector
- 2019: Launch of advanced NFC controllers with enhanced security features by NXP, enabling more secure payment applications.
- 2020: Increased adoption of NFC for contactless payments driven by global health concerns, with major banks expanding NFC-enabled card issuance.
- 2021: Qualcomm announces integration of enhanced NFC capabilities into its latest Snapdragon mobile chipsets, boosting performance and features.
- 2022: Thales Group acquires Gemalto, strengthening its position in secure identity and payment solutions, including NFC technologies.
- 2023: STMicroelectronics introduces new NFC tags with increased memory and energy harvesting capabilities for IoT applications.
- 2024: ams OSRAM launches innovative NFC antennas with superior performance in challenging form factors, paving the way for wider device integration.
In-Depth Non Auxiliary NFC Products Market Outlook
The Non Auxiliary NFC Products market is set for continued expansion, driven by the relentless pursuit of secure, convenient, and seamless digital interactions. The integration of NFC into an ever-wider array of devices, from wearables to industrial IoT, will be a primary growth accelerator. Strategic collaborations and ongoing technological advancements will further solidify NFC's position as a foundational technology for the connected future. The increasing focus on privacy-preserving solutions and the development of novel applications beyond payments will unlock significant future market potential. Stakeholders who adapt to evolving consumer preferences and embrace emerging opportunities will be best positioned for success.
Non Auxiliary Nfc Products Segmentation
-
1. Application
- 1.1. Retail
- 1.2. Transportation
- 1.3. Automotive
- 1.4. Residential & Commercial
- 1.5. Medical & Healthcare
- 1.6. Consumer Electronics
- 1.7. Banking & Finance
- 1.8. Others
-
2. Type
- 2.1. NFC ICS & Antennas
- 2.2. NFC Tags
- 2.3. NFC Readers
Non Auxiliary Nfc Products Segmentation By Geography
-
1. North America
- 1.1. United States
- 1.2. Canada
- 1.3. Mexico
-
2. South America
- 2.1. Brazil
- 2.2. Argentina
- 2.3. Rest of South America
-
3. Europe
- 3.1. United Kingdom
- 3.2. Germany
- 3.3. France
- 3.4. Italy
- 3.5. Spain
- 3.6. Russia
- 3.7. Benelux
- 3.8. Nordics
- 3.9. Rest of Europe
-
4. Middle East & Africa
- 4.1. Turkey
- 4.2. Israel
- 4.3. GCC
- 4.4. North Africa
- 4.5. South Africa
- 4.6. Rest of Middle East & Africa
-
5. Asia Pacific
- 5.1. China
- 5.2. India
- 5.3. Japan
- 5.4. South Korea
- 5.5. ASEAN
- 5.6. Oceania
- 5.7. Rest of Asia Pacific
Non Auxiliary Nfc Products REPORT HIGHLIGHTS
| Aspects | Details |
|---|---|
| Study Period | 2019-2033 |
| Base Year | 2024 |
| Estimated Year | 2025 |
| Forecast Period | 2025-2033 |
| Historical Period | 2019-2024 |
| Growth Rate | CAGR of XXX% from 2019-2033 |
| Segmentation |
|
Table of Contents
- 1. Introduction
- 1.1. Research Scope
- 1.2. Market Segmentation
- 1.3. Research Methodology
- 1.4. Definitions and Assumptions
- 2. Executive Summary
- 2.1. Introduction
- 3. Market Dynamics
- 3.1. Introduction
- 3.2. Market Drivers
- 3.3. Market Restrains
- 3.4. Market Trends
- 4. Market Factor Analysis
- 4.1. Porters Five Forces
- 4.2. Supply/Value Chain
- 4.3. PESTEL analysis
- 4.4. Market Entropy
- 4.5. Patent/Trademark Analysis
- 5. Global Non Auxiliary Nfc Products Analysis, Insights and Forecast, 2019-2031
- 5.1. Market Analysis, Insights and Forecast - by Application
- 5.1.1. Retail
- 5.1.2. Transportation
- 5.1.3. Automotive
- 5.1.4. Residential & Commercial
- 5.1.5. Medical & Healthcare
- 5.1.6. Consumer Electronics
- 5.1.7. Banking & Finance
- 5.1.8. Others
- 5.2. Market Analysis, Insights and Forecast - by Type
- 5.2.1. NFC ICS & Antennas
- 5.2.2. NFC Tags
- 5.2.3. NFC Readers
- 5.3. Market Analysis, Insights and Forecast - by Region
- 5.3.1. North America
- 5.3.2. South America
- 5.3.3. Europe
- 5.3.4. Middle East & Africa
- 5.3.5. Asia Pacific
- 5.1. Market Analysis, Insights and Forecast - by Application
- 6. North America Non Auxiliary Nfc Products Analysis, Insights and Forecast, 2019-2031
- 6.1. Market Analysis, Insights and Forecast - by Application
- 6.1.1. Retail
- 6.1.2. Transportation
- 6.1.3. Automotive
- 6.1.4. Residential & Commercial
- 6.1.5. Medical & Healthcare
- 6.1.6. Consumer Electronics
- 6.1.7. Banking & Finance
- 6.1.8. Others
- 6.2. Market Analysis, Insights and Forecast - by Type
- 6.2.1. NFC ICS & Antennas
- 6.2.2. NFC Tags
- 6.2.3. NFC Readers
- 6.1. Market Analysis, Insights and Forecast - by Application
- 7. South America Non Auxiliary Nfc Products Analysis, Insights and Forecast, 2019-2031
- 7.1. Market Analysis, Insights and Forecast - by Application
- 7.1.1. Retail
- 7.1.2. Transportation
- 7.1.3. Automotive
- 7.1.4. Residential & Commercial
- 7.1.5. Medical & Healthcare
- 7.1.6. Consumer Electronics
- 7.1.7. Banking & Finance
- 7.1.8. Others
- 7.2. Market Analysis, Insights and Forecast - by Type
- 7.2.1. NFC ICS & Antennas
- 7.2.2. NFC Tags
- 7.2.3. NFC Readers
- 7.1. Market Analysis, Insights and Forecast - by Application
- 8. Europe Non Auxiliary Nfc Products Analysis, Insights and Forecast, 2019-2031
- 8.1. Market Analysis, Insights and Forecast - by Application
- 8.1.1. Retail
- 8.1.2. Transportation
- 8.1.3. Automotive
- 8.1.4. Residential & Commercial
- 8.1.5. Medical & Healthcare
- 8.1.6. Consumer Electronics
- 8.1.7. Banking & Finance
- 8.1.8. Others
- 8.2. Market Analysis, Insights and Forecast - by Type
- 8.2.1. NFC ICS & Antennas
- 8.2.2. NFC Tags
- 8.2.3. NFC Readers
- 8.1. Market Analysis, Insights and Forecast - by Application
- 9. Middle East & Africa Non Auxiliary Nfc Products Analysis, Insights and Forecast, 2019-2031
- 9.1. Market Analysis, Insights and Forecast - by Application
- 9.1.1. Retail
- 9.1.2. Transportation
- 9.1.3. Automotive
- 9.1.4. Residential & Commercial
- 9.1.5. Medical & Healthcare
- 9.1.6. Consumer Electronics
- 9.1.7. Banking & Finance
- 9.1.8. Others
- 9.2. Market Analysis, Insights and Forecast - by Type
- 9.2.1. NFC ICS & Antennas
- 9.2.2. NFC Tags
- 9.2.3. NFC Readers
- 9.1. Market Analysis, Insights and Forecast - by Application
- 10. Asia Pacific Non Auxiliary Nfc Products Analysis, Insights and Forecast, 2019-2031
- 10.1. Market Analysis, Insights and Forecast - by Application
- 10.1.1. Retail
- 10.1.2. Transportation
- 10.1.3. Automotive
- 10.1.4. Residential & Commercial
- 10.1.5. Medical & Healthcare
- 10.1.6. Consumer Electronics
- 10.1.7. Banking & Finance
- 10.1.8. Others
- 10.2. Market Analysis, Insights and Forecast - by Type
- 10.2.1. NFC ICS & Antennas
- 10.2.2. NFC Tags
- 10.2.3. NFC Readers
- 10.1. Market Analysis, Insights and Forecast - by Application
- 11. Competitive Analysis
- 11.1. Global Market Share Analysis 2024
- 11.2. Company Profiles
- 11.2.1 NXP
- 11.2.1.1. Overview
- 11.2.1.2. Products
- 11.2.1.3. SWOT Analysis
- 11.2.1.4. Recent Developments
- 11.2.1.5. Financials (Based on Availability)
- 11.2.2 Broadcom
- 11.2.2.1. Overview
- 11.2.2.2. Products
- 11.2.2.3. SWOT Analysis
- 11.2.2.4. Recent Developments
- 11.2.2.5. Financials (Based on Availability)
- 11.2.3 Qualcomm
- 11.2.3.1. Overview
- 11.2.3.2. Products
- 11.2.3.3. SWOT Analysis
- 11.2.3.4. Recent Developments
- 11.2.3.5. Financials (Based on Availability)
- 11.2.4 Texas Instruments
- 11.2.4.1. Overview
- 11.2.4.2. Products
- 11.2.4.3. SWOT Analysis
- 11.2.4.4. Recent Developments
- 11.2.4.5. Financials (Based on Availability)
- 11.2.5 STMicroelectronics
- 11.2.5.1. Overview
- 11.2.5.2. Products
- 11.2.5.3. SWOT Analysis
- 11.2.5.4. Recent Developments
- 11.2.5.5. Financials (Based on Availability)
- 11.2.6 Thales Group
- 11.2.6.1. Overview
- 11.2.6.2. Products
- 11.2.6.3. SWOT Analysis
- 11.2.6.4. Recent Developments
- 11.2.6.5. Financials (Based on Availability)
- 11.2.7 Infineon
- 11.2.7.1. Overview
- 11.2.7.2. Products
- 11.2.7.3. SWOT Analysis
- 11.2.7.4. Recent Developments
- 11.2.7.5. Financials (Based on Availability)
- 11.2.8 ams
- 11.2.8.1. Overview
- 11.2.8.2. Products
- 11.2.8.3. SWOT Analysis
- 11.2.8.4. Recent Developments
- 11.2.8.5. Financials (Based on Availability)
- 11.2.9 HID
- 11.2.9.1. Overview
- 11.2.9.2. Products
- 11.2.9.3. SWOT Analysis
- 11.2.9.4. Recent Developments
- 11.2.9.5. Financials (Based on Availability)
- 11.2.1 NXP
List of Figures
- Figure 1: Global Non Auxiliary Nfc Products Revenue Breakdown (million, %) by Region 2024 & 2032
- Figure 2: North America Non Auxiliary Nfc Products Revenue (million), by Application 2024 & 2032
- Figure 3: North America Non Auxiliary Nfc Products Revenue Share (%), by Application 2024 & 2032
- Figure 4: North America Non Auxiliary Nfc Products Revenue (million), by Type 2024 & 2032
- Figure 5: North America Non Auxiliary Nfc Products Revenue Share (%), by Type 2024 & 2032
- Figure 6: North America Non Auxiliary Nfc Products Revenue (million), by Country 2024 & 2032
- Figure 7: North America Non Auxiliary Nfc Products Revenue Share (%), by Country 2024 & 2032
- Figure 8: South America Non Auxiliary Nfc Products Revenue (million), by Application 2024 & 2032
- Figure 9: South America Non Auxiliary Nfc Products Revenue Share (%), by Application 2024 & 2032
- Figure 10: South America Non Auxiliary Nfc Products Revenue (million), by Type 2024 & 2032
- Figure 11: South America Non Auxiliary Nfc Products Revenue Share (%), by Type 2024 & 2032
- Figure 12: South America Non Auxiliary Nfc Products Revenue (million), by Country 2024 & 2032
- Figure 13: South America Non Auxiliary Nfc Products Revenue Share (%), by Country 2024 & 2032
- Figure 14: Europe Non Auxiliary Nfc Products Revenue (million), by Application 2024 & 2032
- Figure 15: Europe Non Auxiliary Nfc Products Revenue Share (%), by Application 2024 & 2032
- Figure 16: Europe Non Auxiliary Nfc Products Revenue (million), by Type 2024 & 2032
- Figure 17: Europe Non Auxiliary Nfc Products Revenue Share (%), by Type 2024 & 2032
- Figure 18: Europe Non Auxiliary Nfc Products Revenue (million), by Country 2024 & 2032
- Figure 19: Europe Non Auxiliary Nfc Products Revenue Share (%), by Country 2024 & 2032
- Figure 20: Middle East & Africa Non Auxiliary Nfc Products Revenue (million), by Application 2024 & 2032
- Figure 21: Middle East & Africa Non Auxiliary Nfc Products Revenue Share (%), by Application 2024 & 2032
- Figure 22: Middle East & Africa Non Auxiliary Nfc Products Revenue (million), by Type 2024 & 2032
- Figure 23: Middle East & Africa Non Auxiliary Nfc Products Revenue Share (%), by Type 2024 & 2032
- Figure 24: Middle East & Africa Non Auxiliary Nfc Products Revenue (million), by Country 2024 & 2032
- Figure 25: Middle East & Africa Non Auxiliary Nfc Products Revenue Share (%), by Country 2024 & 2032
- Figure 26: Asia Pacific Non Auxiliary Nfc Products Revenue (million), by Application 2024 & 2032
- Figure 27: Asia Pacific Non Auxiliary Nfc Products Revenue Share (%), by Application 2024 & 2032
- Figure 28: Asia Pacific Non Auxiliary Nfc Products Revenue (million), by Type 2024 & 2032
- Figure 29: Asia Pacific Non Auxiliary Nfc Products Revenue Share (%), by Type 2024 & 2032
- Figure 30: Asia Pacific Non Auxiliary Nfc Products Revenue (million), by Country 2024 & 2032
- Figure 31: Asia Pacific Non Auxiliary Nfc Products Revenue Share (%), by Country 2024 & 2032
List of Tables
- Table 1: Global Non Auxiliary Nfc Products Revenue million Forecast, by Region 2019 & 2032
- Table 2: Global Non Auxiliary Nfc Products Revenue million Forecast, by Application 2019 & 2032
- Table 3: Global Non Auxiliary Nfc Products Revenue million Forecast, by Type 2019 & 2032
- Table 4: Global Non Auxiliary Nfc Products Revenue million Forecast, by Region 2019 & 2032
- Table 5: Global Non Auxiliary Nfc Products Revenue million Forecast, by Application 2019 & 2032
- Table 6: Global Non Auxiliary Nfc Products Revenue million Forecast, by Type 2019 & 2032
- Table 7: Global Non Auxiliary Nfc Products Revenue million Forecast, by Country 2019 & 2032
- Table 8: United States Non Auxiliary Nfc Products Revenue (million) Forecast, by Application 2019 & 2032
- Table 9: Canada Non Auxiliary Nfc Products Revenue (million) Forecast, by Application 2019 & 2032
- Table 10: Mexico Non Auxiliary Nfc Products Revenue (million) Forecast, by Application 2019 & 2032
- Table 11: Global Non Auxiliary Nfc Products Revenue million Forecast, by Application 2019 & 2032
- Table 12: Global Non Auxiliary Nfc Products Revenue million Forecast, by Type 2019 & 2032
- Table 13: Global Non Auxiliary Nfc Products Revenue million Forecast, by Country 2019 & 2032
- Table 14: Brazil Non Auxiliary Nfc Products Revenue (million) Forecast, by Application 2019 & 2032
- Table 15: Argentina Non Auxiliary Nfc Products Revenue (million) Forecast, by Application 2019 & 2032
- Table 16: Rest of South America Non Auxiliary Nfc Products Revenue (million) Forecast, by Application 2019 & 2032
- Table 17: Global Non Auxiliary Nfc Products Revenue million Forecast, by Application 2019 & 2032
- Table 18: Global Non Auxiliary Nfc Products Revenue million Forecast, by Type 2019 & 2032
- Table 19: Global Non Auxiliary Nfc Products Revenue million Forecast, by Country 2019 & 2032
- Table 20: United Kingdom Non Auxiliary Nfc Products Revenue (million) Forecast, by Application 2019 & 2032
- Table 21: Germany Non Auxiliary Nfc Products Revenue (million) Forecast, by Application 2019 & 2032
- Table 22: France Non Auxiliary Nfc Products Revenue (million) Forecast, by Application 2019 & 2032
- Table 23: Italy Non Auxiliary Nfc Products Revenue (million) Forecast, by Application 2019 & 2032
- Table 24: Spain Non Auxiliary Nfc Products Revenue (million) Forecast, by Application 2019 & 2032
- Table 25: Russia Non Auxiliary Nfc Products Revenue (million) Forecast, by Application 2019 & 2032
- Table 26: Benelux Non Auxiliary Nfc Products Revenue (million) Forecast, by Application 2019 & 2032
- Table 27: Nordics Non Auxiliary Nfc Products Revenue (million) Forecast, by Application 2019 & 2032
- Table 28: Rest of Europe Non Auxiliary Nfc Products Revenue (million) Forecast, by Application 2019 & 2032
- Table 29: Global Non Auxiliary Nfc Products Revenue million Forecast, by Application 2019 & 2032
- Table 30: Global Non Auxiliary Nfc Products Revenue million Forecast, by Type 2019 & 2032
- Table 31: Global Non Auxiliary Nfc Products Revenue million Forecast, by Country 2019 & 2032
- Table 32: Turkey Non Auxiliary Nfc Products Revenue (million) Forecast, by Application 2019 & 2032
- Table 33: Israel Non Auxiliary Nfc Products Revenue (million) Forecast, by Application 2019 & 2032
- Table 34: GCC Non Auxiliary Nfc Products Revenue (million) Forecast, by Application 2019 & 2032
- Table 35: North Africa Non Auxiliary Nfc Products Revenue (million) Forecast, by Application 2019 & 2032
- Table 36: South Africa Non Auxiliary Nfc Products Revenue (million) Forecast, by Application 2019 & 2032
- Table 37: Rest of Middle East & Africa Non Auxiliary Nfc Products Revenue (million) Forecast, by Application 2019 & 2032
- Table 38: Global Non Auxiliary Nfc Products Revenue million Forecast, by Application 2019 & 2032
- Table 39: Global Non Auxiliary Nfc Products Revenue million Forecast, by Type 2019 & 2032
- Table 40: Global Non Auxiliary Nfc Products Revenue million Forecast, by Country 2019 & 2032
- Table 41: China Non Auxiliary Nfc Products Revenue (million) Forecast, by Application 2019 & 2032
- Table 42: India Non Auxiliary Nfc Products Revenue (million) Forecast, by Application 2019 & 2032
- Table 43: Japan Non Auxiliary Nfc Products Revenue (million) Forecast, by Application 2019 & 2032
- Table 44: South Korea Non Auxiliary Nfc Products Revenue (million) Forecast, by Application 2019 & 2032
- Table 45: ASEAN Non Auxiliary Nfc Products Revenue (million) Forecast, by Application 2019 & 2032
- Table 46: Oceania Non Auxiliary Nfc Products Revenue (million) Forecast, by Application 2019 & 2032
- Table 47: Rest of Asia Pacific Non Auxiliary Nfc Products Revenue (million) Forecast, by Application 2019 & 2032
Frequently Asked Questions
1. What is the projected Compound Annual Growth Rate (CAGR) of the Non Auxiliary Nfc Products?
The projected CAGR is approximately XXX%.
2. Which companies are prominent players in the Non Auxiliary Nfc Products?
Key companies in the market include NXP, Broadcom, Qualcomm, Texas Instruments, STMicroelectronics, Thales Group, Infineon, ams, HID.
3. What are the main segments of the Non Auxiliary Nfc Products?
The market segments include Application, Type.
4. Can you provide details about the market size?
The market size is estimated to be USD XXX million as of 2022.
5. What are some drivers contributing to market growth?
N/A
6. What are the notable trends driving market growth?
N/A
7. Are there any restraints impacting market growth?
N/A
8. Can you provide examples of recent developments in the market?
N/A
9. What pricing options are available for accessing the report?
Pricing options include single-user, multi-user, and enterprise licenses priced at USD 4250.00, USD 6375.00, and USD 8500.00 respectively.
10. Is the market size provided in terms of value or volume?
The market size is provided in terms of value, measured in million.
11. Are there any specific market keywords associated with the report?
Yes, the market keyword associated with the report is "Non Auxiliary Nfc Products," which aids in identifying and referencing the specific market segment covered.
12. How do I determine which pricing option suits my needs best?
The pricing options vary based on user requirements and access needs. Individual users may opt for single-user licenses, while businesses requiring broader access may choose multi-user or enterprise licenses for cost-effective access to the report.
13. Are there any additional resources or data provided in the Non Auxiliary Nfc Products report?
While the report offers comprehensive insights, it's advisable to review the specific contents or supplementary materials provided to ascertain if additional resources or data are available.
14. How can I stay updated on further developments or reports in the Non Auxiliary Nfc Products?
To stay informed about further developments, trends, and reports in the Non Auxiliary Nfc Products, consider subscribing to industry newsletters, following relevant companies and organizations, or regularly checking reputable industry news sources and publications.
Methodology
Step 1 - Identification of Relevant Samples Size from Population Database


Step 2 - Approaches for Defining Global Market Size (Value, Volume* & Price*)

Note*: In applicable scenarios
Step 3 - Data Sources
Primary Research
- Web Analytics
- Survey Reports
- Research Institute
- Latest Research Reports
- Opinion Leaders
Secondary Research
- Annual Reports
- White Paper
- Latest Press Release
- Industry Association
- Paid Database
- Investor Presentations

Step 4 - Data Triangulation
Involves using different sources of information in order to increase the validity of a study
These sources are likely to be stakeholders in a program - participants, other researchers, program staff, other community members, and so on.
Then we put all data in single framework & apply various statistical tools to find out the dynamic on the market.
During the analysis stage, feedback from the stakeholder groups would be compared to determine areas of agreement as well as areas of divergence
