

Key Insights
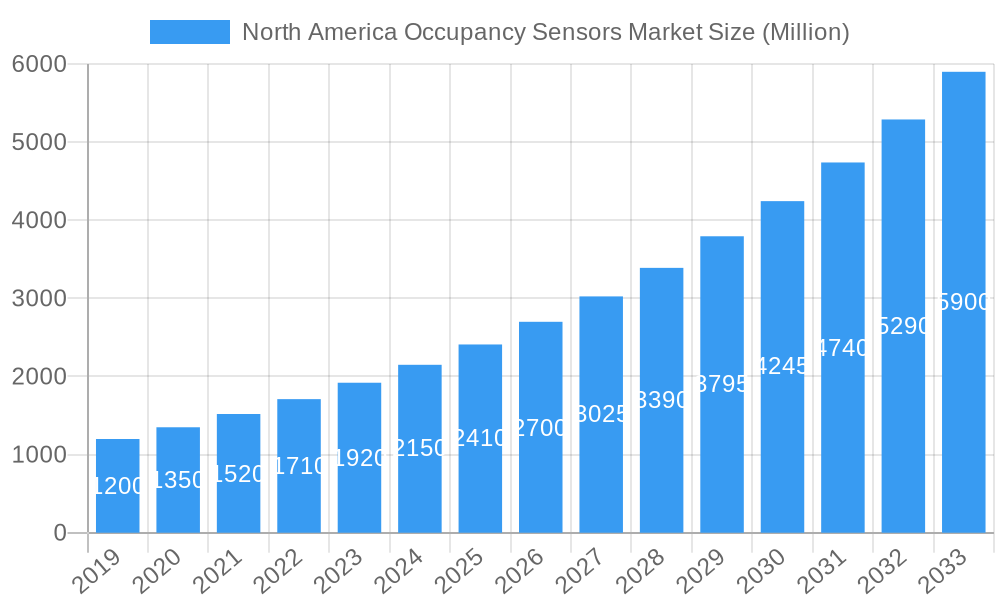
The North America Occupancy Sensors Market is projected for substantial growth, expected to reach $2.5 billion by 2025, with a robust CAGR of 13.20% through 2033. This expansion is driven by increasing demand for energy efficiency and sustainability in residential, commercial, and industrial sectors. Smart building technology adoption, influenced by energy conservation regulations and rising utility costs, is a key catalyst. Growing demand for advanced sensor technologies like PIR and Microwave sensors is accelerating precise detection and reducing energy waste in lighting, HVAC, and security. The integration of these sensors into IoT ecosystems fosters new market penetration opportunities, leading to smarter building environments.
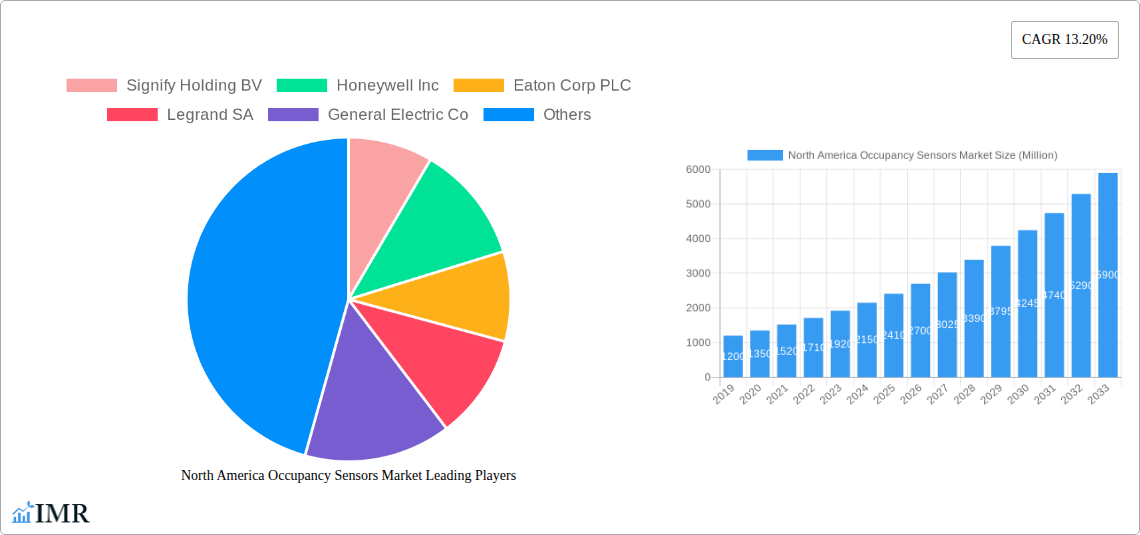
North America Occupancy Sensors Market Market Size (In Billion)
Market growth is further supported by widespread adoption across various building types. Commercial applications currently lead due to high energy consumption in large office spaces, retail, and public buildings. The residential sector is experiencing significant growth as homeowners recognize energy-saving benefits and smart home technology. While strong growth drivers exist, initial installation costs and the need for skilled deployment professionals may present challenges. Continuous innovation in sensor technology, offering enhanced accuracy, lower power consumption, and improved connectivity, is expected to overcome these obstacles and ensure sustained growth. The North American region, including the United States, Canada, and Mexico, is a leading market due to its progressive environmental policies and robust technological infrastructure.
North America Occupancy Sensors Market Company Market Share
This report provides an in-depth analysis of the North America Occupancy Sensors Market, a vital element of smart building and energy efficiency initiatives. Covering 2019-2033, with a base year of 2025, it offers insights into market dynamics, growth trends, regional leadership, product landscapes, key players, and future outlook. The analysis segments the market by Network Type, Technology, Application, and Building Type for a granular view. Volume figures are presented in Million units.
North America Occupancy Sensors Market Market Dynamics & Structure
The North America Occupancy Sensors Market is characterized by moderate market concentration, with a few leading players dominating market share, yet fostering a competitive environment driven by continuous technological innovation. Key drivers include the escalating demand for energy efficiency solutions, stringent government regulations mandating energy conservation, and the widespread adoption of smart building technologies. Competitive product substitutes, such as simple timers and manual switches, are gradually being phased out as the superior performance and cost-effectiveness of occupancy sensors become evident. End-user demographics are increasingly skewed towards commercial and industrial sectors seeking to optimize operational costs and reduce their carbon footprint. Emerging trends in M&A activities are shaping the competitive landscape, with companies strategically acquiring innovative technologies and expanding their market reach. Barriers to innovation include high initial investment costs for advanced sensor technologies and the need for skilled labor for installation and integration.
- Market Concentration: Dominated by a mix of established electrical manufacturers and specialized sensor companies.
- Technological Innovation Drivers: Energy savings mandates, IoT integration, demand for smart building automation.
- Regulatory Frameworks: Government incentives for energy-efficient buildings, building codes mandating occupancy sensing.
- Competitive Product Substitutes: Traditional timers, manual controls, basic motion detectors.
- End-User Demographics: Predominantly commercial and industrial sectors, with growing residential interest.
- M&A Trends: Strategic acquisitions to enhance product portfolios and market access.
- Innovation Barriers: High R&D costs, integration complexities, standardization challenges.
North America Occupancy Sensors Market Growth Trends & Insights
The North America Occupancy Sensors Market is projected for robust growth, driven by a confluence of factors that are reshaping building management and energy consumption paradigms. The estimated market size in 2025 is valued at xx Million units, with a projected Compound Annual Growth Rate (CAGR) of xx% from 2025 to 2033. This upward trajectory is fueled by increasing awareness of the significant energy savings achievable through intelligent occupancy detection, particularly in lighting and HVAC systems. The adoption rates are accelerating as building owners and facility managers recognize the return on investment (ROI) through reduced utility bills and enhanced occupant comfort. Technological disruptions, such as the integration of advanced algorithms for differentiating between occupied and unoccupied states and the development of multi-sensor fusion techniques, are further enhancing the precision and efficacy of these devices. Consumer behavior is shifting towards a preference for automated and intelligent environments, further bolstering the demand for occupancy sensors in both new constructions and retrofitting projects. Market penetration is steadily increasing across all building types, with commercial spaces leading the charge due to their higher energy consumption and potential for substantial savings.
Dominant Regions, Countries, or Segments in North America Occupancy Sensors Market
Within the North America Occupancy Sensors Market, the Wireless Network Type segment is emerging as a dominant force, driven by its ease of installation, flexibility, and scalability, making it ideal for retrofitting existing structures and for dynamic commercial spaces. The Passive Infrared (PIR) technology remains a cornerstone due to its cost-effectiveness and reliability for detecting human presence. In terms of applications, Lighting Control continues to be the primary market driver, directly impacting energy consumption and operational costs. The Commercial Building Type segment exhibits the highest demand, encompassing office buildings, retail spaces, educational institutions, and healthcare facilities, all seeking to optimize energy usage and meet sustainability goals.
- Dominant Network Type: Wireless, due to ease of installation and integration with smart building systems.
- Dominant Technology: Passive Infrared (PIR), offering a balance of performance and cost.
- Dominant Application: Lighting Control, leading to significant energy savings and operational efficiencies.
- Dominant Building Type: Commercial, with large energy footprints and strong drivers for cost reduction and sustainability.
- Key Drivers for Dominance:
- Economic Policies: Government incentives for energy-efficient buildings and tax rebates for green technologies.
- Infrastructure Development: Increasing smart building investments and IoT adoption across sectors.
- Regulatory Frameworks: Building codes increasingly mandating energy-saving measures, including occupancy-based controls.
- Technological Advancements: Development of more accurate, reliable, and feature-rich wireless sensors.
- Cost-Effectiveness: Demonstrable ROI through reduced energy consumption and maintenance costs.
North America Occupancy Sensors Market Product Landscape
The North America Occupancy Sensors Market is witnessing a surge in product innovations, focusing on enhanced accuracy, seamless integration, and advanced functionalities. Products now feature sophisticated algorithms to distinguish between occupants and non-occupants, minimizing false triggers and optimizing energy savings. Innovations include multi-technology sensors combining PIR with ultrasonic or microwave for superior detection in complex environments. Features like daylight harvesting integration, remote configuration via mobile apps, and compatibility with major smart home and building management systems are becoming standard. Performance metrics such as detection range, response time, and power consumption are continuously being improved.
Key Drivers, Barriers & Challenges in North America Occupancy Sensors Market
The North America Occupancy Sensors Market is propelled by a strong set of drivers, chief among them being the escalating global emphasis on energy conservation and sustainability. Government regulations, such as energy efficiency standards and building codes, are playing a pivotal role in mandating the adoption of such technologies. The increasing integration of the Internet of Things (IoT) and smart building technologies creates a conducive ecosystem for occupancy sensors, enabling sophisticated automation and data analytics.
Key challenges and restraints in this market include the initial cost of advanced sensor systems, which can be a deterrent for smaller businesses or older buildings. Supply chain disruptions and component shortages can impact manufacturing and delivery timelines, leading to price volatility. Regulatory hurdles, particularly in establishing standardized communication protocols and data privacy concerns, also present obstacles. Competitive pressures from alternative solutions and the need for skilled installers and maintenance personnel contribute to the market's complexities. The estimated impact of these challenges on market growth is xx%.
Emerging Opportunities in North America Occupancy Sensors Market
Emerging opportunities in the North America Occupancy Sensors Market lie in the untapped potential of the residential sector for smart home integration and the increasing demand for sophisticated HVAC control beyond simple lighting. The growing trend of smart city initiatives presents a vast landscape for deploying occupancy sensors in public spaces and infrastructure. Furthermore, the development of AI-powered sensors capable of predictive occupancy patterns and personalized environment control offers a significant avenue for innovation and market expansion.
Growth Accelerators in the North America Occupancy Sensors Market Industry
Several catalysts are accelerating the long-term growth of the North America Occupancy Sensors Market. Technological breakthroughs in sensor miniaturization, power efficiency, and advanced signal processing are making sensors more versatile and cost-effective. Strategic partnerships between sensor manufacturers, building automation companies, and utility providers are fostering integrated solutions and expanding market reach. Aggressive market expansion strategies, including product diversification and targeted marketing campaigns aimed at specific industry verticals, are also playing a crucial role in driving sustained growth.
Key Players Shaping the North America Occupancy Sensors Market Market
- Signify Holding BV
- Honeywell Inc
- Eaton Corp PLC
- Legrand SA
- General Electric Co
- Dwyer Instruments Inc
- Schneider Electric SE
- Johnson Controls Inc
- Analog Devices Inc
- Texas Instruments Inc
Notable Milestones in North America Occupancy Sensors Market Sector
- 2020: Increased adoption of wireless protocols like Zigbee and Z-Wave, enabling easier smart building integration.
- 2021: Introduction of AI-powered occupancy sensors capable of differentiating between static and dynamic occupancy.
- 2022: Growing demand for multi-technology sensors combining PIR with ultrasonic or microwave for enhanced accuracy.
- 2023: Enhanced focus on data analytics and integration with Building Management Systems (BMS) for energy optimization.
- 2024: Increased product offerings with advanced features such as daylight harvesting and remote configuration capabilities.
In-Depth North America Occupancy Sensors Market Market Outlook
The future outlook for the North America Occupancy Sensors Market is exceptionally promising, driven by the sustained push for energy efficiency, smart building integration, and IoT proliferation. Growth accelerators such as advancements in sensor technology, strategic collaborations, and expansion into new application areas will continue to fuel market expansion. The increasing demand for sustainable and intelligent environments across residential, commercial, and industrial sectors positions occupancy sensors as an indispensable component of modern infrastructure. Strategic opportunities lie in developing more affordable and adaptable solutions for the retrofitting market and in leveraging data analytics for predictive maintenance and enhanced building performance.
North America Occupancy Sensors Market Segmentation
-
1. Network Type
- 1.1. Wired
- 1.2. Wireless
-
2. Technology
- 2.1. Ultrasonic
- 2.2. Passive Infrared
- 2.3. Microwave
-
3. Application
- 3.1. Lighting Control
- 3.2. HVAC
- 3.3. Security & Surveillance
-
4. Building Type
- 4.1. Residential
- 4.2. Commercial
North America Occupancy Sensors Market Segmentation By Geography
-
1. North America
- 1.1. United States
- 1.2. Canada
- 1.3. Mexico
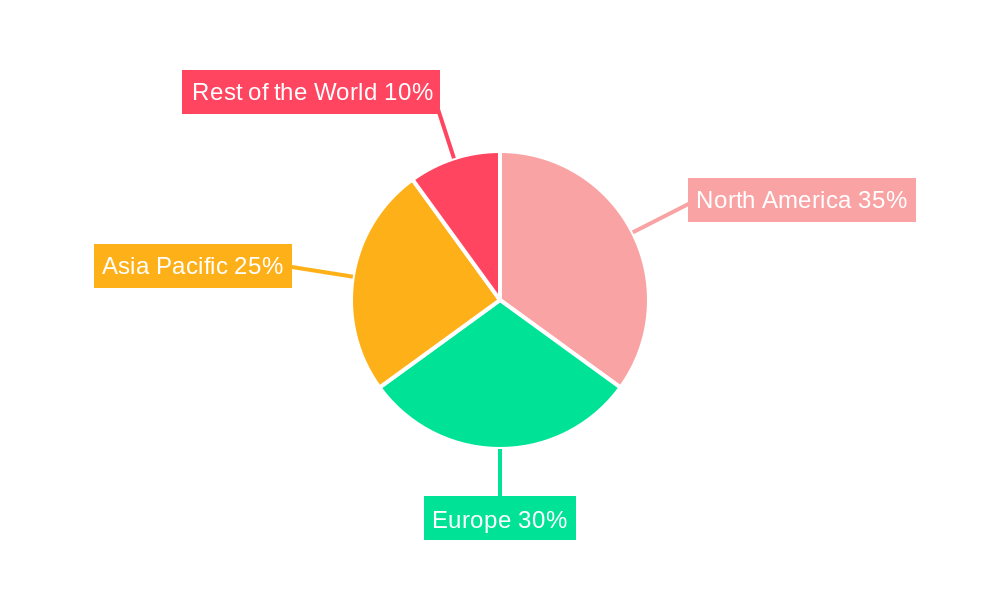
North America Occupancy Sensors Market Regional Market Share
Geographic Coverage of North America Occupancy Sensors Market
North America Occupancy Sensors Market REPORT HIGHLIGHTS
| Aspects | Details |
|---|---|
| Study Period | 2020-2034 |
| Base Year | 2025 |
| Estimated Year | 2026 |
| Forecast Period | 2026-2034 |
| Historical Period | 2020-2025 |
| Growth Rate | CAGR of 12.1% from 2020-2034 |
| Segmentation |
|
Table of Contents
- 1. Introduction
- 1.1. Research Scope
- 1.2. Market Segmentation
- 1.3. Research Methodology
- 1.4. Definitions and Assumptions
- 2. Executive Summary
- 2.1. Introduction
- 3. Market Dynamics
- 3.1. Introduction
- 3.2. Market Drivers
- 3.2.1. ; Rising demand for energy-efficient devices
- 3.3. Market Restrains
- 3.3.1. Cryptojacking Threats
- 3.4. Market Trends
- 3.4.1. Residential Segment is Expected to Witness Significant Growth
- 4. Market Factor Analysis
- 4.1. Porters Five Forces
- 4.2. Supply/Value Chain
- 4.3. PESTEL analysis
- 4.4. Market Entropy
- 4.5. Patent/Trademark Analysis
- 5. North America Occupancy Sensors Market Analysis, Insights and Forecast, 2020-2032
- 5.1. Market Analysis, Insights and Forecast - by Network Type
- 5.1.1. Wired
- 5.1.2. Wireless
- 5.2. Market Analysis, Insights and Forecast - by Technology
- 5.2.1. Ultrasonic
- 5.2.2. Passive Infrared
- 5.2.3. Microwave
- 5.3. Market Analysis, Insights and Forecast - by Application
- 5.3.1. Lighting Control
- 5.3.2. HVAC
- 5.3.3. Security & Surveillance
- 5.4. Market Analysis, Insights and Forecast - by Building Type
- 5.4.1. Residential
- 5.4.2. Commercial
- 5.5. Market Analysis, Insights and Forecast - by Region
- 5.5.1. North America
- 5.1. Market Analysis, Insights and Forecast - by Network Type
- 6. Competitive Analysis
- 6.1. Market Share Analysis 2025
- 6.2. Company Profiles
- 6.2.1 Signify Holding BV
- 6.2.1.1. Overview
- 6.2.1.2. Products
- 6.2.1.3. SWOT Analysis
- 6.2.1.4. Recent Developments
- 6.2.1.5. Financials (Based on Availability)
- 6.2.2 Honeywell Inc
- 6.2.2.1. Overview
- 6.2.2.2. Products
- 6.2.2.3. SWOT Analysis
- 6.2.2.4. Recent Developments
- 6.2.2.5. Financials (Based on Availability)
- 6.2.3 Eaton Corp PLC
- 6.2.3.1. Overview
- 6.2.3.2. Products
- 6.2.3.3. SWOT Analysis
- 6.2.3.4. Recent Developments
- 6.2.3.5. Financials (Based on Availability)
- 6.2.4 Legrand SA
- 6.2.4.1. Overview
- 6.2.4.2. Products
- 6.2.4.3. SWOT Analysis
- 6.2.4.4. Recent Developments
- 6.2.4.5. Financials (Based on Availability)
- 6.2.5 General Electric Co
- 6.2.5.1. Overview
- 6.2.5.2. Products
- 6.2.5.3. SWOT Analysis
- 6.2.5.4. Recent Developments
- 6.2.5.5. Financials (Based on Availability)
- 6.2.6 Dwyer Instruments Inc
- 6.2.6.1. Overview
- 6.2.6.2. Products
- 6.2.6.3. SWOT Analysis
- 6.2.6.4. Recent Developments
- 6.2.6.5. Financials (Based on Availability)
- 6.2.7 Schneider Electric SE
- 6.2.7.1. Overview
- 6.2.7.2. Products
- 6.2.7.3. SWOT Analysis
- 6.2.7.4. Recent Developments
- 6.2.7.5. Financials (Based on Availability)
- 6.2.8 Johnson Controls Inc
- 6.2.8.1. Overview
- 6.2.8.2. Products
- 6.2.8.3. SWOT Analysis
- 6.2.8.4. Recent Developments
- 6.2.8.5. Financials (Based on Availability)
- 6.2.9 Analog Devices Inc
- 6.2.9.1. Overview
- 6.2.9.2. Products
- 6.2.9.3. SWOT Analysis
- 6.2.9.4. Recent Developments
- 6.2.9.5. Financials (Based on Availability)
- 6.2.10 Texas Instruments Inc*List Not Exhaustive
- 6.2.10.1. Overview
- 6.2.10.2. Products
- 6.2.10.3. SWOT Analysis
- 6.2.10.4. Recent Developments
- 6.2.10.5. Financials (Based on Availability)
- 6.2.1 Signify Holding BV
List of Figures
- Figure 1: North America Occupancy Sensors Market Revenue Breakdown (billion, %) by Product 2025 & 2033
- Figure 2: North America Occupancy Sensors Market Share (%) by Company 2025
List of Tables
- Table 1: North America Occupancy Sensors Market Revenue billion Forecast, by Network Type 2020 & 2033
- Table 2: North America Occupancy Sensors Market Revenue billion Forecast, by Technology 2020 & 2033
- Table 3: North America Occupancy Sensors Market Revenue billion Forecast, by Application 2020 & 2033
- Table 4: North America Occupancy Sensors Market Revenue billion Forecast, by Building Type 2020 & 2033
- Table 5: North America Occupancy Sensors Market Revenue billion Forecast, by Region 2020 & 2033
- Table 6: North America Occupancy Sensors Market Revenue billion Forecast, by Network Type 2020 & 2033
- Table 7: North America Occupancy Sensors Market Revenue billion Forecast, by Technology 2020 & 2033
- Table 8: North America Occupancy Sensors Market Revenue billion Forecast, by Application 2020 & 2033
- Table 9: North America Occupancy Sensors Market Revenue billion Forecast, by Building Type 2020 & 2033
- Table 10: North America Occupancy Sensors Market Revenue billion Forecast, by Country 2020 & 2033
- Table 11: United States North America Occupancy Sensors Market Revenue (billion) Forecast, by Application 2020 & 2033
- Table 12: Canada North America Occupancy Sensors Market Revenue (billion) Forecast, by Application 2020 & 2033
- Table 13: Mexico North America Occupancy Sensors Market Revenue (billion) Forecast, by Application 2020 & 2033
Frequently Asked Questions
1. What is the projected Compound Annual Growth Rate (CAGR) of the North America Occupancy Sensors Market?
The projected CAGR is approximately 12.1%.
2. Which companies are prominent players in the North America Occupancy Sensors Market?
Key companies in the market include Signify Holding BV, Honeywell Inc, Eaton Corp PLC, Legrand SA, General Electric Co, Dwyer Instruments Inc, Schneider Electric SE, Johnson Controls Inc, Analog Devices Inc, Texas Instruments Inc*List Not Exhaustive.
3. What are the main segments of the North America Occupancy Sensors Market?
The market segments include Network Type, Technology, Application, Building Type.
4. Can you provide details about the market size?
The market size is estimated to be USD 1.35 billion as of 2022.
5. What are some drivers contributing to market growth?
; Rising demand for energy-efficient devices.
6. What are the notable trends driving market growth?
Residential Segment is Expected to Witness Significant Growth.
7. Are there any restraints impacting market growth?
Cryptojacking Threats.
8. Can you provide examples of recent developments in the market?
N/A
9. What pricing options are available for accessing the report?
Pricing options include single-user, multi-user, and enterprise licenses priced at USD 4750, USD 5250, and USD 8750 respectively.
10. Is the market size provided in terms of value or volume?
The market size is provided in terms of value, measured in billion.
11. Are there any specific market keywords associated with the report?
Yes, the market keyword associated with the report is "North America Occupancy Sensors Market," which aids in identifying and referencing the specific market segment covered.
12. How do I determine which pricing option suits my needs best?
The pricing options vary based on user requirements and access needs. Individual users may opt for single-user licenses, while businesses requiring broader access may choose multi-user or enterprise licenses for cost-effective access to the report.
13. Are there any additional resources or data provided in the North America Occupancy Sensors Market report?
While the report offers comprehensive insights, it's advisable to review the specific contents or supplementary materials provided to ascertain if additional resources or data are available.
14. How can I stay updated on further developments or reports in the North America Occupancy Sensors Market?
To stay informed about further developments, trends, and reports in the North America Occupancy Sensors Market, consider subscribing to industry newsletters, following relevant companies and organizations, or regularly checking reputable industry news sources and publications.
Methodology
Step 1 - Identification of Relevant Samples Size from Population Database


Step 2 - Approaches for Defining Global Market Size (Value, Volume* & Price*)

Note*: In applicable scenarios
Step 3 - Data Sources
Primary Research
- Web Analytics
- Survey Reports
- Research Institute
- Latest Research Reports
- Opinion Leaders
Secondary Research
- Annual Reports
- White Paper
- Latest Press Release
- Industry Association
- Paid Database
- Investor Presentations

Step 4 - Data Triangulation
Involves using different sources of information in order to increase the validity of a study
These sources are likely to be stakeholders in a program - participants, other researchers, program staff, other community members, and so on.
Then we put all data in single framework & apply various statistical tools to find out the dynamic on the market.
During the analysis stage, feedback from the stakeholder groups would be compared to determine areas of agreement as well as areas of divergence