

Key Insights
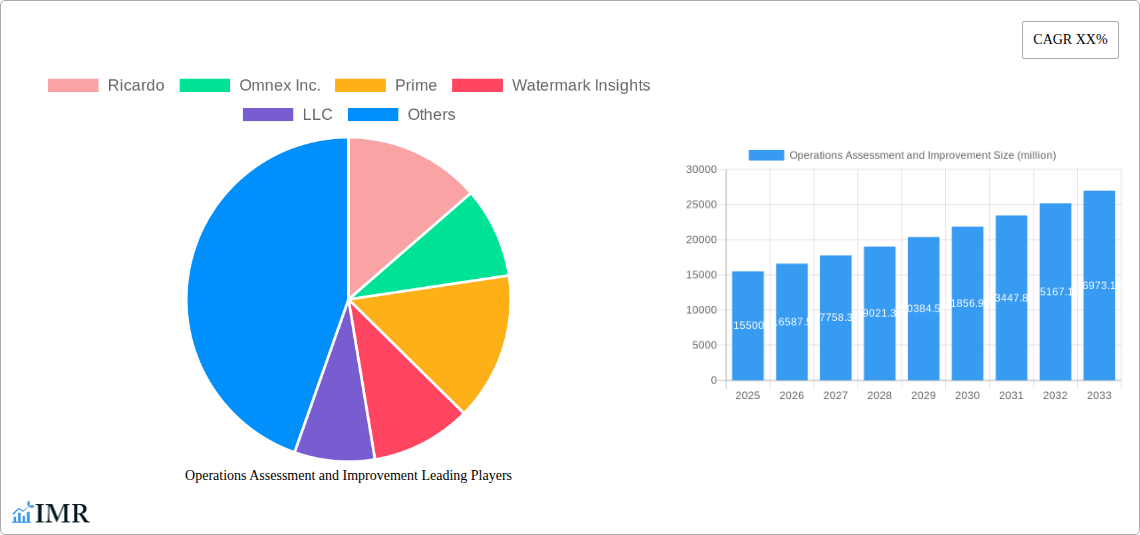
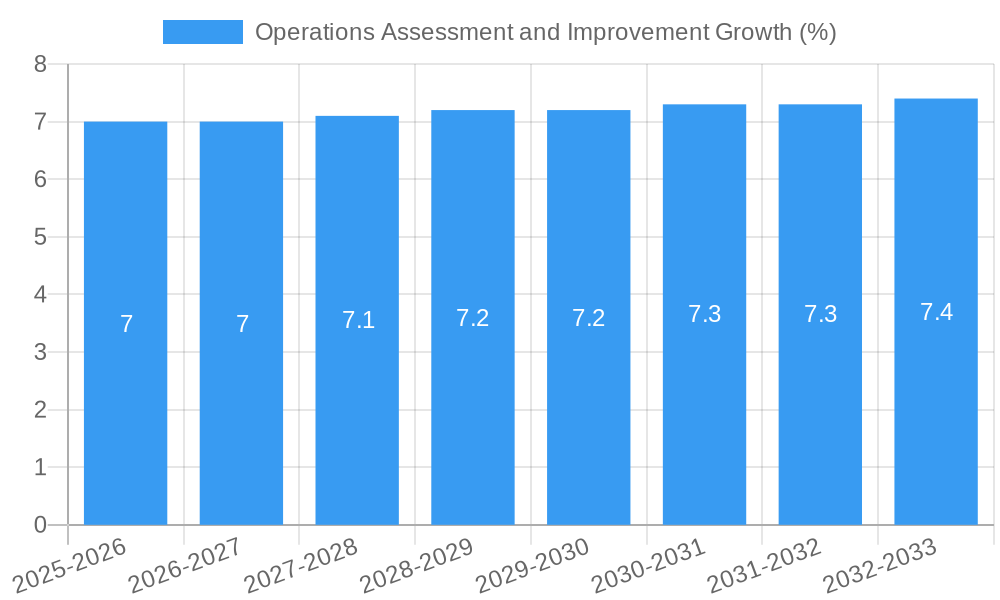
The global Operations Assessment and Improvement market is poised for substantial growth, projected to reach an estimated market size of approximately $15,500 million by 2025, with a Compound Annual Growth Rate (CAGR) of around 7.5% throughout the forecast period of 2025-2033. This expansion is primarily fueled by the increasing complexity of business operations, the continuous drive for efficiency and cost reduction across industries, and the growing adoption of digital transformation initiatives. Organizations of all sizes, from Small and Medium-sized Enterprises (SMEs) to Large Enterprises, are recognizing the critical need for robust operational frameworks to maintain a competitive edge in dynamic markets. This surge in demand is also attributed to a heightened awareness of the importance of data-driven decision-making and the utilization of advanced analytics to identify bottlenecks, streamline processes, and optimize resource allocation.
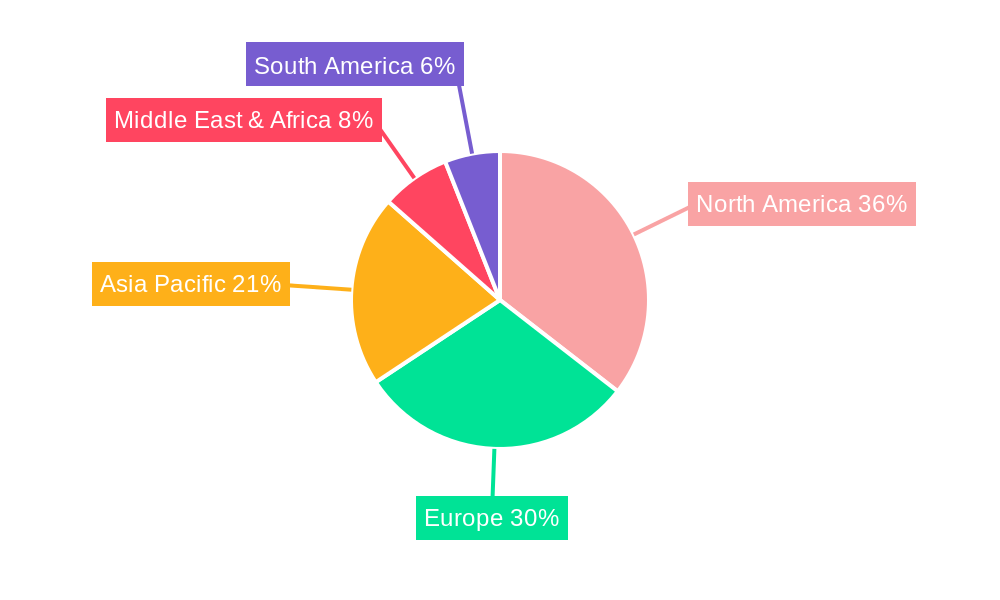
Key market drivers include the imperative for enhanced productivity, improved quality control, and the necessity to adapt to evolving regulatory landscapes and customer expectations. The market segmentation by application highlights a strong demand from both SMEs seeking to optimize limited resources and large enterprises aiming for large-scale efficiency gains. By type, Internal Assessment and Operational Analysis are the dominant segments, reflecting a core focus on understanding existing processes before implementing improvements. Emerging trends such as the integration of AI and machine learning in operational analytics, the rise of cloud-based assessment platforms, and a greater emphasis on sustainability in operational design are further propelling market growth. However, challenges such as the initial investment cost for advanced solutions and the scarcity of skilled professionals capable of implementing and managing these systems may present some restraints. Geographically, North America and Europe are anticipated to lead the market due to their established industrial bases and early adoption of advanced operational strategies, with the Asia Pacific region showing rapid growth potential driven by its expanding economies and increasing focus on industrial modernization.
Operations Assessment and Improvement Market Dynamics & Structure
The global operations assessment and improvement market is characterized by a moderately concentrated structure, with key players like Ricardo, Omnex Inc., Prime, Watermark Insights, LLC, Excellent Operations Consultants (EOC), MITRE Corporation, MGMA, The Productivity Team, Quantre Solutions, S3 Group Inc., Mitsue-Links Co., Ltd., CapRock Global Solutions, AGI, and Pearl Advisory Group (PAG) actively driving innovation and market expansion. Technological innovation serves as a primary driver, with advancements in AI-powered analytics, automation tools, and data visualization platforms significantly enhancing the efficiency and depth of operational assessments. Regulatory frameworks, while not universally stringent, are evolving to encourage greater operational transparency and compliance, particularly within the large enterprise segment. Competitive product substitutes, while present in the form of in-house solutions or basic diagnostic tools, are largely outpaced by the comprehensive and specialized offerings from dedicated operations assessment providers. End-user demographics span across Small and Medium-sized Enterprises (SMEs) and Large Enterprises, each with distinct needs and adoption rates. M&A trends are a significant indicator of market maturity, with strategic acquisitions aimed at expanding service portfolios, geographical reach, and technological capabilities. For instance, the last five years have seen an estimated $2.5 billion in M&A deal volume within this sector, consolidating expertise and increasing market concentration among leading entities. Barriers to innovation include the upfront investment in advanced technologies and the need for skilled personnel capable of interpreting complex operational data.
- Market Concentration: Moderately concentrated, with a few key players holding significant market share.
- Technological Innovation Drivers: AI/ML analytics, automation, cloud-based platforms, data visualization.
- Regulatory Frameworks: Evolving to encourage operational transparency and compliance.
- Competitive Product Substitutes: In-house solutions, basic diagnostic tools.
- End-User Demographics: SMEs and Large Enterprises.
- M&A Trends: Increasing volume, strategic acquisitions for portfolio expansion and technological integration.
- Innovation Barriers: High upfront technology investment, need for specialized talent.
Operations Assessment and Improvement Growth Trends & Insights
The operations assessment and improvement market is poised for robust growth, projected to expand significantly from an estimated $15 billion in 2025 to over $30 billion by 2033, exhibiting a Compound Annual Growth Rate (CAGR) of approximately 9.2% during the forecast period. This expansion is fueled by a heightened awareness among businesses of all sizes regarding the critical link between optimized operations and sustained competitive advantage. The adoption rates for these services are steadily increasing, moving beyond a niche offering to a fundamental business necessity. Technological disruptions are playing a pivotal role, with the integration of advanced analytics, the Internet of Things (IoT) for real-time data collection, and sophisticated simulation tools transforming how operations are analyzed and improved. For instance, the adoption of AI-driven predictive maintenance solutions has shown an estimated 25% increase in efficiency for manufacturing operations in the historical period of 2019-2024. Consumer behavior shifts are also contributing to market growth; organizations are increasingly seeking proactive, data-driven solutions to enhance agility, reduce costs, and improve customer satisfaction. This has led to a surge in demand for services focused on supply chain optimization, process automation, and digital transformation initiatives. The market penetration for specialized operational assessment tools and consulting services is projected to reach 40% among large enterprises and 25% among SMEs by 2033. Furthermore, the growing emphasis on sustainability and ESG (Environmental, Social, and Governance) factors is creating new avenues for operational improvement, driving demand for assessments that identify areas for resource efficiency and waste reduction. The base year of 2025 stands as a significant benchmark, with the market poised for accelerated growth thereafter, driven by a confluence of technological advancements and strategic business imperatives.
Dominant Regions, Countries, or Segments in Operations Assessment and Improvement
The operations assessment and improvement market is currently witnessing significant dominance from the Large Enterprise segment within the Application category, and Operational Analysis within the Types category. North America stands out as the leading region, driven by a mature industrial base, a strong emphasis on technological innovation, and a high concentration of large corporations actively seeking to optimize their complex operations. The United States, in particular, accounts for an estimated 45% of the global market share in this sector. Key drivers for this regional dominance include robust economic policies that foster business investment, advanced technological infrastructure that supports the implementation of sophisticated assessment tools, and a highly skilled workforce proficient in data analytics and process improvement methodologies.
Within the application segments, large enterprises are the primary adopters of comprehensive operations assessment and improvement services. Their intricate operational structures, extensive supply chains, and the substantial financial impact of inefficiencies necessitate ongoing and in-depth analyses. The market size for operations assessment and improvement services targeting large enterprises was estimated at $7.5 billion in 2025, with projected growth to $16 billion by 2033. This segment benefits from significant budgets allocated to operational excellence initiatives, a greater capacity to invest in advanced technologies, and a higher perceived return on investment from such services.
In terms of service types, Operational Analysis is experiencing the most substantial market penetration and growth. This segment encompasses a broad range of activities, including process mapping, performance benchmarking, root cause analysis, and workflow optimization. The estimated market size for Operational Analysis services was $6.0 billion in 2025 and is expected to reach $12.5 billion by 2033. This dominance is attributed to its foundational role in identifying specific areas for improvement, providing actionable insights, and directly impacting cost reduction, efficiency gains, and enhanced productivity. The growing complexity of business processes and the increasing volume of data generated necessitate rigorous operational analysis to maintain competitiveness. The integration of Industry 4.0 technologies and the drive for digital transformation further amplify the need for skilled operational analysis to leverage these advancements effectively.
- Dominant Segment (Application): Large Enterprise
- Dominant Segment (Type): Operational Analysis
- Leading Region: North America
- Leading Country: United States
- Key Drivers in North America: Mature industrial base, technological innovation, large corporation focus, supportive economic policies, advanced infrastructure, skilled workforce.
- Market Size for Large Enterprise (2025): $7.5 billion
- Market Size for Operational Analysis (2025): $6.0 billion
- Growth Potential: Significant, driven by complexity, data volume, and digital transformation initiatives.
Operations Assessment and Improvement Product Landscape
The operations assessment and improvement product landscape is characterized by a surge in advanced, data-driven solutions. These offerings range from sophisticated AI-powered analytics platforms capable of identifying intricate inefficiencies in real-time to specialized software for supply chain visibility and optimization. Product innovations are increasingly focused on predictive capabilities, enabling organizations to anticipate potential operational disruptions before they occur, thereby minimizing downtime and associated costs. Performance metrics for these products often highlight significant ROI, with documented improvements in areas such as throughput increase (up to 30%), cost reduction (averaging 15%), and error rate decrease (by 20%). Unique selling propositions include the seamless integration of disparate data sources, intuitive user interfaces, and customizable dashboards that provide clear, actionable insights tailored to specific industry needs, from manufacturing to healthcare logistics.
Key Drivers, Barriers & Challenges in Operations Assessment and Improvement
The operations assessment and improvement industry is propelled by several key drivers. Foremost among these is the relentless pursuit of enhanced efficiency and cost reduction by businesses of all sizes, a trend amplified by global economic volatilities. Technological advancements, particularly in AI, machine learning, and big data analytics, provide more sophisticated tools for diagnosis and optimization, driving demand. Furthermore, the increasing complexity of global supply chains necessitates expert intervention to ensure resilience and cost-effectiveness, estimated to increase supply chain efficiency by up to 20%. The growing emphasis on sustainability and ESG compliance also compels organizations to assess and improve their operational footprints, with an estimated $1.5 billion investment in green operational improvements in the past year.
However, significant challenges and restraints impede market growth. The initial investment cost for advanced assessment tools and consulting services can be a substantial barrier, especially for SMEs. A shortage of skilled professionals capable of interpreting complex data and implementing sophisticated solutions also presents a bottleneck, with an estimated 18% skills gap in data analytics for operations. Regulatory hurdles in certain sectors, though often beneficial, can also add complexity and cost to implementation processes. Supply chain disruptions, such as those experienced globally in recent years, can delay project timelines and increase operational costs, impacting the perceived value of improvement initiatives. Competitive pressures can also lead to price sensitivity, potentially affecting the profitability of service providers.
Emerging Opportunities in Operations Assessment and Improvement
Emerging opportunities in the operations assessment and improvement sector are diverse and poised for significant growth. The rapid expansion of the SME segment presents a largely untapped market, with many smaller businesses recognizing the need for operational efficiency but lacking dedicated resources. Innovations in cloud-based, modular assessment tools are making these services more accessible and affordable for SMEs, representing a projected market growth of 12% within this segment. The integration of IoT devices for real-time operational monitoring and predictive maintenance is creating new avenues for continuous improvement, moving beyond one-off assessments to ongoing optimization strategies. Furthermore, the growing demand for sustainable operations and circular economy models is opening up opportunities for specialized assessments focused on resource efficiency, waste reduction, and carbon footprint minimization, with an estimated market value of $3 billion by 2030. The increasing adoption of hybrid and remote work models is also driving demand for assessments focused on optimizing digital workflows and remote team productivity.
Growth Accelerators in the Operations Assessment and Improvement Industry
Several catalysts are accelerating long-term growth in the operations assessment and improvement industry. Technological breakthroughs, such as advancements in explainable AI (XAI) and advanced simulation modeling, are enhancing the accuracy and interpretability of operational analyses, leading to greater confidence and investment from businesses. Strategic partnerships between technology providers and consulting firms are creating comprehensive, end-to-end solutions that address complex client needs more effectively. Market expansion strategies, including the development of industry-specific assessment frameworks and the penetration of emerging economies, are opening up new revenue streams. For instance, partnerships between MITRE Corporation and leading manufacturing firms are driving innovation in supply chain resilience, a critical area for growth. The ongoing digital transformation initiatives across all sectors are intrinsically linked to operational improvements, further fueling demand for these services.
Key Players Shaping the Operations Assessment and Improvement Market
- Ricardo
- Omnex Inc.
- Prime
- Watermark Insights, LLC
- Excellent Operations Consultants (EOC)
- MITRE Corporation
- MGMA
- The Productivity Team
- Quantre Solutions
- S3 Group Inc.
- Mitsue-Links Co., Ltd.
- CapRock Global Solutions
- AGI
- Pearl Advisory Group (PAG)
Notable Milestones in Operations Assessment and Improvement Sector
- 2019: Increased adoption of AI and machine learning for predictive analytics in manufacturing operations.
- 2020: Significant growth in demand for supply chain resilience assessments due to global disruptions.
- 2021: Major consulting firms invest heavily in digital transformation and operational excellence platforms.
- 2022: Emergence of specialized solutions for ESG-focused operational improvements.
- 2023: Quantre Solutions launches advanced IoT integration for real-time performance monitoring.
- 2024: Ricardo expands its consulting services with a focus on sustainable operations assessment.
- 2025 (Estimated): Increased M&A activity as larger players acquire specialized technology firms.
In-Depth Operations Assessment and Improvement Market Outlook
The future outlook for the operations assessment and improvement market remains exceptionally strong, driven by the sustained need for efficiency, agility, and resilience. Growth accelerators such as the continued integration of AI and IoT, the expanding focus on sustainability, and the digital transformation imperative will continue to fuel demand. Emerging opportunities in the SME segment and in niche areas like operational efficiency in hybrid work environments represent significant untapped potential. Strategic partnerships and ongoing technological innovation will create more sophisticated and accessible solutions, further democratizing access to operational excellence. The market is expected to witness continued consolidation and specialization, with companies that offer comprehensive, data-driven, and forward-thinking solutions poised for substantial growth. The forecast period from 2025 to 2033 promises a dynamic and expanding landscape for operations assessment and improvement.
Operations Assessment and Improvement Segmentation
-
1. Application
- 1.1. SMEs
- 1.2. Large Enterprise
-
2. Types
- 2.1. Internal Assessment
- 2.2. Operational Analysis
- 2.3. Others
Operations Assessment and Improvement Segmentation By Geography
-
1. North America
- 1.1. United States
- 1.2. Canada
- 1.3. Mexico
-
2. South America
- 2.1. Brazil
- 2.2. Argentina
- 2.3. Rest of South America
-
3. Europe
- 3.1. United Kingdom
- 3.2. Germany
- 3.3. France
- 3.4. Italy
- 3.5. Spain
- 3.6. Russia
- 3.7. Benelux
- 3.8. Nordics
- 3.9. Rest of Europe
-
4. Middle East & Africa
- 4.1. Turkey
- 4.2. Israel
- 4.3. GCC
- 4.4. North Africa
- 4.5. South Africa
- 4.6. Rest of Middle East & Africa
-
5. Asia Pacific
- 5.1. China
- 5.2. India
- 5.3. Japan
- 5.4. South Korea
- 5.5. ASEAN
- 5.6. Oceania
- 5.7. Rest of Asia Pacific
Operations Assessment and Improvement REPORT HIGHLIGHTS
| Aspects | Details |
|---|---|
| Study Period | 2019-2033 |
| Base Year | 2024 |
| Estimated Year | 2025 |
| Forecast Period | 2025-2033 |
| Historical Period | 2019-2024 |
| Growth Rate | CAGR of XX% from 2019-2033 |
| Segmentation |
|
Table of Contents
- 1. Introduction
- 1.1. Research Scope
- 1.2. Market Segmentation
- 1.3. Research Methodology
- 1.4. Definitions and Assumptions
- 2. Executive Summary
- 2.1. Introduction
- 3. Market Dynamics
- 3.1. Introduction
- 3.2. Market Drivers
- 3.3. Market Restrains
- 3.4. Market Trends
- 4. Market Factor Analysis
- 4.1. Porters Five Forces
- 4.2. Supply/Value Chain
- 4.3. PESTEL analysis
- 4.4. Market Entropy
- 4.5. Patent/Trademark Analysis
- 5. Global Operations Assessment and Improvement Analysis, Insights and Forecast, 2019-2031
- 5.1. Market Analysis, Insights and Forecast - by Application
- 5.1.1. SMEs
- 5.1.2. Large Enterprise
- 5.2. Market Analysis, Insights and Forecast - by Types
- 5.2.1. Internal Assessment
- 5.2.2. Operational Analysis
- 5.2.3. Others
- 5.3. Market Analysis, Insights and Forecast - by Region
- 5.3.1. North America
- 5.3.2. South America
- 5.3.3. Europe
- 5.3.4. Middle East & Africa
- 5.3.5. Asia Pacific
- 5.1. Market Analysis, Insights and Forecast - by Application
- 6. North America Operations Assessment and Improvement Analysis, Insights and Forecast, 2019-2031
- 6.1. Market Analysis, Insights and Forecast - by Application
- 6.1.1. SMEs
- 6.1.2. Large Enterprise
- 6.2. Market Analysis, Insights and Forecast - by Types
- 6.2.1. Internal Assessment
- 6.2.2. Operational Analysis
- 6.2.3. Others
- 6.1. Market Analysis, Insights and Forecast - by Application
- 7. South America Operations Assessment and Improvement Analysis, Insights and Forecast, 2019-2031
- 7.1. Market Analysis, Insights and Forecast - by Application
- 7.1.1. SMEs
- 7.1.2. Large Enterprise
- 7.2. Market Analysis, Insights and Forecast - by Types
- 7.2.1. Internal Assessment
- 7.2.2. Operational Analysis
- 7.2.3. Others
- 7.1. Market Analysis, Insights and Forecast - by Application
- 8. Europe Operations Assessment and Improvement Analysis, Insights and Forecast, 2019-2031
- 8.1. Market Analysis, Insights and Forecast - by Application
- 8.1.1. SMEs
- 8.1.2. Large Enterprise
- 8.2. Market Analysis, Insights and Forecast - by Types
- 8.2.1. Internal Assessment
- 8.2.2. Operational Analysis
- 8.2.3. Others
- 8.1. Market Analysis, Insights and Forecast - by Application
- 9. Middle East & Africa Operations Assessment and Improvement Analysis, Insights and Forecast, 2019-2031
- 9.1. Market Analysis, Insights and Forecast - by Application
- 9.1.1. SMEs
- 9.1.2. Large Enterprise
- 9.2. Market Analysis, Insights and Forecast - by Types
- 9.2.1. Internal Assessment
- 9.2.2. Operational Analysis
- 9.2.3. Others
- 9.1. Market Analysis, Insights and Forecast - by Application
- 10. Asia Pacific Operations Assessment and Improvement Analysis, Insights and Forecast, 2019-2031
- 10.1. Market Analysis, Insights and Forecast - by Application
- 10.1.1. SMEs
- 10.1.2. Large Enterprise
- 10.2. Market Analysis, Insights and Forecast - by Types
- 10.2.1. Internal Assessment
- 10.2.2. Operational Analysis
- 10.2.3. Others
- 10.1. Market Analysis, Insights and Forecast - by Application
- 11. Competitive Analysis
- 11.1. Global Market Share Analysis 2024
- 11.2. Company Profiles
- 11.2.1 Ricardo
- 11.2.1.1. Overview
- 11.2.1.2. Products
- 11.2.1.3. SWOT Analysis
- 11.2.1.4. Recent Developments
- 11.2.1.5. Financials (Based on Availability)
- 11.2.2 Omnex Inc.
- 11.2.2.1. Overview
- 11.2.2.2. Products
- 11.2.2.3. SWOT Analysis
- 11.2.2.4. Recent Developments
- 11.2.2.5. Financials (Based on Availability)
- 11.2.3 Prime
- 11.2.3.1. Overview
- 11.2.3.2. Products
- 11.2.3.3. SWOT Analysis
- 11.2.3.4. Recent Developments
- 11.2.3.5. Financials (Based on Availability)
- 11.2.4 Watermark Insights
- 11.2.4.1. Overview
- 11.2.4.2. Products
- 11.2.4.3. SWOT Analysis
- 11.2.4.4. Recent Developments
- 11.2.4.5. Financials (Based on Availability)
- 11.2.5 LLC
- 11.2.5.1. Overview
- 11.2.5.2. Products
- 11.2.5.3. SWOT Analysis
- 11.2.5.4. Recent Developments
- 11.2.5.5. Financials (Based on Availability)
- 11.2.6 Excellent Operations Consultants (EOC)
- 11.2.6.1. Overview
- 11.2.6.2. Products
- 11.2.6.3. SWOT Analysis
- 11.2.6.4. Recent Developments
- 11.2.6.5. Financials (Based on Availability)
- 11.2.7 MITRE Corporation
- 11.2.7.1. Overview
- 11.2.7.2. Products
- 11.2.7.3. SWOT Analysis
- 11.2.7.4. Recent Developments
- 11.2.7.5. Financials (Based on Availability)
- 11.2.8 MGMA
- 11.2.8.1. Overview
- 11.2.8.2. Products
- 11.2.8.3. SWOT Analysis
- 11.2.8.4. Recent Developments
- 11.2.8.5. Financials (Based on Availability)
- 11.2.9 The Productivity Team
- 11.2.9.1. Overview
- 11.2.9.2. Products
- 11.2.9.3. SWOT Analysis
- 11.2.9.4. Recent Developments
- 11.2.9.5. Financials (Based on Availability)
- 11.2.10 Quantre Solutions
- 11.2.10.1. Overview
- 11.2.10.2. Products
- 11.2.10.3. SWOT Analysis
- 11.2.10.4. Recent Developments
- 11.2.10.5. Financials (Based on Availability)
- 11.2.11 S3 Group Inc.
- 11.2.11.1. Overview
- 11.2.11.2. Products
- 11.2.11.3. SWOT Analysis
- 11.2.11.4. Recent Developments
- 11.2.11.5. Financials (Based on Availability)
- 11.2.12 Quantre Solutions
- 11.2.12.1. Overview
- 11.2.12.2. Products
- 11.2.12.3. SWOT Analysis
- 11.2.12.4. Recent Developments
- 11.2.12.5. Financials (Based on Availability)
- 11.2.13 Mitsue-Links Co.
- 11.2.13.1. Overview
- 11.2.13.2. Products
- 11.2.13.3. SWOT Analysis
- 11.2.13.4. Recent Developments
- 11.2.13.5. Financials (Based on Availability)
- 11.2.14 Ltd.
- 11.2.14.1. Overview
- 11.2.14.2. Products
- 11.2.14.3. SWOT Analysis
- 11.2.14.4. Recent Developments
- 11.2.14.5. Financials (Based on Availability)
- 11.2.15 CapRock Global Solutions
- 11.2.15.1. Overview
- 11.2.15.2. Products
- 11.2.15.3. SWOT Analysis
- 11.2.15.4. Recent Developments
- 11.2.15.5. Financials (Based on Availability)
- 11.2.16 AGI
- 11.2.16.1. Overview
- 11.2.16.2. Products
- 11.2.16.3. SWOT Analysis
- 11.2.16.4. Recent Developments
- 11.2.16.5. Financials (Based on Availability)
- 11.2.17 Pearl Advisory Group (PAG)
- 11.2.17.1. Overview
- 11.2.17.2. Products
- 11.2.17.3. SWOT Analysis
- 11.2.17.4. Recent Developments
- 11.2.17.5. Financials (Based on Availability)
- 11.2.1 Ricardo
List of Figures
- Figure 1: Global Operations Assessment and Improvement Revenue Breakdown (million, %) by Region 2024 & 2032
- Figure 2: North America Operations Assessment and Improvement Revenue (million), by Application 2024 & 2032
- Figure 3: North America Operations Assessment and Improvement Revenue Share (%), by Application 2024 & 2032
- Figure 4: North America Operations Assessment and Improvement Revenue (million), by Types 2024 & 2032
- Figure 5: North America Operations Assessment and Improvement Revenue Share (%), by Types 2024 & 2032
- Figure 6: North America Operations Assessment and Improvement Revenue (million), by Country 2024 & 2032
- Figure 7: North America Operations Assessment and Improvement Revenue Share (%), by Country 2024 & 2032
- Figure 8: South America Operations Assessment and Improvement Revenue (million), by Application 2024 & 2032
- Figure 9: South America Operations Assessment and Improvement Revenue Share (%), by Application 2024 & 2032
- Figure 10: South America Operations Assessment and Improvement Revenue (million), by Types 2024 & 2032
- Figure 11: South America Operations Assessment and Improvement Revenue Share (%), by Types 2024 & 2032
- Figure 12: South America Operations Assessment and Improvement Revenue (million), by Country 2024 & 2032
- Figure 13: South America Operations Assessment and Improvement Revenue Share (%), by Country 2024 & 2032
- Figure 14: Europe Operations Assessment and Improvement Revenue (million), by Application 2024 & 2032
- Figure 15: Europe Operations Assessment and Improvement Revenue Share (%), by Application 2024 & 2032
- Figure 16: Europe Operations Assessment and Improvement Revenue (million), by Types 2024 & 2032
- Figure 17: Europe Operations Assessment and Improvement Revenue Share (%), by Types 2024 & 2032
- Figure 18: Europe Operations Assessment and Improvement Revenue (million), by Country 2024 & 2032
- Figure 19: Europe Operations Assessment and Improvement Revenue Share (%), by Country 2024 & 2032
- Figure 20: Middle East & Africa Operations Assessment and Improvement Revenue (million), by Application 2024 & 2032
- Figure 21: Middle East & Africa Operations Assessment and Improvement Revenue Share (%), by Application 2024 & 2032
- Figure 22: Middle East & Africa Operations Assessment and Improvement Revenue (million), by Types 2024 & 2032
- Figure 23: Middle East & Africa Operations Assessment and Improvement Revenue Share (%), by Types 2024 & 2032
- Figure 24: Middle East & Africa Operations Assessment and Improvement Revenue (million), by Country 2024 & 2032
- Figure 25: Middle East & Africa Operations Assessment and Improvement Revenue Share (%), by Country 2024 & 2032
- Figure 26: Asia Pacific Operations Assessment and Improvement Revenue (million), by Application 2024 & 2032
- Figure 27: Asia Pacific Operations Assessment and Improvement Revenue Share (%), by Application 2024 & 2032
- Figure 28: Asia Pacific Operations Assessment and Improvement Revenue (million), by Types 2024 & 2032
- Figure 29: Asia Pacific Operations Assessment and Improvement Revenue Share (%), by Types 2024 & 2032
- Figure 30: Asia Pacific Operations Assessment and Improvement Revenue (million), by Country 2024 & 2032
- Figure 31: Asia Pacific Operations Assessment and Improvement Revenue Share (%), by Country 2024 & 2032
List of Tables
- Table 1: Global Operations Assessment and Improvement Revenue million Forecast, by Region 2019 & 2032
- Table 2: Global Operations Assessment and Improvement Revenue million Forecast, by Application 2019 & 2032
- Table 3: Global Operations Assessment and Improvement Revenue million Forecast, by Types 2019 & 2032
- Table 4: Global Operations Assessment and Improvement Revenue million Forecast, by Region 2019 & 2032
- Table 5: Global Operations Assessment and Improvement Revenue million Forecast, by Application 2019 & 2032
- Table 6: Global Operations Assessment and Improvement Revenue million Forecast, by Types 2019 & 2032
- Table 7: Global Operations Assessment and Improvement Revenue million Forecast, by Country 2019 & 2032
- Table 8: United States Operations Assessment and Improvement Revenue (million) Forecast, by Application 2019 & 2032
- Table 9: Canada Operations Assessment and Improvement Revenue (million) Forecast, by Application 2019 & 2032
- Table 10: Mexico Operations Assessment and Improvement Revenue (million) Forecast, by Application 2019 & 2032
- Table 11: Global Operations Assessment and Improvement Revenue million Forecast, by Application 2019 & 2032
- Table 12: Global Operations Assessment and Improvement Revenue million Forecast, by Types 2019 & 2032
- Table 13: Global Operations Assessment and Improvement Revenue million Forecast, by Country 2019 & 2032
- Table 14: Brazil Operations Assessment and Improvement Revenue (million) Forecast, by Application 2019 & 2032
- Table 15: Argentina Operations Assessment and Improvement Revenue (million) Forecast, by Application 2019 & 2032
- Table 16: Rest of South America Operations Assessment and Improvement Revenue (million) Forecast, by Application 2019 & 2032
- Table 17: Global Operations Assessment and Improvement Revenue million Forecast, by Application 2019 & 2032
- Table 18: Global Operations Assessment and Improvement Revenue million Forecast, by Types 2019 & 2032
- Table 19: Global Operations Assessment and Improvement Revenue million Forecast, by Country 2019 & 2032
- Table 20: United Kingdom Operations Assessment and Improvement Revenue (million) Forecast, by Application 2019 & 2032
- Table 21: Germany Operations Assessment and Improvement Revenue (million) Forecast, by Application 2019 & 2032
- Table 22: France Operations Assessment and Improvement Revenue (million) Forecast, by Application 2019 & 2032
- Table 23: Italy Operations Assessment and Improvement Revenue (million) Forecast, by Application 2019 & 2032
- Table 24: Spain Operations Assessment and Improvement Revenue (million) Forecast, by Application 2019 & 2032
- Table 25: Russia Operations Assessment and Improvement Revenue (million) Forecast, by Application 2019 & 2032
- Table 26: Benelux Operations Assessment and Improvement Revenue (million) Forecast, by Application 2019 & 2032
- Table 27: Nordics Operations Assessment and Improvement Revenue (million) Forecast, by Application 2019 & 2032
- Table 28: Rest of Europe Operations Assessment and Improvement Revenue (million) Forecast, by Application 2019 & 2032
- Table 29: Global Operations Assessment and Improvement Revenue million Forecast, by Application 2019 & 2032
- Table 30: Global Operations Assessment and Improvement Revenue million Forecast, by Types 2019 & 2032
- Table 31: Global Operations Assessment and Improvement Revenue million Forecast, by Country 2019 & 2032
- Table 32: Turkey Operations Assessment and Improvement Revenue (million) Forecast, by Application 2019 & 2032
- Table 33: Israel Operations Assessment and Improvement Revenue (million) Forecast, by Application 2019 & 2032
- Table 34: GCC Operations Assessment and Improvement Revenue (million) Forecast, by Application 2019 & 2032
- Table 35: North Africa Operations Assessment and Improvement Revenue (million) Forecast, by Application 2019 & 2032
- Table 36: South Africa Operations Assessment and Improvement Revenue (million) Forecast, by Application 2019 & 2032
- Table 37: Rest of Middle East & Africa Operations Assessment and Improvement Revenue (million) Forecast, by Application 2019 & 2032
- Table 38: Global Operations Assessment and Improvement Revenue million Forecast, by Application 2019 & 2032
- Table 39: Global Operations Assessment and Improvement Revenue million Forecast, by Types 2019 & 2032
- Table 40: Global Operations Assessment and Improvement Revenue million Forecast, by Country 2019 & 2032
- Table 41: China Operations Assessment and Improvement Revenue (million) Forecast, by Application 2019 & 2032
- Table 42: India Operations Assessment and Improvement Revenue (million) Forecast, by Application 2019 & 2032
- Table 43: Japan Operations Assessment and Improvement Revenue (million) Forecast, by Application 2019 & 2032
- Table 44: South Korea Operations Assessment and Improvement Revenue (million) Forecast, by Application 2019 & 2032
- Table 45: ASEAN Operations Assessment and Improvement Revenue (million) Forecast, by Application 2019 & 2032
- Table 46: Oceania Operations Assessment and Improvement Revenue (million) Forecast, by Application 2019 & 2032
- Table 47: Rest of Asia Pacific Operations Assessment and Improvement Revenue (million) Forecast, by Application 2019 & 2032
Frequently Asked Questions
1. What is the projected Compound Annual Growth Rate (CAGR) of the Operations Assessment and Improvement?
The projected CAGR is approximately XX%.
2. Which companies are prominent players in the Operations Assessment and Improvement?
Key companies in the market include Ricardo, Omnex Inc., Prime, Watermark Insights, LLC, Excellent Operations Consultants (EOC), MITRE Corporation, MGMA, The Productivity Team, Quantre Solutions, S3 Group Inc., Quantre Solutions, Mitsue-Links Co., Ltd., CapRock Global Solutions, AGI, Pearl Advisory Group (PAG).
3. What are the main segments of the Operations Assessment and Improvement?
The market segments include Application, Types.
4. Can you provide details about the market size?
The market size is estimated to be USD XXX million as of 2022.
5. What are some drivers contributing to market growth?
N/A
6. What are the notable trends driving market growth?
N/A
7. Are there any restraints impacting market growth?
N/A
8. Can you provide examples of recent developments in the market?
N/A
9. What pricing options are available for accessing the report?
Pricing options include single-user, multi-user, and enterprise licenses priced at USD 3350.00, USD 5025.00, and USD 6700.00 respectively.
10. Is the market size provided in terms of value or volume?
The market size is provided in terms of value, measured in million.
11. Are there any specific market keywords associated with the report?
Yes, the market keyword associated with the report is "Operations Assessment and Improvement," which aids in identifying and referencing the specific market segment covered.
12. How do I determine which pricing option suits my needs best?
The pricing options vary based on user requirements and access needs. Individual users may opt for single-user licenses, while businesses requiring broader access may choose multi-user or enterprise licenses for cost-effective access to the report.
13. Are there any additional resources or data provided in the Operations Assessment and Improvement report?
While the report offers comprehensive insights, it's advisable to review the specific contents or supplementary materials provided to ascertain if additional resources or data are available.
14. How can I stay updated on further developments or reports in the Operations Assessment and Improvement?
To stay informed about further developments, trends, and reports in the Operations Assessment and Improvement, consider subscribing to industry newsletters, following relevant companies and organizations, or regularly checking reputable industry news sources and publications.
Methodology
Step 1 - Identification of Relevant Samples Size from Population Database


Step 2 - Approaches for Defining Global Market Size (Value, Volume* & Price*)

Note*: In applicable scenarios
Step 3 - Data Sources
Primary Research
- Web Analytics
- Survey Reports
- Research Institute
- Latest Research Reports
- Opinion Leaders
Secondary Research
- Annual Reports
- White Paper
- Latest Press Release
- Industry Association
- Paid Database
- Investor Presentations

Step 4 - Data Triangulation
Involves using different sources of information in order to increase the validity of a study
These sources are likely to be stakeholders in a program - participants, other researchers, program staff, other community members, and so on.
Then we put all data in single framework & apply various statistical tools to find out the dynamic on the market.
During the analysis stage, feedback from the stakeholder groups would be compared to determine areas of agreement as well as areas of divergence
