

Key Insights
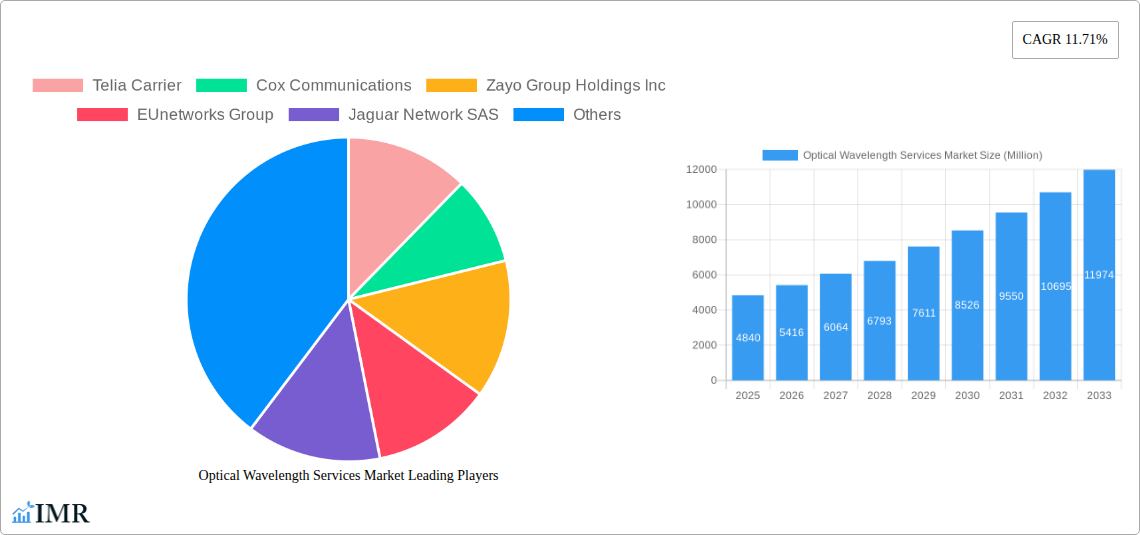
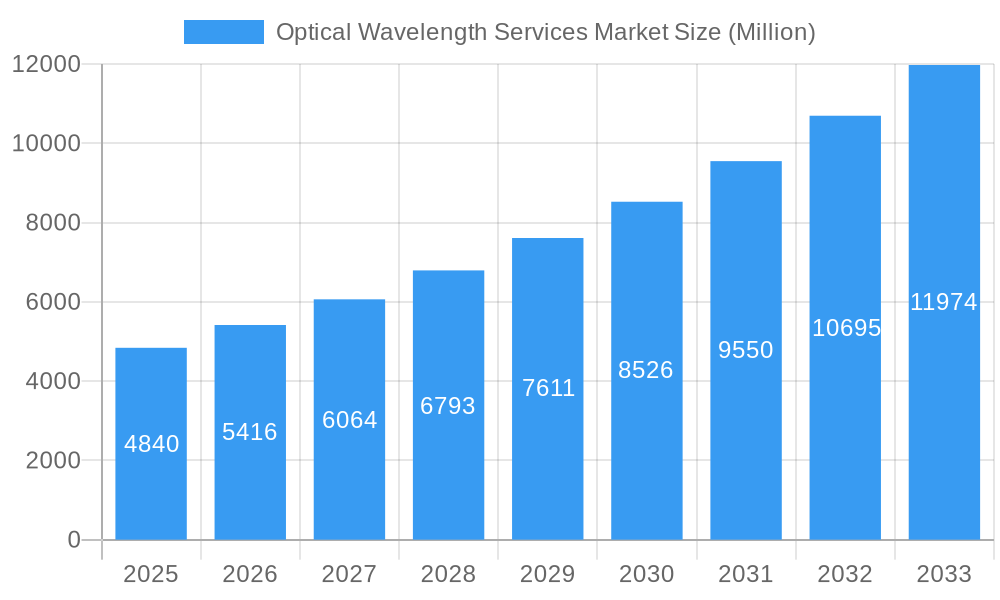
The Optical Wavelength Services market is experiencing robust growth, projected to reach $4.84 billion in 2025 and maintain a Compound Annual Growth Rate (CAGR) of 11.71% from 2025 to 2033. This expansion is fueled by the increasing demand for high-bandwidth connectivity across various sectors, including telecommunications, cloud computing, and enterprises. The surge in data consumption driven by the proliferation of 5G networks, IoT devices, and streaming services is a key driver. Furthermore, the growing adoption of cloud-based applications and the need for low-latency, high-capacity networks are significantly contributing to market growth. The market segmentation by bandwidth (less than 10 Gbps, 40 Gbps, 100 Gbps, and more than 100 Gbps) highlights the diverse needs of different users, with the higher bandwidth segments expected to witness faster growth due to increasing demands for advanced applications. Key players like Telia Carrier, Verizon Communications, and Lumen Technologies are strategically investing in network infrastructure upgrades and expanding their service offerings to capitalize on this market opportunity. Competition is intense, but innovation in areas like coherent optical technology and software-defined networking (SDN) continues to fuel market expansion.
Optical Wavelength Services Market Market Size (In Billion)
Geographic distribution shows a strong presence across North America, Europe, and Asia Pacific. North America, likely benefiting from early adoption of advanced technologies and a robust existing infrastructure, is anticipated to hold a significant market share. However, Asia Pacific is expected to witness the fastest growth due to rapid digitalization and increasing infrastructure investments. While specific regional breakdowns are unavailable, the consistent CAGR suggests a balanced growth across regions, with variations possibly influenced by factors like government regulations, economic development, and digital transformation initiatives. The market is expected to encounter challenges related to the high initial capital investment required for network infrastructure and the need for ongoing maintenance and upgrades. Nevertheless, the long-term prospects remain positive, driven by the ever-increasing need for faster and more reliable data transmission.
Optical Wavelength Services Market Company Market Share
Optical Wavelength Services Market: A Comprehensive Report (2019-2033)
This in-depth report provides a comprehensive analysis of the Optical Wavelength Services Market, encompassing market dynamics, growth trends, regional dominance, product landscape, key players, and future outlook. The study period spans from 2019 to 2033, with 2025 serving as the base and estimated year. The report delves into both the parent market (Telecommunications Services) and the child market (Optical Wavelength Services), offering granular insights for informed decision-making. Projected market size values are presented in Million units.
Optical Wavelength Services Market Market Dynamics & Structure
The Optical Wavelength Services market is characterized by moderate concentration, with a few dominant players holding significant market share. Technological innovation, particularly in higher bandwidth capabilities (400Gbps and beyond), is a key driver. Regulatory frameworks, varying across regions, influence market access and deployment. Competitive substitutes, such as microwave and satellite communication, exert pressure, particularly in niche applications. The end-user demographic spans across enterprises, carriers, and cloud providers, with varying needs and adoption rates. M&A activity has been relatively consistent, with xx deals recorded in the historical period (2019-2024), leading to market consolidation and increased competition among the remaining players. Innovation barriers include high initial investment costs for infrastructure development and the complexity of integrating new technologies into existing networks.
- Market Concentration: Moderately concentrated, with top 5 players holding xx% market share in 2024.
- Technological Innovation: Driven by advancements in 400G and beyond technologies.
- Regulatory Framework: Varies across regions, impacting market access and deployment strategies.
- Competitive Substitutes: Microwave and satellite communication technologies.
- End-User Demographics: Enterprises, carriers, and cloud providers.
- M&A Activity: xx deals in 2019-2024, resulting in market consolidation.
Optical Wavelength Services Market Growth Trends & Insights
The Optical Wavelength Services market experienced steady growth during the historical period (2019-2024), with a CAGR of xx%. This growth is primarily driven by increasing bandwidth demands fueled by cloud computing, video streaming, and the Internet of Things (IoT). The market is expected to continue its expansion during the forecast period (2025-2033), with a projected CAGR of xx%. This growth is further fueled by the adoption of 400G and higher bandwidth technologies and the increasing need for high-capacity, low-latency networks. Market penetration remains relatively high in developed regions, with significant growth potential in emerging markets. Technological disruptions, such as the deployment of coherent optical technology, are enhancing network efficiency and capacity. Consumer behavior shifts towards increased digital consumption are further driving market demand. The transition towards software-defined networking (SDN) and network function virtualization (NFV) are also shaping market dynamics.
Dominant Regions, Countries, or Segments in Optical Wavelength Services Market
North America currently holds the largest market share in the Optical Wavelength Services market, driven by robust infrastructure investments and high demand from major cloud providers and enterprises. Europe follows as a significant market, with considerable growth potential in Eastern Europe. Asia-Pacific is also a rapidly growing region due to increasing digitalization and infrastructure development. Within bandwidth segments, the "More Than 100 Gbps" segment is experiencing the fastest growth, driven by the increasing adoption of high-bandwidth applications. The 40 Gbps segment maintains a strong market presence due to established infrastructure and cost-effectiveness for certain applications.
- North America: Strong infrastructure, high demand from cloud providers, and advanced technology adoption.
- Europe: Significant market size, with growth potential in Eastern Europe.
- Asia-Pacific: Rapid growth driven by increasing digitalization and infrastructure investments.
- Bandwidth Segments: "More Than 100 Gbps" showing fastest growth, followed by 40 Gbps and 100 Gbps.
Optical Wavelength Services Market Product Landscape
The Optical Wavelength Services market offers a range of products catering to different bandwidth requirements and applications. Products are differentiated by features such as wavelength capacity, transmission distance, and network management capabilities. Recent innovations focus on improving network efficiency and scalability, including the introduction of 400G and higher bandwidth solutions. These advancements enable higher data transmission speeds and reduced latency, making them suitable for demanding applications such as cloud computing and high-definition video streaming. Unique selling propositions include advanced features such as automated provisioning, flexible scaling options, and enhanced security measures.
Key Drivers, Barriers & Challenges in Optical Wavelength Services Market
Key Drivers: The increasing demand for higher bandwidth driven by cloud computing, video streaming, and IoT; advancements in optical technology enabling higher capacity and longer reach; growing investments in network infrastructure; and government initiatives promoting digitalization are key drivers.
Challenges & Restraints: High initial investment costs for infrastructure development; complexity of integrating new technologies into existing networks; competition from alternative communication technologies; and regulatory hurdles in certain regions. The impact of these challenges is estimated to restrain market growth by xx% during the forecast period.
Emerging Opportunities in Optical Wavelength Services Market
Emerging opportunities include expansion into underserved markets, particularly in developing countries; the development of new applications for high-bandwidth services such as edge computing and augmented reality; and the integration of optical wavelength services with other network technologies such as 5G and SDN. The adoption of innovative business models such as wavelength-as-a-service (WaaS) also presents significant opportunities for growth.
Growth Accelerators in the Optical Wavelength Services Market Industry
Long-term growth will be driven by continued technological advancements, strategic partnerships between network operators and technology providers, and aggressive expansion strategies into new geographic markets. The development of more efficient and cost-effective optical technologies, such as silicon photonics, will play a significant role in driving market growth.
Key Players Shaping the Optical Wavelength Services Market Market
- Telia Carrier
- Cox Communications
- Zayo Group Holdings Inc
- EUnetworks Group
- Jaguar Network SAS
- Charter Communications
- Comcast Corporation
- Exascale Limite
- Verizon Communications Inc
- GTT Communications Inc
- Crown Castle Inc
- CarrierBid Communications
- Colt Technology Services Group Limited
- Nokia Corporation
- Lumen Technologies Inc
- Windstream Holdings Inc
- AT&T Inc
- T-Mobile US Inc
Notable Milestones in Optical Wavelength Services Market Sector
- January 2023: Lumen Technologies launched 400 Gbps wavelength networks across 70 US markets, covering 240 data centers with over 50 TB of 400G wavelengths. This significantly enhances high-bandwidth capacity in the US market.
- October 2022: LOGIX Fiber Networks and Ciena jointly launched 100G wavelength services, boosting enterprise and carrier access to high-speed networking solutions. This caters to the growing demand driven by cloud adoption and content consumption.
In-Depth Optical Wavelength Services Market Market Outlook
The future of the Optical Wavelength Services market is bright, driven by the continuous rise in bandwidth demand, technological breakthroughs, and strategic market expansion by key players. The market is poised for significant growth, with opportunities for both established players and new entrants. Strategic partnerships, technological innovation, and expansion into emerging markets will be key factors in shaping future market dynamics. The long-term outlook remains positive, with a substantial market potential yet to be realized.
Optical Wavelength Services Market Segmentation
-
1. Bandwidth
- 1.1. Less than 10 Gbps
- 1.2. 40 Gbps
- 1.3. 100 Gbps
- 1.4. More Than 100 Gbps
Optical Wavelength Services Market Segmentation By Geography
- 1. North America
- 2. Europe
- 3. Asia Pacific
- 4. Rest of the World
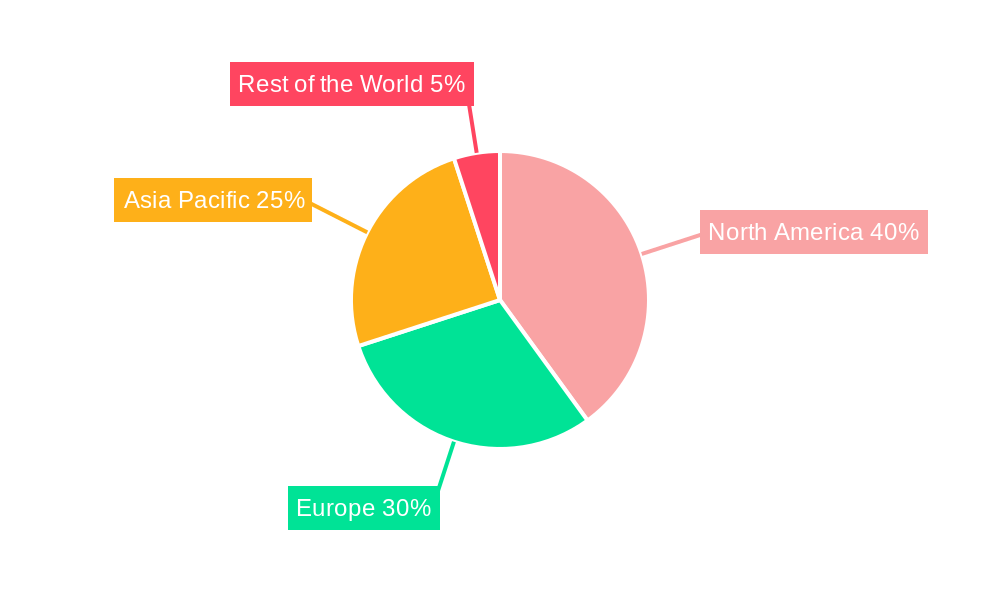
Optical Wavelength Services Market Regional Market Share
Geographic Coverage of Optical Wavelength Services Market
Optical Wavelength Services Market REPORT HIGHLIGHTS
| Aspects | Details |
|---|---|
| Study Period | 2020-2034 |
| Base Year | 2025 |
| Estimated Year | 2026 |
| Forecast Period | 2026-2034 |
| Historical Period | 2020-2025 |
| Growth Rate | CAGR of 11.71% from 2020-2034 |
| Segmentation |
|
Table of Contents
- 1. Introduction
- 1.1. Research Scope
- 1.2. Market Segmentation
- 1.3. Research Objective
- 1.4. Definitions and Assumptions
- 2. Executive Summary
- 2.1. Market Snapshot
- 3. Market Dynamics
- 3.1. Market Drivers
- 3.2. Market Restrains
- 3.3. Market Trends
- 3.4. Market Opportunities
- 4. Market Factor Analysis
- 4.1. Porters Five Forces
- 4.1.1. Bargaining Power of Suppliers
- 4.1.2. Bargaining Power of Buyers
- 4.1.3. Threat of New Entrants
- 4.1.4. Threat of Substitutes
- 4.1.5. Competitive Rivalry
- 4.2. PESTEL analysis
- 4.3. BCG Analysis
- 4.3.1. Stars (High Growth, High Market Share)
- 4.3.2. Cash Cows (Low Growth, High Market Share)
- 4.3.3. Question Mark (High Growth, Low Market Share)
- 4.3.4. Dogs (Low Growth, Low Market Share)
- 4.4. Ansoff Matrix Analysis
- 4.5. Supply Chain Analysis
- 4.6. Regulatory Landscape
- 4.7. Current Market Potential and Opportunity Assessment (TAM–SAM–SOM Framework)
- 4.8. IMR Analyst Note
- 4.1. Porters Five Forces
- 5. Market Analysis, Insights and Forecast 2021-2033
- 5.1. Market Analysis, Insights and Forecast - by Bandwidth
- 5.1.1. Less than 10 Gbps
- 5.1.2. 40 Gbps
- 5.1.3. 100 Gbps
- 5.1.4. More Than 100 Gbps
- 5.2. Market Analysis, Insights and Forecast - by Region
- 5.2.1. North America
- 5.2.2. Europe
- 5.2.3. Asia Pacific
- 5.2.4. Rest of the World
- 5.1. Market Analysis, Insights and Forecast - by Bandwidth
- 6. Global Optical Wavelength Services Market Analysis, Insights and Forecast, 2021-2033
- 6.1. Market Analysis, Insights and Forecast - by Bandwidth
- 6.1.1. Less than 10 Gbps
- 6.1.2. 40 Gbps
- 6.1.3. 100 Gbps
- 6.1.4. More Than 100 Gbps
- 6.1. Market Analysis, Insights and Forecast - by Bandwidth
- 7. North America Optical Wavelength Services Market Analysis, Insights and Forecast, 2020-2032
- 7.1. Market Analysis, Insights and Forecast - by Bandwidth
- 7.1.1. Less than 10 Gbps
- 7.1.2. 40 Gbps
- 7.1.3. 100 Gbps
- 7.1.4. More Than 100 Gbps
- 7.1. Market Analysis, Insights and Forecast - by Bandwidth
- 8. Europe Optical Wavelength Services Market Analysis, Insights and Forecast, 2020-2032
- 8.1. Market Analysis, Insights and Forecast - by Bandwidth
- 8.1.1. Less than 10 Gbps
- 8.1.2. 40 Gbps
- 8.1.3. 100 Gbps
- 8.1.4. More Than 100 Gbps
- 8.1. Market Analysis, Insights and Forecast - by Bandwidth
- 9. Asia Pacific Optical Wavelength Services Market Analysis, Insights and Forecast, 2020-2032
- 9.1. Market Analysis, Insights and Forecast - by Bandwidth
- 9.1.1. Less than 10 Gbps
- 9.1.2. 40 Gbps
- 9.1.3. 100 Gbps
- 9.1.4. More Than 100 Gbps
- 9.1. Market Analysis, Insights and Forecast - by Bandwidth
- 10. Rest of the World Optical Wavelength Services Market Analysis, Insights and Forecast, 2020-2032
- 10.1. Market Analysis, Insights and Forecast - by Bandwidth
- 10.1.1. Less than 10 Gbps
- 10.1.2. 40 Gbps
- 10.1.3. 100 Gbps
- 10.1.4. More Than 100 Gbps
- 10.1. Market Analysis, Insights and Forecast - by Bandwidth
- 11. Competitive Analysis
- 11.1. Company Profiles
- 11.1.1 Telia Carrier
- 11.1.1.1. Company Overview
- 11.1.1.2. Products
- 11.1.1.3. Company Financials
- 11.1.1.4. SWOT Analysis
- 11.1.2 Cox Communications
- 11.1.2.1. Company Overview
- 11.1.2.2. Products
- 11.1.2.3. Company Financials
- 11.1.2.4. SWOT Analysis
- 11.1.3 Zayo Group Holdings Inc
- 11.1.3.1. Company Overview
- 11.1.3.2. Products
- 11.1.3.3. Company Financials
- 11.1.3.4. SWOT Analysis
- 11.1.4 EUnetworks Group
- 11.1.4.1. Company Overview
- 11.1.4.2. Products
- 11.1.4.3. Company Financials
- 11.1.4.4. SWOT Analysis
- 11.1.5 Jaguar Network SAS
- 11.1.5.1. Company Overview
- 11.1.5.2. Products
- 11.1.5.3. Company Financials
- 11.1.5.4. SWOT Analysis
- 11.1.6 Charter Communications
- 11.1.6.1. Company Overview
- 11.1.6.2. Products
- 11.1.6.3. Company Financials
- 11.1.6.4. SWOT Analysis
- 11.1.7 Comcast Corporation
- 11.1.7.1. Company Overview
- 11.1.7.2. Products
- 11.1.7.3. Company Financials
- 11.1.7.4. SWOT Analysis
- 11.1.8 Exascale Limite
- 11.1.8.1. Company Overview
- 11.1.8.2. Products
- 11.1.8.3. Company Financials
- 11.1.8.4. SWOT Analysis
- 11.1.9 Verizon Communications Inc
- 11.1.9.1. Company Overview
- 11.1.9.2. Products
- 11.1.9.3. Company Financials
- 11.1.9.4. SWOT Analysis
- 11.1.10 GTT Communications Inc
- 11.1.10.1. Company Overview
- 11.1.10.2. Products
- 11.1.10.3. Company Financials
- 11.1.10.4. SWOT Analysis
- 11.1.11 Crown Castle Inc
- 11.1.11.1. Company Overview
- 11.1.11.2. Products
- 11.1.11.3. Company Financials
- 11.1.11.4. SWOT Analysis
- 11.1.12 CarrierBid Communications
- 11.1.12.1. Company Overview
- 11.1.12.2. Products
- 11.1.12.3. Company Financials
- 11.1.12.4. SWOT Analysis
- 11.1.13 Colt Technology Services Group Limited
- 11.1.13.1. Company Overview
- 11.1.13.2. Products
- 11.1.13.3. Company Financials
- 11.1.13.4. SWOT Analysis
- 11.1.14 Nokia Corporation
- 11.1.14.1. Company Overview
- 11.1.14.2. Products
- 11.1.14.3. Company Financials
- 11.1.14.4. SWOT Analysis
- 11.1.15 Lumen Technologies Inc
- 11.1.15.1. Company Overview
- 11.1.15.2. Products
- 11.1.15.3. Company Financials
- 11.1.15.4. SWOT Analysis
- 11.1.16 Windstream Holdings Inc
- 11.1.16.1. Company Overview
- 11.1.16.2. Products
- 11.1.16.3. Company Financials
- 11.1.16.4. SWOT Analysis
- 11.1.17 AT&T Inc
- 11.1.17.1. Company Overview
- 11.1.17.2. Products
- 11.1.17.3. Company Financials
- 11.1.17.4. SWOT Analysis
- 11.1.18 T-Mobile US Inc
- 11.1.18.1. Company Overview
- 11.1.18.2. Products
- 11.1.18.3. Company Financials
- 11.1.18.4. SWOT Analysis
- 11.1.1 Telia Carrier
- 11.2. Market Entropy
- 11.2.1 Company's Key Areas Served
- 11.2.2 Recent Developments
- 11.3. Company Market Share Analysis 2025
- 11.3.1 Top 5 Companies Market Share Analysis
- 11.3.2 Top 3 Companies Market Share Analysis
- 11.4. List of Potential Customers
- 12. Research Methodology
List of Figures
- Figure 1: Global Optical Wavelength Services Market Revenue Breakdown (Million, %) by Region 2025 & 2033
- Figure 2: North America Optical Wavelength Services Market Revenue (Million), by Bandwidth 2025 & 2033
- Figure 3: North America Optical Wavelength Services Market Revenue Share (%), by Bandwidth 2025 & 2033
- Figure 4: North America Optical Wavelength Services Market Revenue (Million), by Country 2025 & 2033
- Figure 5: North America Optical Wavelength Services Market Revenue Share (%), by Country 2025 & 2033
- Figure 6: Europe Optical Wavelength Services Market Revenue (Million), by Bandwidth 2025 & 2033
- Figure 7: Europe Optical Wavelength Services Market Revenue Share (%), by Bandwidth 2025 & 2033
- Figure 8: Europe Optical Wavelength Services Market Revenue (Million), by Country 2025 & 2033
- Figure 9: Europe Optical Wavelength Services Market Revenue Share (%), by Country 2025 & 2033
- Figure 10: Asia Pacific Optical Wavelength Services Market Revenue (Million), by Bandwidth 2025 & 2033
- Figure 11: Asia Pacific Optical Wavelength Services Market Revenue Share (%), by Bandwidth 2025 & 2033
- Figure 12: Asia Pacific Optical Wavelength Services Market Revenue (Million), by Country 2025 & 2033
- Figure 13: Asia Pacific Optical Wavelength Services Market Revenue Share (%), by Country 2025 & 2033
- Figure 14: Rest of the World Optical Wavelength Services Market Revenue (Million), by Bandwidth 2025 & 2033
- Figure 15: Rest of the World Optical Wavelength Services Market Revenue Share (%), by Bandwidth 2025 & 2033
- Figure 16: Rest of the World Optical Wavelength Services Market Revenue (Million), by Country 2025 & 2033
- Figure 17: Rest of the World Optical Wavelength Services Market Revenue Share (%), by Country 2025 & 2033
List of Tables
- Table 1: Global Optical Wavelength Services Market Revenue Million Forecast, by Bandwidth 2020 & 2033
- Table 2: Global Optical Wavelength Services Market Revenue Million Forecast, by Region 2020 & 2033
- Table 3: Global Optical Wavelength Services Market Revenue Million Forecast, by Bandwidth 2020 & 2033
- Table 4: Global Optical Wavelength Services Market Revenue Million Forecast, by Country 2020 & 2033
- Table 5: Global Optical Wavelength Services Market Revenue Million Forecast, by Bandwidth 2020 & 2033
- Table 6: Global Optical Wavelength Services Market Revenue Million Forecast, by Country 2020 & 2033
- Table 7: Global Optical Wavelength Services Market Revenue Million Forecast, by Bandwidth 2020 & 2033
- Table 8: Global Optical Wavelength Services Market Revenue Million Forecast, by Country 2020 & 2033
- Table 9: Global Optical Wavelength Services Market Revenue Million Forecast, by Bandwidth 2020 & 2033
- Table 10: Global Optical Wavelength Services Market Revenue Million Forecast, by Country 2020 & 2033
Frequently Asked Questions
1. What is the projected Compound Annual Growth Rate (CAGR) of the Optical Wavelength Services Market?
The projected CAGR is approximately 11.71%.
2. Which companies are prominent players in the Optical Wavelength Services Market?
Key companies in the market include Telia Carrier, Cox Communications, Zayo Group Holdings Inc, EUnetworks Group, Jaguar Network SAS, Charter Communications, Comcast Corporation, Exascale Limite, Verizon Communications Inc, GTT Communications Inc, Crown Castle Inc, CarrierBid Communications, Colt Technology Services Group Limited, Nokia Corporation, Lumen Technologies Inc, Windstream Holdings Inc, AT&T Inc, T-Mobile US Inc.
3. What are the main segments of the Optical Wavelength Services Market?
The market segments include Bandwidth.
4. Can you provide details about the market size?
The market size is estimated to be USD 4.84 Million as of 2022.
5. What are some drivers contributing to market growth?
Growing Demand for the Internet; Accelerated Bandwidth-intensive Applications.
6. What are the notable trends driving market growth?
Less than 10 Gbps Bandwidth Segment is Expected to Hold Significant Market Share.
7. Are there any restraints impacting market growth?
Limited Availability of Incremental Bandwidth; Increasing Demand for Virtual Connectivity.
8. Can you provide examples of recent developments in the market?
January 2023: Lumen Technologies started distributing 400 Gbps wavelength networks in the United States. The company will serve 70 markets across the country, covering 240 data centers with more than 50 TB of 400 G wavelengths. Additionally, Lumen will provide its clients with a self-service tool that allows them to quote, design, and build their wavelengths across Lumen's North American Network.
9. What pricing options are available for accessing the report?
Pricing options include single-user, multi-user, and enterprise licenses priced at USD 4750, USD 5250, and USD 8750 respectively.
10. Is the market size provided in terms of value or volume?
The market size is provided in terms of value, measured in Million.
11. Are there any specific market keywords associated with the report?
Yes, the market keyword associated with the report is "Optical Wavelength Services Market," which aids in identifying and referencing the specific market segment covered.
12. How do I determine which pricing option suits my needs best?
The pricing options vary based on user requirements and access needs. Individual users may opt for single-user licenses, while businesses requiring broader access may choose multi-user or enterprise licenses for cost-effective access to the report.
13. Are there any additional resources or data provided in the Optical Wavelength Services Market report?
While the report offers comprehensive insights, it's advisable to review the specific contents or supplementary materials provided to ascertain if additional resources or data are available.
14. How can I stay updated on further developments or reports in the Optical Wavelength Services Market?
To stay informed about further developments, trends, and reports in the Optical Wavelength Services Market, consider subscribing to industry newsletters, following relevant companies and organizations, or regularly checking reputable industry news sources and publications.
Methodology
Step 1 - Identification of Relevant Samples Size from Population Database


Step 2 - Approaches for Defining Global Market Size (Value, Volume* & Price*)

Note*: In applicable scenarios
Step 3 - Data Sources
Primary Research
- Web Analytics
- Survey Reports
- Research Institute
- Latest Research Reports
- Opinion Leaders
Secondary Research
- Annual Reports
- White Paper
- Latest Press Release
- Industry Association
- Paid Database
- Investor Presentations

Step 4 - Data Triangulation
Involves using different sources of information in order to increase the validity of a study
These sources are likely to be stakeholders in a program - participants, other researchers, program staff, other community members, and so on.
Then we put all data in single framework & apply various statistical tools to find out the dynamic on the market.
During the analysis stage, feedback from the stakeholder groups would be compared to determine areas of agreement as well as areas of divergence