

Key Insights
The global paint packaging cans market is projected for significant expansion, propelled by escalating demand for paints and coatings across key sectors including construction, automotive, and industrial manufacturing. Growth drivers include rising disposable incomes in emerging economies fostering home improvement and construction, a pronounced shift towards sustainable packaging solutions, and a growing preference for convenient paint packaging formats. Technological innovations in can manufacturing, such as the development of lighter and more durable materials, further bolster market growth. However, volatile raw material prices and stringent environmental regulations present notable challenges. Competitive pressures from alternative packaging materials, like plastic containers, also warrant consideration. The market is segmented by can type (metal, composite), size, and end-use industry, with distinct growth patterns observed across segments. Leading players such as Ball, BWAY Corporation, and Kian Joo Group are actively pursuing innovation, product portfolio expansion, mergers, acquisitions, and strategic partnerships to enhance their competitive positions. The market size is estimated at $9.52 billion in the base year of 2025, with a projected Compound Annual Growth Rate (CAGR) of 12.79% over the forecast period.
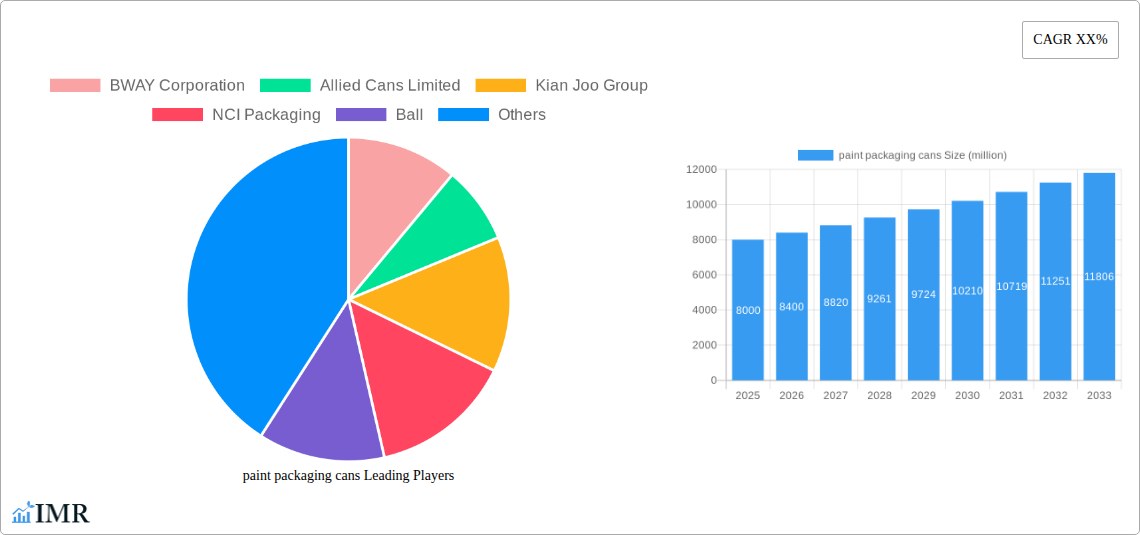
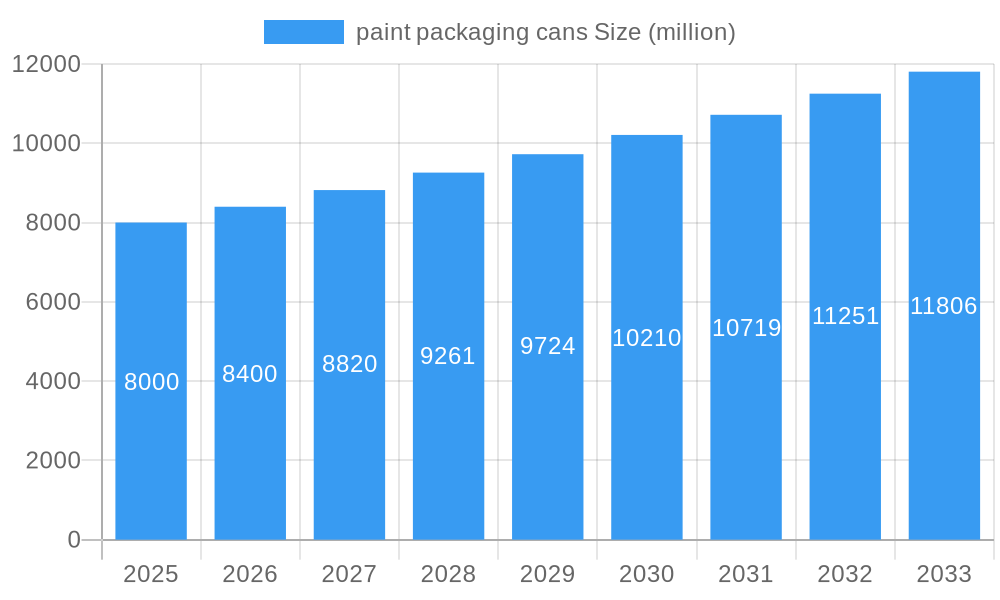
paint packaging cans Market Size (In Billion)
Geographically, North America and Europe currently hold substantial market shares due to high paint consumption. Nevertheless, the Asia-Pacific region is anticipated to experience the most rapid growth, driven by accelerated urbanization and infrastructure development. Future market performance will be influenced by sustained economic growth, evolving consumer preferences for premium paints, and manufacturers' adaptability to regulatory changes. Companies are increasingly emphasizing customized packaging solutions to address specific client needs, thereby deepening market segmentation. This necessitates ongoing innovation in can design, functionality, and sustainability to meet both consumer and environmental imperatives. Long-term forecasts suggest continued market growth, though potential market saturation and economic volatility may lead to a moderation in growth rates towards the latter part of the forecast period.
paint packaging cans Company Market Share
Paint Packaging Cans Market Report: 2019-2033
This comprehensive report provides a detailed analysis of the paint packaging cans market, offering invaluable insights for industry professionals, investors, and strategic decision-makers. The study covers the period from 2019 to 2033, with a focus on the forecast period from 2025 to 2033, using 2025 as the base year. The report analyzes market dynamics, growth trends, regional dominance, product landscape, and key players, providing a holistic understanding of this crucial segment of the packaging industry. The report projects a market size of xx million units by 2033.
Paint Packaging Cans Market Dynamics & Structure
The paint packaging cans market is characterized by moderate concentration, with key players such as BWAY Corporation, Allied Cans Limited, Kian Joo Group, NCI Packaging, Ball Corporation, BCPL, MONTANA-CANS, Seymour of Sycamore, and Allstate Can Corporation holding significant market share. The market's structure is influenced by technological advancements in can manufacturing, stringent regulatory compliance requirements regarding material safety and recyclability, and the emergence of sustainable alternatives. Mergers and acquisitions (M&A) activity has been relatively moderate in recent years, with xx M&A deals recorded between 2019 and 2024.
- Market Concentration: Moderately concentrated, with top 10 players holding approximately xx% market share in 2024.
- Technological Innovation: Focus on lightweighting, improved barrier properties, and sustainable materials (e.g., recycled aluminum and steel). Innovation barriers include high R&D costs and regulatory approvals.
- Regulatory Framework: Stringent regulations regarding material safety, labeling, and recyclability drive innovation and influence material choices.
- Competitive Substitutes: Plastic and flexible packaging pose a competitive threat, though metal cans retain advantages in barrier properties and recyclability.
- End-User Demographics: Primarily driven by professional and DIY paint manufacturers and distributors. Growing demand in developing economies significantly impacts market growth.
- M&A Trends: Consolidation is expected to continue, driven by economies of scale and expansion into new markets.
Paint Packaging Cans Growth Trends & Insights
The global paint packaging cans market experienced a CAGR of xx% during the historical period (2019-2024), reaching xx million units in 2024. This growth is fueled by the increasing demand for paints and coatings across various end-use sectors, including residential, commercial, and industrial construction. Technological advancements, particularly in lightweighting and improved barrier properties, have further enhanced the appeal of metal cans. However, adoption rates are influenced by price fluctuations in raw materials and the growing adoption of sustainable packaging solutions. Consumer preferences are shifting towards eco-friendly and recyclable packaging options, driving innovation in material choices and can design. The market is anticipated to maintain a healthy CAGR of xx% during the forecast period (2025-2033), reaching xx million units by 2033.
Dominant Regions, Countries, or Segments in Paint Packaging Cans
North America and Europe currently dominate the paint packaging cans market, driven by high paint consumption and established infrastructure. However, the Asia-Pacific region exhibits the highest growth potential due to rapid urbanization, infrastructure development, and rising disposable incomes.
- North America: Strong demand from the construction and automotive industries; established manufacturing base.
- Europe: Mature market with high environmental awareness, driving demand for sustainable packaging solutions.
- Asia-Pacific: Fastest-growing region driven by rapid economic growth and infrastructure development; significant potential for market expansion.
- Key Drivers: Rising construction activity, increasing paint consumption, and government initiatives promoting sustainable packaging.
Paint Packaging Cans Product Landscape
The paint packaging cans market offers a range of products, including standard cans, custom-designed cans, and cans with integrated features like easy-open lids and tamper-evident seals. Innovations focus on improved barrier properties to enhance shelf life, lightweighting to reduce material costs and transportation expenses, and incorporating recycled materials to meet sustainability goals. Unique selling propositions often include enhanced durability, improved printability for branding, and compatibility with various paint types. Recent technological advancements include the use of advanced coatings to enhance corrosion resistance and the development of innovative can shapes to optimize filling and transportation efficiencies.
Key Drivers, Barriers & Challenges in Paint Packaging Cans
Key Drivers:
- Increased demand for paints and coatings globally
- Growing construction and infrastructure development
- Rising disposable incomes in emerging economies
- Advancements in can manufacturing technologies
Challenges & Restraints:
- Fluctuations in raw material prices (e.g., steel, aluminum)
- Competition from alternative packaging materials (e.g., plastics)
- Stringent environmental regulations and sustainability concerns
- Supply chain disruptions impacting timely delivery and availability. These disruptions have led to a xx% increase in lead times for some manufacturers in 2024.
Emerging Opportunities in Paint Packaging Cans
Emerging opportunities include:
- Growing demand for eco-friendly and sustainable packaging options.
- Expansion into untapped markets in developing countries.
- Development of innovative can designs and features (e.g., smart packaging).
- Customized packaging solutions tailored to specific customer needs.
Growth Accelerators in the Paint Packaging Cans Industry
Long-term growth will be accelerated by technological innovations focusing on lightweighting and sustainable materials, strategic partnerships between can manufacturers and paint producers, and expanding into high-growth markets. The adoption of advanced manufacturing processes, such as high-speed can-making lines, will further contribute to increased efficiency and reduced production costs. Furthermore, efforts to improve supply chain resilience and optimize logistics will play a crucial role in sustaining market expansion.
Key Players Shaping the Paint Packaging Cans Market
- BWAY Corporation
- Allied Cans Limited
- Kian Joo Group
- NCI Packaging
- Ball Corporation
- BCPL
- MONTANA-CANS
- Seymour of Sycamore
- Allstate Can Corporation
Notable Milestones in Paint Packaging Cans Sector
- 2021-Q3: BWAY Corporation launches a new line of lightweight aluminum cans.
- 2022-Q1: Allied Cans Limited invests in a new high-speed can-making line.
- 2023-Q2: Ball Corporation announces a partnership to develop recycled aluminum cans.
- 2024-Q4: Significant increase in demand for sustainable paint packaging solutions reported across the board.
In-Depth Paint Packaging Cans Market Outlook
The paint packaging cans market is poised for continued growth, driven by ongoing infrastructure development, increasing paint consumption, and the adoption of sustainable packaging solutions. Strategic opportunities exist for manufacturers who can leverage technological advancements, optimize their supply chains, and cater to the evolving demands of environmentally conscious consumers. Focus on innovation, sustainability, and efficient manufacturing will be crucial for maintaining a competitive edge in this dynamic market.
paint packaging cans Segmentation
-
1. Application
- 1.1. Chemical
- 1.2. Building
- 1.3. Painting
- 1.4. Others
-
2. Types
- 2.1. Metal Paint Cans
- 2.2. Plastic Paint Cans
paint packaging cans Segmentation By Geography
-
1. North America
- 1.1. United States
- 1.2. Canada
- 1.3. Mexico
-
2. South America
- 2.1. Brazil
- 2.2. Argentina
- 2.3. Rest of South America
-
3. Europe
- 3.1. United Kingdom
- 3.2. Germany
- 3.3. France
- 3.4. Italy
- 3.5. Spain
- 3.6. Russia
- 3.7. Benelux
- 3.8. Nordics
- 3.9. Rest of Europe
-
4. Middle East & Africa
- 4.1. Turkey
- 4.2. Israel
- 4.3. GCC
- 4.4. North Africa
- 4.5. South Africa
- 4.6. Rest of Middle East & Africa
-
5. Asia Pacific
- 5.1. China
- 5.2. India
- 5.3. Japan
- 5.4. South Korea
- 5.5. ASEAN
- 5.6. Oceania
- 5.7. Rest of Asia Pacific

paint packaging cans Regional Market Share
Geographic Coverage of paint packaging cans
paint packaging cans REPORT HIGHLIGHTS
| Aspects | Details |
|---|---|
| Study Period | 2020-2034 |
| Base Year | 2025 |
| Estimated Year | 2026 |
| Forecast Period | 2026-2034 |
| Historical Period | 2020-2025 |
| Growth Rate | CAGR of 12.79% from 2020-2034 |
| Segmentation |
|
Table of Contents
- 1. Introduction
- 1.1. Research Scope
- 1.2. Market Segmentation
- 1.3. Research Methodology
- 1.4. Definitions and Assumptions
- 2. Executive Summary
- 2.1. Introduction
- 3. Market Dynamics
- 3.1. Introduction
- 3.2. Market Drivers
- 3.3. Market Restrains
- 3.4. Market Trends
- 4. Market Factor Analysis
- 4.1. Porters Five Forces
- 4.2. Supply/Value Chain
- 4.3. PESTEL analysis
- 4.4. Market Entropy
- 4.5. Patent/Trademark Analysis
- 5. Global paint packaging cans Analysis, Insights and Forecast, 2020-2032
- 5.1. Market Analysis, Insights and Forecast - by Application
- 5.1.1. Chemical
- 5.1.2. Building
- 5.1.3. Painting
- 5.1.4. Others
- 5.2. Market Analysis, Insights and Forecast - by Types
- 5.2.1. Metal Paint Cans
- 5.2.2. Plastic Paint Cans
- 5.3. Market Analysis, Insights and Forecast - by Region
- 5.3.1. North America
- 5.3.2. South America
- 5.3.3. Europe
- 5.3.4. Middle East & Africa
- 5.3.5. Asia Pacific
- 5.1. Market Analysis, Insights and Forecast - by Application
- 6. North America paint packaging cans Analysis, Insights and Forecast, 2020-2032
- 6.1. Market Analysis, Insights and Forecast - by Application
- 6.1.1. Chemical
- 6.1.2. Building
- 6.1.3. Painting
- 6.1.4. Others
- 6.2. Market Analysis, Insights and Forecast - by Types
- 6.2.1. Metal Paint Cans
- 6.2.2. Plastic Paint Cans
- 6.1. Market Analysis, Insights and Forecast - by Application
- 7. South America paint packaging cans Analysis, Insights and Forecast, 2020-2032
- 7.1. Market Analysis, Insights and Forecast - by Application
- 7.1.1. Chemical
- 7.1.2. Building
- 7.1.3. Painting
- 7.1.4. Others
- 7.2. Market Analysis, Insights and Forecast - by Types
- 7.2.1. Metal Paint Cans
- 7.2.2. Plastic Paint Cans
- 7.1. Market Analysis, Insights and Forecast - by Application
- 8. Europe paint packaging cans Analysis, Insights and Forecast, 2020-2032
- 8.1. Market Analysis, Insights and Forecast - by Application
- 8.1.1. Chemical
- 8.1.2. Building
- 8.1.3. Painting
- 8.1.4. Others
- 8.2. Market Analysis, Insights and Forecast - by Types
- 8.2.1. Metal Paint Cans
- 8.2.2. Plastic Paint Cans
- 8.1. Market Analysis, Insights and Forecast - by Application
- 9. Middle East & Africa paint packaging cans Analysis, Insights and Forecast, 2020-2032
- 9.1. Market Analysis, Insights and Forecast - by Application
- 9.1.1. Chemical
- 9.1.2. Building
- 9.1.3. Painting
- 9.1.4. Others
- 9.2. Market Analysis, Insights and Forecast - by Types
- 9.2.1. Metal Paint Cans
- 9.2.2. Plastic Paint Cans
- 9.1. Market Analysis, Insights and Forecast - by Application
- 10. Asia Pacific paint packaging cans Analysis, Insights and Forecast, 2020-2032
- 10.1. Market Analysis, Insights and Forecast - by Application
- 10.1.1. Chemical
- 10.1.2. Building
- 10.1.3. Painting
- 10.1.4. Others
- 10.2. Market Analysis, Insights and Forecast - by Types
- 10.2.1. Metal Paint Cans
- 10.2.2. Plastic Paint Cans
- 10.1. Market Analysis, Insights and Forecast - by Application
- 11. Competitive Analysis
- 11.1. Global Market Share Analysis 2025
- 11.2. Company Profiles
- 11.2.1 BWAY Corporation
- 11.2.1.1. Overview
- 11.2.1.2. Products
- 11.2.1.3. SWOT Analysis
- 11.2.1.4. Recent Developments
- 11.2.1.5. Financials (Based on Availability)
- 11.2.2 Allied Cans Limited
- 11.2.2.1. Overview
- 11.2.2.2. Products
- 11.2.2.3. SWOT Analysis
- 11.2.2.4. Recent Developments
- 11.2.2.5. Financials (Based on Availability)
- 11.2.3 Kian Joo Group
- 11.2.3.1. Overview
- 11.2.3.2. Products
- 11.2.3.3. SWOT Analysis
- 11.2.3.4. Recent Developments
- 11.2.3.5. Financials (Based on Availability)
- 11.2.4 NCI Packaging
- 11.2.4.1. Overview
- 11.2.4.2. Products
- 11.2.4.3. SWOT Analysis
- 11.2.4.4. Recent Developments
- 11.2.4.5. Financials (Based on Availability)
- 11.2.5 Ball
- 11.2.5.1. Overview
- 11.2.5.2. Products
- 11.2.5.3. SWOT Analysis
- 11.2.5.4. Recent Developments
- 11.2.5.5. Financials (Based on Availability)
- 11.2.6 BCPL
- 11.2.6.1. Overview
- 11.2.6.2. Products
- 11.2.6.3. SWOT Analysis
- 11.2.6.4. Recent Developments
- 11.2.6.5. Financials (Based on Availability)
- 11.2.7 MONTANA-CANS
- 11.2.7.1. Overview
- 11.2.7.2. Products
- 11.2.7.3. SWOT Analysis
- 11.2.7.4. Recent Developments
- 11.2.7.5. Financials (Based on Availability)
- 11.2.8 Seymour of Sycamore
- 11.2.8.1. Overview
- 11.2.8.2. Products
- 11.2.8.3. SWOT Analysis
- 11.2.8.4. Recent Developments
- 11.2.8.5. Financials (Based on Availability)
- 11.2.9 Allstate Can Corporation
- 11.2.9.1. Overview
- 11.2.9.2. Products
- 11.2.9.3. SWOT Analysis
- 11.2.9.4. Recent Developments
- 11.2.9.5. Financials (Based on Availability)
- 11.2.1 BWAY Corporation
List of Figures
- Figure 1: Global paint packaging cans Revenue Breakdown (billion, %) by Region 2025 & 2033
- Figure 2: Global paint packaging cans Volume Breakdown (K, %) by Region 2025 & 2033
- Figure 3: North America paint packaging cans Revenue (billion), by Application 2025 & 2033
- Figure 4: North America paint packaging cans Volume (K), by Application 2025 & 2033
- Figure 5: North America paint packaging cans Revenue Share (%), by Application 2025 & 2033
- Figure 6: North America paint packaging cans Volume Share (%), by Application 2025 & 2033
- Figure 7: North America paint packaging cans Revenue (billion), by Types 2025 & 2033
- Figure 8: North America paint packaging cans Volume (K), by Types 2025 & 2033
- Figure 9: North America paint packaging cans Revenue Share (%), by Types 2025 & 2033
- Figure 10: North America paint packaging cans Volume Share (%), by Types 2025 & 2033
- Figure 11: North America paint packaging cans Revenue (billion), by Country 2025 & 2033
- Figure 12: North America paint packaging cans Volume (K), by Country 2025 & 2033
- Figure 13: North America paint packaging cans Revenue Share (%), by Country 2025 & 2033
- Figure 14: North America paint packaging cans Volume Share (%), by Country 2025 & 2033
- Figure 15: South America paint packaging cans Revenue (billion), by Application 2025 & 2033
- Figure 16: South America paint packaging cans Volume (K), by Application 2025 & 2033
- Figure 17: South America paint packaging cans Revenue Share (%), by Application 2025 & 2033
- Figure 18: South America paint packaging cans Volume Share (%), by Application 2025 & 2033
- Figure 19: South America paint packaging cans Revenue (billion), by Types 2025 & 2033
- Figure 20: South America paint packaging cans Volume (K), by Types 2025 & 2033
- Figure 21: South America paint packaging cans Revenue Share (%), by Types 2025 & 2033
- Figure 22: South America paint packaging cans Volume Share (%), by Types 2025 & 2033
- Figure 23: South America paint packaging cans Revenue (billion), by Country 2025 & 2033
- Figure 24: South America paint packaging cans Volume (K), by Country 2025 & 2033
- Figure 25: South America paint packaging cans Revenue Share (%), by Country 2025 & 2033
- Figure 26: South America paint packaging cans Volume Share (%), by Country 2025 & 2033
- Figure 27: Europe paint packaging cans Revenue (billion), by Application 2025 & 2033
- Figure 28: Europe paint packaging cans Volume (K), by Application 2025 & 2033
- Figure 29: Europe paint packaging cans Revenue Share (%), by Application 2025 & 2033
- Figure 30: Europe paint packaging cans Volume Share (%), by Application 2025 & 2033
- Figure 31: Europe paint packaging cans Revenue (billion), by Types 2025 & 2033
- Figure 32: Europe paint packaging cans Volume (K), by Types 2025 & 2033
- Figure 33: Europe paint packaging cans Revenue Share (%), by Types 2025 & 2033
- Figure 34: Europe paint packaging cans Volume Share (%), by Types 2025 & 2033
- Figure 35: Europe paint packaging cans Revenue (billion), by Country 2025 & 2033
- Figure 36: Europe paint packaging cans Volume (K), by Country 2025 & 2033
- Figure 37: Europe paint packaging cans Revenue Share (%), by Country 2025 & 2033
- Figure 38: Europe paint packaging cans Volume Share (%), by Country 2025 & 2033
- Figure 39: Middle East & Africa paint packaging cans Revenue (billion), by Application 2025 & 2033
- Figure 40: Middle East & Africa paint packaging cans Volume (K), by Application 2025 & 2033
- Figure 41: Middle East & Africa paint packaging cans Revenue Share (%), by Application 2025 & 2033
- Figure 42: Middle East & Africa paint packaging cans Volume Share (%), by Application 2025 & 2033
- Figure 43: Middle East & Africa paint packaging cans Revenue (billion), by Types 2025 & 2033
- Figure 44: Middle East & Africa paint packaging cans Volume (K), by Types 2025 & 2033
- Figure 45: Middle East & Africa paint packaging cans Revenue Share (%), by Types 2025 & 2033
- Figure 46: Middle East & Africa paint packaging cans Volume Share (%), by Types 2025 & 2033
- Figure 47: Middle East & Africa paint packaging cans Revenue (billion), by Country 2025 & 2033
- Figure 48: Middle East & Africa paint packaging cans Volume (K), by Country 2025 & 2033
- Figure 49: Middle East & Africa paint packaging cans Revenue Share (%), by Country 2025 & 2033
- Figure 50: Middle East & Africa paint packaging cans Volume Share (%), by Country 2025 & 2033
- Figure 51: Asia Pacific paint packaging cans Revenue (billion), by Application 2025 & 2033
- Figure 52: Asia Pacific paint packaging cans Volume (K), by Application 2025 & 2033
- Figure 53: Asia Pacific paint packaging cans Revenue Share (%), by Application 2025 & 2033
- Figure 54: Asia Pacific paint packaging cans Volume Share (%), by Application 2025 & 2033
- Figure 55: Asia Pacific paint packaging cans Revenue (billion), by Types 2025 & 2033
- Figure 56: Asia Pacific paint packaging cans Volume (K), by Types 2025 & 2033
- Figure 57: Asia Pacific paint packaging cans Revenue Share (%), by Types 2025 & 2033
- Figure 58: Asia Pacific paint packaging cans Volume Share (%), by Types 2025 & 2033
- Figure 59: Asia Pacific paint packaging cans Revenue (billion), by Country 2025 & 2033
- Figure 60: Asia Pacific paint packaging cans Volume (K), by Country 2025 & 2033
- Figure 61: Asia Pacific paint packaging cans Revenue Share (%), by Country 2025 & 2033
- Figure 62: Asia Pacific paint packaging cans Volume Share (%), by Country 2025 & 2033
List of Tables
- Table 1: Global paint packaging cans Revenue billion Forecast, by Application 2020 & 2033
- Table 2: Global paint packaging cans Volume K Forecast, by Application 2020 & 2033
- Table 3: Global paint packaging cans Revenue billion Forecast, by Types 2020 & 2033
- Table 4: Global paint packaging cans Volume K Forecast, by Types 2020 & 2033
- Table 5: Global paint packaging cans Revenue billion Forecast, by Region 2020 & 2033
- Table 6: Global paint packaging cans Volume K Forecast, by Region 2020 & 2033
- Table 7: Global paint packaging cans Revenue billion Forecast, by Application 2020 & 2033
- Table 8: Global paint packaging cans Volume K Forecast, by Application 2020 & 2033
- Table 9: Global paint packaging cans Revenue billion Forecast, by Types 2020 & 2033
- Table 10: Global paint packaging cans Volume K Forecast, by Types 2020 & 2033
- Table 11: Global paint packaging cans Revenue billion Forecast, by Country 2020 & 2033
- Table 12: Global paint packaging cans Volume K Forecast, by Country 2020 & 2033
- Table 13: United States paint packaging cans Revenue (billion) Forecast, by Application 2020 & 2033
- Table 14: United States paint packaging cans Volume (K) Forecast, by Application 2020 & 2033
- Table 15: Canada paint packaging cans Revenue (billion) Forecast, by Application 2020 & 2033
- Table 16: Canada paint packaging cans Volume (K) Forecast, by Application 2020 & 2033
- Table 17: Mexico paint packaging cans Revenue (billion) Forecast, by Application 2020 & 2033
- Table 18: Mexico paint packaging cans Volume (K) Forecast, by Application 2020 & 2033
- Table 19: Global paint packaging cans Revenue billion Forecast, by Application 2020 & 2033
- Table 20: Global paint packaging cans Volume K Forecast, by Application 2020 & 2033
- Table 21: Global paint packaging cans Revenue billion Forecast, by Types 2020 & 2033
- Table 22: Global paint packaging cans Volume K Forecast, by Types 2020 & 2033
- Table 23: Global paint packaging cans Revenue billion Forecast, by Country 2020 & 2033
- Table 24: Global paint packaging cans Volume K Forecast, by Country 2020 & 2033
- Table 25: Brazil paint packaging cans Revenue (billion) Forecast, by Application 2020 & 2033
- Table 26: Brazil paint packaging cans Volume (K) Forecast, by Application 2020 & 2033
- Table 27: Argentina paint packaging cans Revenue (billion) Forecast, by Application 2020 & 2033
- Table 28: Argentina paint packaging cans Volume (K) Forecast, by Application 2020 & 2033
- Table 29: Rest of South America paint packaging cans Revenue (billion) Forecast, by Application 2020 & 2033
- Table 30: Rest of South America paint packaging cans Volume (K) Forecast, by Application 2020 & 2033
- Table 31: Global paint packaging cans Revenue billion Forecast, by Application 2020 & 2033
- Table 32: Global paint packaging cans Volume K Forecast, by Application 2020 & 2033
- Table 33: Global paint packaging cans Revenue billion Forecast, by Types 2020 & 2033
- Table 34: Global paint packaging cans Volume K Forecast, by Types 2020 & 2033
- Table 35: Global paint packaging cans Revenue billion Forecast, by Country 2020 & 2033
- Table 36: Global paint packaging cans Volume K Forecast, by Country 2020 & 2033
- Table 37: United Kingdom paint packaging cans Revenue (billion) Forecast, by Application 2020 & 2033
- Table 38: United Kingdom paint packaging cans Volume (K) Forecast, by Application 2020 & 2033
- Table 39: Germany paint packaging cans Revenue (billion) Forecast, by Application 2020 & 2033
- Table 40: Germany paint packaging cans Volume (K) Forecast, by Application 2020 & 2033
- Table 41: France paint packaging cans Revenue (billion) Forecast, by Application 2020 & 2033
- Table 42: France paint packaging cans Volume (K) Forecast, by Application 2020 & 2033
- Table 43: Italy paint packaging cans Revenue (billion) Forecast, by Application 2020 & 2033
- Table 44: Italy paint packaging cans Volume (K) Forecast, by Application 2020 & 2033
- Table 45: Spain paint packaging cans Revenue (billion) Forecast, by Application 2020 & 2033
- Table 46: Spain paint packaging cans Volume (K) Forecast, by Application 2020 & 2033
- Table 47: Russia paint packaging cans Revenue (billion) Forecast, by Application 2020 & 2033
- Table 48: Russia paint packaging cans Volume (K) Forecast, by Application 2020 & 2033
- Table 49: Benelux paint packaging cans Revenue (billion) Forecast, by Application 2020 & 2033
- Table 50: Benelux paint packaging cans Volume (K) Forecast, by Application 2020 & 2033
- Table 51: Nordics paint packaging cans Revenue (billion) Forecast, by Application 2020 & 2033
- Table 52: Nordics paint packaging cans Volume (K) Forecast, by Application 2020 & 2033
- Table 53: Rest of Europe paint packaging cans Revenue (billion) Forecast, by Application 2020 & 2033
- Table 54: Rest of Europe paint packaging cans Volume (K) Forecast, by Application 2020 & 2033
- Table 55: Global paint packaging cans Revenue billion Forecast, by Application 2020 & 2033
- Table 56: Global paint packaging cans Volume K Forecast, by Application 2020 & 2033
- Table 57: Global paint packaging cans Revenue billion Forecast, by Types 2020 & 2033
- Table 58: Global paint packaging cans Volume K Forecast, by Types 2020 & 2033
- Table 59: Global paint packaging cans Revenue billion Forecast, by Country 2020 & 2033
- Table 60: Global paint packaging cans Volume K Forecast, by Country 2020 & 2033
- Table 61: Turkey paint packaging cans Revenue (billion) Forecast, by Application 2020 & 2033
- Table 62: Turkey paint packaging cans Volume (K) Forecast, by Application 2020 & 2033
- Table 63: Israel paint packaging cans Revenue (billion) Forecast, by Application 2020 & 2033
- Table 64: Israel paint packaging cans Volume (K) Forecast, by Application 2020 & 2033
- Table 65: GCC paint packaging cans Revenue (billion) Forecast, by Application 2020 & 2033
- Table 66: GCC paint packaging cans Volume (K) Forecast, by Application 2020 & 2033
- Table 67: North Africa paint packaging cans Revenue (billion) Forecast, by Application 2020 & 2033
- Table 68: North Africa paint packaging cans Volume (K) Forecast, by Application 2020 & 2033
- Table 69: South Africa paint packaging cans Revenue (billion) Forecast, by Application 2020 & 2033
- Table 70: South Africa paint packaging cans Volume (K) Forecast, by Application 2020 & 2033
- Table 71: Rest of Middle East & Africa paint packaging cans Revenue (billion) Forecast, by Application 2020 & 2033
- Table 72: Rest of Middle East & Africa paint packaging cans Volume (K) Forecast, by Application 2020 & 2033
- Table 73: Global paint packaging cans Revenue billion Forecast, by Application 2020 & 2033
- Table 74: Global paint packaging cans Volume K Forecast, by Application 2020 & 2033
- Table 75: Global paint packaging cans Revenue billion Forecast, by Types 2020 & 2033
- Table 76: Global paint packaging cans Volume K Forecast, by Types 2020 & 2033
- Table 77: Global paint packaging cans Revenue billion Forecast, by Country 2020 & 2033
- Table 78: Global paint packaging cans Volume K Forecast, by Country 2020 & 2033
- Table 79: China paint packaging cans Revenue (billion) Forecast, by Application 2020 & 2033
- Table 80: China paint packaging cans Volume (K) Forecast, by Application 2020 & 2033
- Table 81: India paint packaging cans Revenue (billion) Forecast, by Application 2020 & 2033
- Table 82: India paint packaging cans Volume (K) Forecast, by Application 2020 & 2033
- Table 83: Japan paint packaging cans Revenue (billion) Forecast, by Application 2020 & 2033
- Table 84: Japan paint packaging cans Volume (K) Forecast, by Application 2020 & 2033
- Table 85: South Korea paint packaging cans Revenue (billion) Forecast, by Application 2020 & 2033
- Table 86: South Korea paint packaging cans Volume (K) Forecast, by Application 2020 & 2033
- Table 87: ASEAN paint packaging cans Revenue (billion) Forecast, by Application 2020 & 2033
- Table 88: ASEAN paint packaging cans Volume (K) Forecast, by Application 2020 & 2033
- Table 89: Oceania paint packaging cans Revenue (billion) Forecast, by Application 2020 & 2033
- Table 90: Oceania paint packaging cans Volume (K) Forecast, by Application 2020 & 2033
- Table 91: Rest of Asia Pacific paint packaging cans Revenue (billion) Forecast, by Application 2020 & 2033
- Table 92: Rest of Asia Pacific paint packaging cans Volume (K) Forecast, by Application 2020 & 2033
Frequently Asked Questions
1. What is the projected Compound Annual Growth Rate (CAGR) of the paint packaging cans?
The projected CAGR is approximately 12.79%.
2. Which companies are prominent players in the paint packaging cans?
Key companies in the market include BWAY Corporation, Allied Cans Limited, Kian Joo Group, NCI Packaging, Ball, BCPL, MONTANA-CANS, Seymour of Sycamore, Allstate Can Corporation.
3. What are the main segments of the paint packaging cans?
The market segments include Application, Types.
4. Can you provide details about the market size?
The market size is estimated to be USD 9.52 billion as of 2022.
5. What are some drivers contributing to market growth?
N/A
6. What are the notable trends driving market growth?
N/A
7. Are there any restraints impacting market growth?
N/A
8. Can you provide examples of recent developments in the market?
N/A
9. What pricing options are available for accessing the report?
Pricing options include single-user, multi-user, and enterprise licenses priced at USD 4350.00, USD 6525.00, and USD 8700.00 respectively.
10. Is the market size provided in terms of value or volume?
The market size is provided in terms of value, measured in billion and volume, measured in K.
11. Are there any specific market keywords associated with the report?
Yes, the market keyword associated with the report is "paint packaging cans," which aids in identifying and referencing the specific market segment covered.
12. How do I determine which pricing option suits my needs best?
The pricing options vary based on user requirements and access needs. Individual users may opt for single-user licenses, while businesses requiring broader access may choose multi-user or enterprise licenses for cost-effective access to the report.
13. Are there any additional resources or data provided in the paint packaging cans report?
While the report offers comprehensive insights, it's advisable to review the specific contents or supplementary materials provided to ascertain if additional resources or data are available.
14. How can I stay updated on further developments or reports in the paint packaging cans?
To stay informed about further developments, trends, and reports in the paint packaging cans, consider subscribing to industry newsletters, following relevant companies and organizations, or regularly checking reputable industry news sources and publications.
Methodology
Step 1 - Identification of Relevant Samples Size from Population Database


Step 2 - Approaches for Defining Global Market Size (Value, Volume* & Price*)

Note*: In applicable scenarios
Step 3 - Data Sources
Primary Research
- Web Analytics
- Survey Reports
- Research Institute
- Latest Research Reports
- Opinion Leaders
Secondary Research
- Annual Reports
- White Paper
- Latest Press Release
- Industry Association
- Paid Database
- Investor Presentations

Step 4 - Data Triangulation
Involves using different sources of information in order to increase the validity of a study
These sources are likely to be stakeholders in a program - participants, other researchers, program staff, other community members, and so on.
Then we put all data in single framework & apply various statistical tools to find out the dynamic on the market.
During the analysis stage, feedback from the stakeholder groups would be compared to determine areas of agreement as well as areas of divergence