

Key Insights
The protective packaging market, valued at $33.92 billion in 2025, is projected to experience robust expansion at a Compound Annual Growth Rate (CAGR) of 4.6% from 2025 to 2033. Key growth drivers include the accelerating demand from e-commerce for secure transit solutions and increasing industry-wide emphasis on product safety and preservation across sectors like food & beverage, pharmaceuticals, and consumer electronics. Growing consumer preference for sustainable packaging options is also a significant trend, spurring innovation in eco-friendly materials such as recycled paper and biodegradable plastics. However, market dynamics are influenced by challenges including volatile raw material prices and evolving environmental regulations. The market is segmented by material type (plastic, paper & paperboard, others), product type (rigid, flexible), and end-user vertical (food & beverage, industrial, pharmaceuticals, consumer electronics, beauty & home care, others). The flexible packaging segment, particularly foil pouches and stretch films, is anticipated to see substantial growth due to its inherent versatility and cost-effectiveness. While North America and Europe currently dominate market share, the Asia-Pacific region is poised for rapid expansion, driven by increasing industrialization and e-commerce penetration.
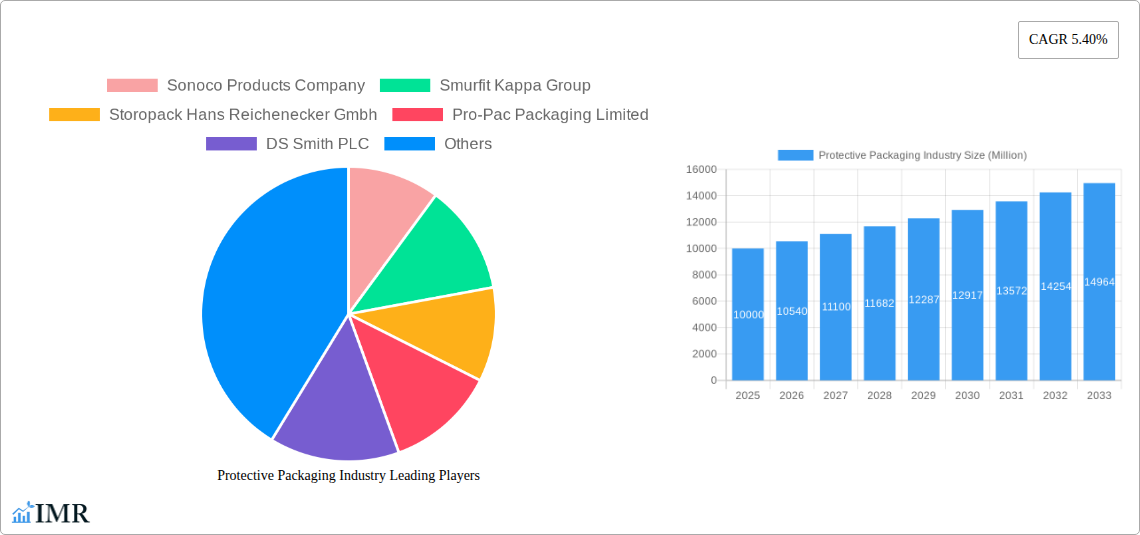
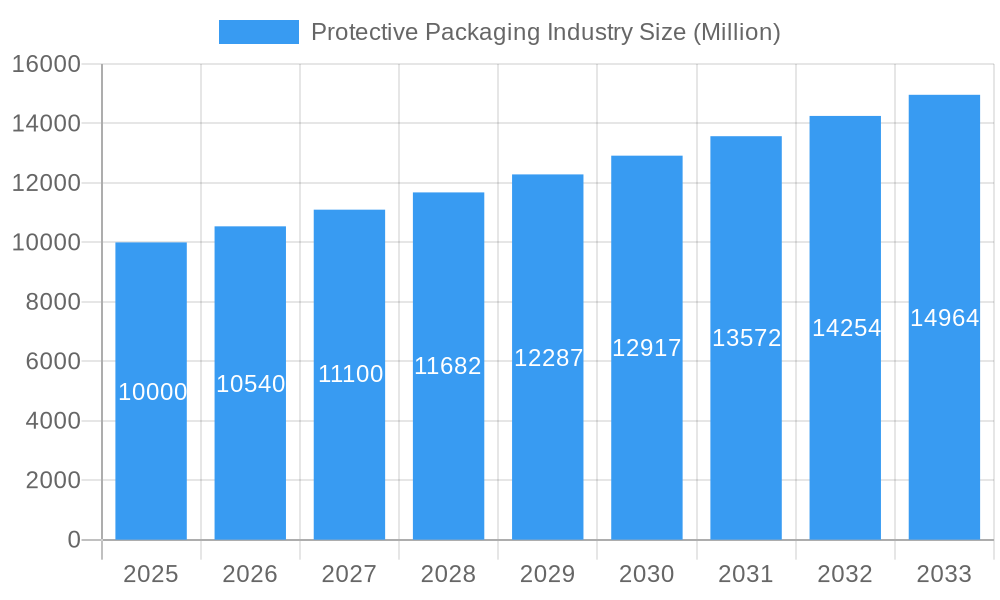
Protective Packaging Industry Market Size (In Billion)
The projected market size for 2033 reflects sustained growth, fueled by e-commerce expansion, stringent quality mandates, and a clear shift towards sustainable packaging solutions. Key industry players, including Sonoco Products Company, Smurfit Kappa Group, and Sealed Air Corporation, are investing in research and development to deliver innovative and sustainable packaging. Future strategies are expected to emphasize customized packaging, enhanced supply chain efficiency, strategic partnerships, and acquisitions to leverage regional market variations and evolving consumer preferences. A continued focus on sustainability and reducing environmental impact will remain a critical determinant of market trends and product development.
Protective Packaging Industry Company Market Share
Protective Packaging Industry Market Report: 2019-2033
This comprehensive report provides a detailed analysis of the global protective packaging industry, covering market dynamics, growth trends, regional dominance, product landscape, key players, and future outlook. The study period spans from 2019 to 2033, with 2025 serving as the base and estimated year. The report leverages extensive primary and secondary research to offer invaluable insights for industry professionals, investors, and strategic decision-makers. This report covers a market valued at xx Million units in 2025, projected to reach xx Million units by 2033.
Protective Packaging Industry Market Dynamics & Structure
The protective packaging market is characterized by a moderately consolidated structure, with several major players holding significant market share. Market concentration is influenced by factors like economies of scale, technological capabilities, and global reach. Key players, including Sonoco Products Company, Smurfit Kappa Group, and Sealed Air Corporation, are actively engaged in mergers and acquisitions (M&A) to expand their market presence and product portfolios. The number of M&A deals in the sector averaged xx per year during the historical period (2019-2024), contributing to market consolidation.
- Market Concentration: The top 5 players hold approximately xx% of the global market share in 2025.
- Technological Innovation: Continuous innovation in materials science (e.g., biodegradable packaging, sustainable alternatives) and automation (e.g., robotic packaging systems) are key drivers. However, high R&D costs and regulatory hurdles pose significant barriers.
- Regulatory Frameworks: Government regulations regarding material recyclability, waste reduction, and product safety significantly influence packaging design and material selection.
- Competitive Product Substitutes: The market faces competition from alternative solutions like reusable packaging systems and improved product designs requiring less protective packaging.
- End-User Demographics: Growth is fueled by expanding e-commerce, increasing consumer demand for convenient packaging, and rising concerns about product safety and preservation.
- M&A Trends: Strategic acquisitions are predominantly driven by expanding product portfolios, accessing new technologies, and broadening geographic reach.
Protective Packaging Industry Growth Trends & Insights
The global protective packaging market experienced significant growth during the historical period (2019-2024), driven by robust demand from various end-user verticals. The market is anticipated to maintain a steady growth trajectory throughout the forecast period (2025-2033), with a projected Compound Annual Growth Rate (CAGR) of xx% from 2025-2033. This growth is fueled by several factors including the expansion of e-commerce, increasing demand for customized packaging solutions and the growing adoption of sustainable packaging materials. Market penetration of eco-friendly options is steadily increasing, driven by evolving consumer preferences and stringent environmental regulations. Technological disruptions, such as the rise of automated packaging solutions, are also contributing to market expansion. Consumer behavior shifts, particularly towards online shopping and subscription models, are further driving demand for protective packaging.
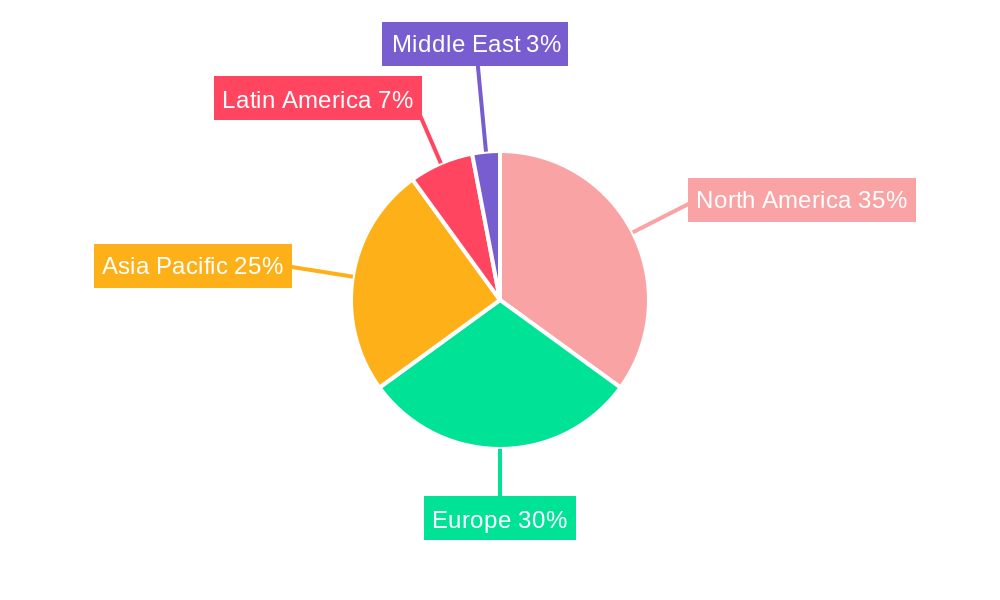
Dominant Regions, Countries, or Segments in Protective Packaging Industry
North America and Europe currently dominate the protective packaging market, driven by high per capita consumption, established supply chains, and stringent regulatory frameworks. However, Asia-Pacific is projected to witness the fastest growth during the forecast period due to rapid industrialization, increasing disposable incomes, and expanding e-commerce sectors.
- By End-user Vertical: The Food and Beverage segment holds the largest market share in 2025 at xx Million units, followed by Industrial and Pharmaceuticals, both showing strong growth potentials.
- By Material Type: Plastic packaging dominates the market with xx Million units in 2025, but Paper and Paperboard are witnessing significant growth due to sustainability concerns.
- By Product Type: Flexible packaging accounts for a larger share (xx Million units in 2025) compared to Rigid packaging due to its versatility and cost-effectiveness in various applications.
- Key Growth Drivers: Strong economic growth in emerging markets, robust e-commerce penetration, and rising demand for customized packaging solutions are major drivers of growth in the Asia-Pacific region.
Protective Packaging Industry Product Landscape
The protective packaging market offers a wide range of products, from rigid containers and corrugated boxes to flexible films and foams. Continuous innovation focuses on enhancing product protection, improving sustainability (e.g., biodegradable materials, recycled content), and increasing efficiency (e.g., lighter-weight designs, automated packaging systems). Unique selling propositions often center on superior cushioning, moisture resistance, and tamper evidence. Technological advancements include the use of smart packaging with integrated sensors to monitor product condition during transit.
Key Drivers, Barriers & Challenges in Protective Packaging Industry
Key Drivers: Rising e-commerce sales, growing consumer demand for product safety and convenience, and increasing focus on sustainable packaging are major drivers. Technological advancements in material science and automation are further propelling market growth.
Key Challenges: Fluctuations in raw material prices, environmental regulations impacting material choices, and intense competition from existing players and new entrants are key challenges. Supply chain disruptions can significantly impact production and delivery times, creating further challenges for manufacturers. The cost of implementing sustainable packaging solutions can also be a barrier for some businesses.
Emerging Opportunities in Protective Packaging Industry
Emerging opportunities include the growth of personalized packaging solutions, increasing demand for eco-friendly and recyclable materials, and expansion into untapped markets. Opportunities also exist in developing innovative applications for smart packaging and integrating technology to enhance traceability and logistics efficiency.
Growth Accelerators in the Protective Packaging Industry Industry
Strategic partnerships between packaging companies and technology providers to develop advanced packaging solutions are significant growth drivers. The expansion of e-commerce and increased consumer spending further accelerate market expansion. Technological breakthroughs, particularly in sustainable materials and automation, play a crucial role in driving market growth.
Key Players Shaping the Protective Packaging Industry Market
- Sonoco Products Company
- Smurfit Kappa Group
- Storopack Hans Reichenecker GmbH
- Pro-Pac Packaging Limited
- DS Smith PLC
- Huhtamaki Group
- Riverside Paper Co
- Pregis Corporation
- International Paper Company
- Signode Protective Packaging Solutions
- Crown Holdings Inc
- Intertape Polymer Group Inc
- Sealed Air Corporation
Notable Milestones in Protective Packaging Industry Sector
- 2020: Sealed Air Corporation launches a new line of sustainable packaging solutions.
- 2021: Smurfit Kappa Group acquires a leading paperboard manufacturer, expanding its production capacity.
- 2022: Sonoco Products Company invests in advanced automation technology for its packaging plants.
- 2023: Increased investment in research and development for biodegradable and compostable packaging materials across the industry. (Specific examples unavailable, but industry trend is evident).
In-Depth Protective Packaging Industry Market Outlook
The future of the protective packaging industry is promising, driven by continuous innovation in materials and technologies, along with the burgeoning e-commerce sector and growing demand for sustainable solutions. Strategic partnerships, investments in R&D, and expansion into new markets will play a crucial role in shaping the industry's future trajectory. Companies that prioritize sustainability, innovation, and efficient supply chain management will be well-positioned to capitalize on the opportunities presented by this dynamic market.
Protective Packaging Industry Segmentation
-
1. Material Type
- 1.1. Plastic
- 1.2. Paper and Paperboard
- 1.3. Other Material Types
-
2. Product
-
2.1. Rigid
- 2.1.1. Corrugated Paperboard Protectors
- 2.1.2. Molded Pulp
- 2.1.3. Insulated Shipping Containers
- 2.1.4. Other Product Types
-
2.2. Flexible
- 2.2.1. Protective Mailers
- 2.2.2. Bubble Wraps
- 2.2.3. Air Pillows/Air Bags
- 2.2.4. Paper Fill
- 2.2.5. Other Fl
-
2.3. Foam
- 2.3.1. Molded Foam
- 2.3.2. Foam in Place (FIP)
- 2.3.3. Loose Fill
- 2.3.4. Foam Rolls/Sheets
- 2.3.5. Other Types of Foam (Corner Blocks, etc.)
-
2.1. Rigid
-
3. End-user Vertical
- 3.1. Food and Beverage
- 3.2. Industrial
- 3.3. Pharmaceuticals
- 3.4. Consumer Electronics
- 3.5. Beauty and Home Care
- 3.6. Other End-user Verticals
Protective Packaging Industry Segmentation By Geography
- 1. North America
- 2. Europe
- 3. Asia Pacific
- 4. Latin America
- 5. Middle East
Protective Packaging Industry Regional Market Share
Geographic Coverage of Protective Packaging Industry
Protective Packaging Industry REPORT HIGHLIGHTS
| Aspects | Details |
|---|---|
| Study Period | 2020-2034 |
| Base Year | 2025 |
| Estimated Year | 2026 |
| Forecast Period | 2026-2034 |
| Historical Period | 2020-2025 |
| Growth Rate | CAGR of 4.6% from 2020-2034 |
| Segmentation |
|
Table of Contents
- 1. Introduction
- 1.1. Research Scope
- 1.2. Market Segmentation
- 1.3. Research Objective
- 1.4. Definitions and Assumptions
- 2. Executive Summary
- 2.1. Market Snapshot
- 3. Market Dynamics
- 3.1. Market Drivers
- 3.2. Market Restrains
- 3.3. Market Trends
- 3.4. Market Opportunities
- 4. Market Factor Analysis
- 4.1. Porters Five Forces
- 4.1.1. Bargaining Power of Suppliers
- 4.1.2. Bargaining Power of Buyers
- 4.1.3. Threat of New Entrants
- 4.1.4. Threat of Substitutes
- 4.1.5. Competitive Rivalry
- 4.2. PESTEL analysis
- 4.3. BCG Analysis
- 4.3.1. Stars (High Growth, High Market Share)
- 4.3.2. Cash Cows (Low Growth, High Market Share)
- 4.3.3. Question Mark (High Growth, Low Market Share)
- 4.3.4. Dogs (Low Growth, Low Market Share)
- 4.4. Ansoff Matrix Analysis
- 4.5. Supply Chain Analysis
- 4.6. Regulatory Landscape
- 4.7. Current Market Potential and Opportunity Assessment (TAM–SAM–SOM Framework)
- 4.8. IMR Analyst Note
- 4.1. Porters Five Forces
- 5. Market Analysis, Insights and Forecast 2021-2033
- 5.1. Market Analysis, Insights and Forecast - by Material Type
- 5.1.1. Plastic
- 5.1.2. Paper and Paperboard
- 5.1.3. Other Material Types
- 5.2. Market Analysis, Insights and Forecast - by Product
- 5.2.1. Rigid
- 5.2.1.1. Corrugated Paperboard Protectors
- 5.2.1.2. Molded Pulp
- 5.2.1.3. Insulated Shipping Containers
- 5.2.1.4. Other Product Types
- 5.2.2. Flexible
- 5.2.2.1. Protective Mailers
- 5.2.2.2. Bubble Wraps
- 5.2.2.3. Air Pillows/Air Bags
- 5.2.2.4. Paper Fill
- 5.2.2.5. Other Fl
- 5.2.3. Foam
- 5.2.3.1. Molded Foam
- 5.2.3.2. Foam in Place (FIP)
- 5.2.3.3. Loose Fill
- 5.2.3.4. Foam Rolls/Sheets
- 5.2.3.5. Other Types of Foam (Corner Blocks, etc.)
- 5.2.1. Rigid
- 5.3. Market Analysis, Insights and Forecast - by End-user Vertical
- 5.3.1. Food and Beverage
- 5.3.2. Industrial
- 5.3.3. Pharmaceuticals
- 5.3.4. Consumer Electronics
- 5.3.5. Beauty and Home Care
- 5.3.6. Other End-user Verticals
- 5.4. Market Analysis, Insights and Forecast - by Region
- 5.4.1. North America
- 5.4.2. Europe
- 5.4.3. Asia Pacific
- 5.4.4. Latin America
- 5.4.5. Middle East
- 5.1. Market Analysis, Insights and Forecast - by Material Type
- 6. Global Protective Packaging Industry Analysis, Insights and Forecast, 2021-2033
- 6.1. Market Analysis, Insights and Forecast - by Material Type
- 6.1.1. Plastic
- 6.1.2. Paper and Paperboard
- 6.1.3. Other Material Types
- 6.2. Market Analysis, Insights and Forecast - by Product
- 6.2.1. Rigid
- 6.2.1.1. Corrugated Paperboard Protectors
- 6.2.1.2. Molded Pulp
- 6.2.1.3. Insulated Shipping Containers
- 6.2.1.4. Other Product Types
- 6.2.2. Flexible
- 6.2.2.1. Protective Mailers
- 6.2.2.2. Bubble Wraps
- 6.2.2.3. Air Pillows/Air Bags
- 6.2.2.4. Paper Fill
- 6.2.2.5. Other Fl
- 6.2.3. Foam
- 6.2.3.1. Molded Foam
- 6.2.3.2. Foam in Place (FIP)
- 6.2.3.3. Loose Fill
- 6.2.3.4. Foam Rolls/Sheets
- 6.2.3.5. Other Types of Foam (Corner Blocks, etc.)
- 6.2.1. Rigid
- 6.3. Market Analysis, Insights and Forecast - by End-user Vertical
- 6.3.1. Food and Beverage
- 6.3.2. Industrial
- 6.3.3. Pharmaceuticals
- 6.3.4. Consumer Electronics
- 6.3.5. Beauty and Home Care
- 6.3.6. Other End-user Verticals
- 6.1. Market Analysis, Insights and Forecast - by Material Type
- 7. North America Protective Packaging Industry Analysis, Insights and Forecast, 2020-2032
- 7.1. Market Analysis, Insights and Forecast - by Material Type
- 7.1.1. Plastic
- 7.1.2. Paper and Paperboard
- 7.1.3. Other Material Types
- 7.2. Market Analysis, Insights and Forecast - by Product
- 7.2.1. Rigid
- 7.2.1.1. Corrugated Paperboard Protectors
- 7.2.1.2. Molded Pulp
- 7.2.1.3. Insulated Shipping Containers
- 7.2.1.4. Other Product Types
- 7.2.2. Flexible
- 7.2.2.1. Protective Mailers
- 7.2.2.2. Bubble Wraps
- 7.2.2.3. Air Pillows/Air Bags
- 7.2.2.4. Paper Fill
- 7.2.2.5. Other Fl
- 7.2.3. Foam
- 7.2.3.1. Molded Foam
- 7.2.3.2. Foam in Place (FIP)
- 7.2.3.3. Loose Fill
- 7.2.3.4. Foam Rolls/Sheets
- 7.2.3.5. Other Types of Foam (Corner Blocks, etc.)
- 7.2.1. Rigid
- 7.3. Market Analysis, Insights and Forecast - by End-user Vertical
- 7.3.1. Food and Beverage
- 7.3.2. Industrial
- 7.3.3. Pharmaceuticals
- 7.3.4. Consumer Electronics
- 7.3.5. Beauty and Home Care
- 7.3.6. Other End-user Verticals
- 7.1. Market Analysis, Insights and Forecast - by Material Type
- 8. Europe Protective Packaging Industry Analysis, Insights and Forecast, 2020-2032
- 8.1. Market Analysis, Insights and Forecast - by Material Type
- 8.1.1. Plastic
- 8.1.2. Paper and Paperboard
- 8.1.3. Other Material Types
- 8.2. Market Analysis, Insights and Forecast - by Product
- 8.2.1. Rigid
- 8.2.1.1. Corrugated Paperboard Protectors
- 8.2.1.2. Molded Pulp
- 8.2.1.3. Insulated Shipping Containers
- 8.2.1.4. Other Product Types
- 8.2.2. Flexible
- 8.2.2.1. Protective Mailers
- 8.2.2.2. Bubble Wraps
- 8.2.2.3. Air Pillows/Air Bags
- 8.2.2.4. Paper Fill
- 8.2.2.5. Other Fl
- 8.2.3. Foam
- 8.2.3.1. Molded Foam
- 8.2.3.2. Foam in Place (FIP)
- 8.2.3.3. Loose Fill
- 8.2.3.4. Foam Rolls/Sheets
- 8.2.3.5. Other Types of Foam (Corner Blocks, etc.)
- 8.2.1. Rigid
- 8.3. Market Analysis, Insights and Forecast - by End-user Vertical
- 8.3.1. Food and Beverage
- 8.3.2. Industrial
- 8.3.3. Pharmaceuticals
- 8.3.4. Consumer Electronics
- 8.3.5. Beauty and Home Care
- 8.3.6. Other End-user Verticals
- 8.1. Market Analysis, Insights and Forecast - by Material Type
- 9. Asia Pacific Protective Packaging Industry Analysis, Insights and Forecast, 2020-2032
- 9.1. Market Analysis, Insights and Forecast - by Material Type
- 9.1.1. Plastic
- 9.1.2. Paper and Paperboard
- 9.1.3. Other Material Types
- 9.2. Market Analysis, Insights and Forecast - by Product
- 9.2.1. Rigid
- 9.2.1.1. Corrugated Paperboard Protectors
- 9.2.1.2. Molded Pulp
- 9.2.1.3. Insulated Shipping Containers
- 9.2.1.4. Other Product Types
- 9.2.2. Flexible
- 9.2.2.1. Protective Mailers
- 9.2.2.2. Bubble Wraps
- 9.2.2.3. Air Pillows/Air Bags
- 9.2.2.4. Paper Fill
- 9.2.2.5. Other Fl
- 9.2.3. Foam
- 9.2.3.1. Molded Foam
- 9.2.3.2. Foam in Place (FIP)
- 9.2.3.3. Loose Fill
- 9.2.3.4. Foam Rolls/Sheets
- 9.2.3.5. Other Types of Foam (Corner Blocks, etc.)
- 9.2.1. Rigid
- 9.3. Market Analysis, Insights and Forecast - by End-user Vertical
- 9.3.1. Food and Beverage
- 9.3.2. Industrial
- 9.3.3. Pharmaceuticals
- 9.3.4. Consumer Electronics
- 9.3.5. Beauty and Home Care
- 9.3.6. Other End-user Verticals
- 9.1. Market Analysis, Insights and Forecast - by Material Type
- 10. Latin America Protective Packaging Industry Analysis, Insights and Forecast, 2020-2032
- 10.1. Market Analysis, Insights and Forecast - by Material Type
- 10.1.1. Plastic
- 10.1.2. Paper and Paperboard
- 10.1.3. Other Material Types
- 10.2. Market Analysis, Insights and Forecast - by Product
- 10.2.1. Rigid
- 10.2.1.1. Corrugated Paperboard Protectors
- 10.2.1.2. Molded Pulp
- 10.2.1.3. Insulated Shipping Containers
- 10.2.1.4. Other Product Types
- 10.2.2. Flexible
- 10.2.2.1. Protective Mailers
- 10.2.2.2. Bubble Wraps
- 10.2.2.3. Air Pillows/Air Bags
- 10.2.2.4. Paper Fill
- 10.2.2.5. Other Fl
- 10.2.3. Foam
- 10.2.3.1. Molded Foam
- 10.2.3.2. Foam in Place (FIP)
- 10.2.3.3. Loose Fill
- 10.2.3.4. Foam Rolls/Sheets
- 10.2.3.5. Other Types of Foam (Corner Blocks, etc.)
- 10.2.1. Rigid
- 10.3. Market Analysis, Insights and Forecast - by End-user Vertical
- 10.3.1. Food and Beverage
- 10.3.2. Industrial
- 10.3.3. Pharmaceuticals
- 10.3.4. Consumer Electronics
- 10.3.5. Beauty and Home Care
- 10.3.6. Other End-user Verticals
- 10.1. Market Analysis, Insights and Forecast - by Material Type
- 11. Middle East Protective Packaging Industry Analysis, Insights and Forecast, 2020-2032
- 11.1. Market Analysis, Insights and Forecast - by Material Type
- 11.1.1. Plastic
- 11.1.2. Paper and Paperboard
- 11.1.3. Other Material Types
- 11.2. Market Analysis, Insights and Forecast - by Product
- 11.2.1. Rigid
- 11.2.1.1. Corrugated Paperboard Protectors
- 11.2.1.2. Molded Pulp
- 11.2.1.3. Insulated Shipping Containers
- 11.2.1.4. Other Product Types
- 11.2.2. Flexible
- 11.2.2.1. Protective Mailers
- 11.2.2.2. Bubble Wraps
- 11.2.2.3. Air Pillows/Air Bags
- 11.2.2.4. Paper Fill
- 11.2.2.5. Other Fl
- 11.2.3. Foam
- 11.2.3.1. Molded Foam
- 11.2.3.2. Foam in Place (FIP)
- 11.2.3.3. Loose Fill
- 11.2.3.4. Foam Rolls/Sheets
- 11.2.3.5. Other Types of Foam (Corner Blocks, etc.)
- 11.2.1. Rigid
- 11.3. Market Analysis, Insights and Forecast - by End-user Vertical
- 11.3.1. Food and Beverage
- 11.3.2. Industrial
- 11.3.3. Pharmaceuticals
- 11.3.4. Consumer Electronics
- 11.3.5. Beauty and Home Care
- 11.3.6. Other End-user Verticals
- 11.1. Market Analysis, Insights and Forecast - by Material Type
- 12. Competitive Analysis
- 12.1. Company Profiles
- 12.1.1 Sonoco Products Company
- 12.1.1.1. Company Overview
- 12.1.1.2. Products
- 12.1.1.3. Company Financials
- 12.1.1.4. SWOT Analysis
- 12.1.2 Smurfit Kappa Group
- 12.1.2.1. Company Overview
- 12.1.2.2. Products
- 12.1.2.3. Company Financials
- 12.1.2.4. SWOT Analysis
- 12.1.3 Storopack Hans Reichenecker Gmbh
- 12.1.3.1. Company Overview
- 12.1.3.2. Products
- 12.1.3.3. Company Financials
- 12.1.3.4. SWOT Analysis
- 12.1.4 Pro-Pac Packaging Limited
- 12.1.4.1. Company Overview
- 12.1.4.2. Products
- 12.1.4.3. Company Financials
- 12.1.4.4. SWOT Analysis
- 12.1.5 DS Smith PLC
- 12.1.5.1. Company Overview
- 12.1.5.2. Products
- 12.1.5.3. Company Financials
- 12.1.5.4. SWOT Analysis
- 12.1.6 Huhtamaki Group
- 12.1.6.1. Company Overview
- 12.1.6.2. Products
- 12.1.6.3. Company Financials
- 12.1.6.4. SWOT Analysis
- 12.1.7 Riverside Paper Co
- 12.1.7.1. Company Overview
- 12.1.7.2. Products
- 12.1.7.3. Company Financials
- 12.1.7.4. SWOT Analysis
- 12.1.8 Pregis Corporation
- 12.1.8.1. Company Overview
- 12.1.8.2. Products
- 12.1.8.3. Company Financials
- 12.1.8.4. SWOT Analysis
- 12.1.9 International Paper Company
- 12.1.9.1. Company Overview
- 12.1.9.2. Products
- 12.1.9.3. Company Financials
- 12.1.9.4. SWOT Analysis
- 12.1.10 Signode Protective Packaging Solutions
- 12.1.10.1. Company Overview
- 12.1.10.2. Products
- 12.1.10.3. Company Financials
- 12.1.10.4. SWOT Analysis
- 12.1.11 Crown Holdings Inc *List Not Exhaustive
- 12.1.11.1. Company Overview
- 12.1.11.2. Products
- 12.1.11.3. Company Financials
- 12.1.11.4. SWOT Analysis
- 12.1.12 Intertape Polymer Group Inc
- 12.1.12.1. Company Overview
- 12.1.12.2. Products
- 12.1.12.3. Company Financials
- 12.1.12.4. SWOT Analysis
- 12.1.13 Sealed Air Corporation
- 12.1.13.1. Company Overview
- 12.1.13.2. Products
- 12.1.13.3. Company Financials
- 12.1.13.4. SWOT Analysis
- 12.1.1 Sonoco Products Company
- 12.2. Market Entropy
- 12.2.1 Company's Key Areas Served
- 12.2.2 Recent Developments
- 12.3. Company Market Share Analysis 2025
- 12.3.1 Top 5 Companies Market Share Analysis
- 12.3.2 Top 3 Companies Market Share Analysis
- 12.4. List of Potential Customers
- 13. Research Methodology
List of Figures
- Figure 1: Global Protective Packaging Industry Revenue Breakdown (billion, %) by Region 2025 & 2033
- Figure 2: North America Protective Packaging Industry Revenue (billion), by Material Type 2025 & 2033
- Figure 3: North America Protective Packaging Industry Revenue Share (%), by Material Type 2025 & 2033
- Figure 4: North America Protective Packaging Industry Revenue (billion), by Product 2025 & 2033
- Figure 5: North America Protective Packaging Industry Revenue Share (%), by Product 2025 & 2033
- Figure 6: North America Protective Packaging Industry Revenue (billion), by End-user Vertical 2025 & 2033
- Figure 7: North America Protective Packaging Industry Revenue Share (%), by End-user Vertical 2025 & 2033
- Figure 8: North America Protective Packaging Industry Revenue (billion), by Country 2025 & 2033
- Figure 9: North America Protective Packaging Industry Revenue Share (%), by Country 2025 & 2033
- Figure 10: Europe Protective Packaging Industry Revenue (billion), by Material Type 2025 & 2033
- Figure 11: Europe Protective Packaging Industry Revenue Share (%), by Material Type 2025 & 2033
- Figure 12: Europe Protective Packaging Industry Revenue (billion), by Product 2025 & 2033
- Figure 13: Europe Protective Packaging Industry Revenue Share (%), by Product 2025 & 2033
- Figure 14: Europe Protective Packaging Industry Revenue (billion), by End-user Vertical 2025 & 2033
- Figure 15: Europe Protective Packaging Industry Revenue Share (%), by End-user Vertical 2025 & 2033
- Figure 16: Europe Protective Packaging Industry Revenue (billion), by Country 2025 & 2033
- Figure 17: Europe Protective Packaging Industry Revenue Share (%), by Country 2025 & 2033
- Figure 18: Asia Pacific Protective Packaging Industry Revenue (billion), by Material Type 2025 & 2033
- Figure 19: Asia Pacific Protective Packaging Industry Revenue Share (%), by Material Type 2025 & 2033
- Figure 20: Asia Pacific Protective Packaging Industry Revenue (billion), by Product 2025 & 2033
- Figure 21: Asia Pacific Protective Packaging Industry Revenue Share (%), by Product 2025 & 2033
- Figure 22: Asia Pacific Protective Packaging Industry Revenue (billion), by End-user Vertical 2025 & 2033
- Figure 23: Asia Pacific Protective Packaging Industry Revenue Share (%), by End-user Vertical 2025 & 2033
- Figure 24: Asia Pacific Protective Packaging Industry Revenue (billion), by Country 2025 & 2033
- Figure 25: Asia Pacific Protective Packaging Industry Revenue Share (%), by Country 2025 & 2033
- Figure 26: Latin America Protective Packaging Industry Revenue (billion), by Material Type 2025 & 2033
- Figure 27: Latin America Protective Packaging Industry Revenue Share (%), by Material Type 2025 & 2033
- Figure 28: Latin America Protective Packaging Industry Revenue (billion), by Product 2025 & 2033
- Figure 29: Latin America Protective Packaging Industry Revenue Share (%), by Product 2025 & 2033
- Figure 30: Latin America Protective Packaging Industry Revenue (billion), by End-user Vertical 2025 & 2033
- Figure 31: Latin America Protective Packaging Industry Revenue Share (%), by End-user Vertical 2025 & 2033
- Figure 32: Latin America Protective Packaging Industry Revenue (billion), by Country 2025 & 2033
- Figure 33: Latin America Protective Packaging Industry Revenue Share (%), by Country 2025 & 2033
- Figure 34: Middle East Protective Packaging Industry Revenue (billion), by Material Type 2025 & 2033
- Figure 35: Middle East Protective Packaging Industry Revenue Share (%), by Material Type 2025 & 2033
- Figure 36: Middle East Protective Packaging Industry Revenue (billion), by Product 2025 & 2033
- Figure 37: Middle East Protective Packaging Industry Revenue Share (%), by Product 2025 & 2033
- Figure 38: Middle East Protective Packaging Industry Revenue (billion), by End-user Vertical 2025 & 2033
- Figure 39: Middle East Protective Packaging Industry Revenue Share (%), by End-user Vertical 2025 & 2033
- Figure 40: Middle East Protective Packaging Industry Revenue (billion), by Country 2025 & 2033
- Figure 41: Middle East Protective Packaging Industry Revenue Share (%), by Country 2025 & 2033
List of Tables
- Table 1: Global Protective Packaging Industry Revenue billion Forecast, by Material Type 2020 & 2033
- Table 2: Global Protective Packaging Industry Revenue billion Forecast, by Product 2020 & 2033
- Table 3: Global Protective Packaging Industry Revenue billion Forecast, by End-user Vertical 2020 & 2033
- Table 4: Global Protective Packaging Industry Revenue billion Forecast, by Region 2020 & 2033
- Table 5: Global Protective Packaging Industry Revenue billion Forecast, by Material Type 2020 & 2033
- Table 6: Global Protective Packaging Industry Revenue billion Forecast, by Product 2020 & 2033
- Table 7: Global Protective Packaging Industry Revenue billion Forecast, by End-user Vertical 2020 & 2033
- Table 8: Global Protective Packaging Industry Revenue billion Forecast, by Country 2020 & 2033
- Table 9: Global Protective Packaging Industry Revenue billion Forecast, by Material Type 2020 & 2033
- Table 10: Global Protective Packaging Industry Revenue billion Forecast, by Product 2020 & 2033
- Table 11: Global Protective Packaging Industry Revenue billion Forecast, by End-user Vertical 2020 & 2033
- Table 12: Global Protective Packaging Industry Revenue billion Forecast, by Country 2020 & 2033
- Table 13: Global Protective Packaging Industry Revenue billion Forecast, by Material Type 2020 & 2033
- Table 14: Global Protective Packaging Industry Revenue billion Forecast, by Product 2020 & 2033
- Table 15: Global Protective Packaging Industry Revenue billion Forecast, by End-user Vertical 2020 & 2033
- Table 16: Global Protective Packaging Industry Revenue billion Forecast, by Country 2020 & 2033
- Table 17: Global Protective Packaging Industry Revenue billion Forecast, by Material Type 2020 & 2033
- Table 18: Global Protective Packaging Industry Revenue billion Forecast, by Product 2020 & 2033
- Table 19: Global Protective Packaging Industry Revenue billion Forecast, by End-user Vertical 2020 & 2033
- Table 20: Global Protective Packaging Industry Revenue billion Forecast, by Country 2020 & 2033
- Table 21: Global Protective Packaging Industry Revenue billion Forecast, by Material Type 2020 & 2033
- Table 22: Global Protective Packaging Industry Revenue billion Forecast, by Product 2020 & 2033
- Table 23: Global Protective Packaging Industry Revenue billion Forecast, by End-user Vertical 2020 & 2033
- Table 24: Global Protective Packaging Industry Revenue billion Forecast, by Country 2020 & 2033
Frequently Asked Questions
1. What is the projected Compound Annual Growth Rate (CAGR) of the Protective Packaging Industry?
The projected CAGR is approximately 4.6%.
2. Which companies are prominent players in the Protective Packaging Industry?
Key companies in the market include Sonoco Products Company, Smurfit Kappa Group, Storopack Hans Reichenecker Gmbh, Pro-Pac Packaging Limited, DS Smith PLC, Huhtamaki Group, Riverside Paper Co, Pregis Corporation, International Paper Company, Signode Protective Packaging Solutions, Crown Holdings Inc *List Not Exhaustive, Intertape Polymer Group Inc, Sealed Air Corporation.
3. What are the main segments of the Protective Packaging Industry?
The market segments include Material Type, Product, End-user Vertical.
4. Can you provide details about the market size?
The market size is estimated to be USD 33.92 billion as of 2022.
5. What are some drivers contributing to market growth?
; Increasing Trend of E-Commerce.
6. What are the notable trends driving market growth?
Plastic-based Protective Packaging is Expected to Occupy Significant Market Share.
7. Are there any restraints impacting market growth?
; Alternative Forms of Packaging.
8. Can you provide examples of recent developments in the market?
N/A
9. What pricing options are available for accessing the report?
Pricing options include single-user, multi-user, and enterprise licenses priced at USD 4750, USD 5250, and USD 8750 respectively.
10. Is the market size provided in terms of value or volume?
The market size is provided in terms of value, measured in billion.
11. Are there any specific market keywords associated with the report?
Yes, the market keyword associated with the report is "Protective Packaging Industry," which aids in identifying and referencing the specific market segment covered.
12. How do I determine which pricing option suits my needs best?
The pricing options vary based on user requirements and access needs. Individual users may opt for single-user licenses, while businesses requiring broader access may choose multi-user or enterprise licenses for cost-effective access to the report.
13. Are there any additional resources or data provided in the Protective Packaging Industry report?
While the report offers comprehensive insights, it's advisable to review the specific contents or supplementary materials provided to ascertain if additional resources or data are available.
14. How can I stay updated on further developments or reports in the Protective Packaging Industry?
To stay informed about further developments, trends, and reports in the Protective Packaging Industry, consider subscribing to industry newsletters, following relevant companies and organizations, or regularly checking reputable industry news sources and publications.
Methodology
Step 1 - Identification of Relevant Samples Size from Population Database


Step 2 - Approaches for Defining Global Market Size (Value, Volume* & Price*)

Note*: In applicable scenarios
Step 3 - Data Sources
Primary Research
- Web Analytics
- Survey Reports
- Research Institute
- Latest Research Reports
- Opinion Leaders
Secondary Research
- Annual Reports
- White Paper
- Latest Press Release
- Industry Association
- Paid Database
- Investor Presentations

Step 4 - Data Triangulation
Involves using different sources of information in order to increase the validity of a study
These sources are likely to be stakeholders in a program - participants, other researchers, program staff, other community members, and so on.
Then we put all data in single framework & apply various statistical tools to find out the dynamic on the market.
During the analysis stage, feedback from the stakeholder groups would be compared to determine areas of agreement as well as areas of divergence