

Key Insights
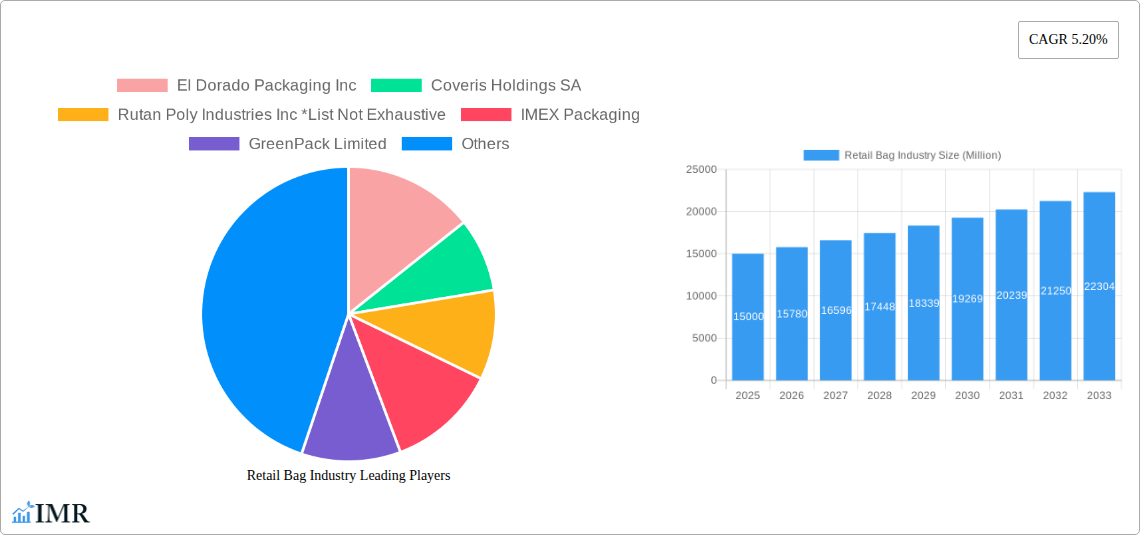
The global retail bag market, valued at approximately $18.97 billion in 2025, is projected to experience significant expansion, with a compound annual growth rate (CAGR) of 5.66% from 2025 to 2033. This growth is propelled by several key factors. The burgeoning e-commerce sector is a primary driver, increasing demand for shipping and delivery bags. Concurrently, heightened consumer awareness regarding environmental impact is accelerating the adoption of sustainable alternatives, such as paper and reusable bags. Evolving packaging regulations across various regions also compel manufacturers to utilize more sustainable and recyclable materials. The market is segmented by material type (plastic, paper, jute, cotton), end-user (grocery stores, food service), and plastic type (PET, polyester, rPET). While plastic bags, particularly those made from recyclable PET, maintain dominance due to cost-effectiveness and durability, paper and other sustainable materials are poised for steady market share growth, reflecting a growing environmentally conscious consumer base and supportive governmental initiatives. Geographically, North America and Europe currently lead in market share, but the Asia-Pacific region is expected to demonstrate substantial growth potential, fueled by economic expansion and increasing urbanization.
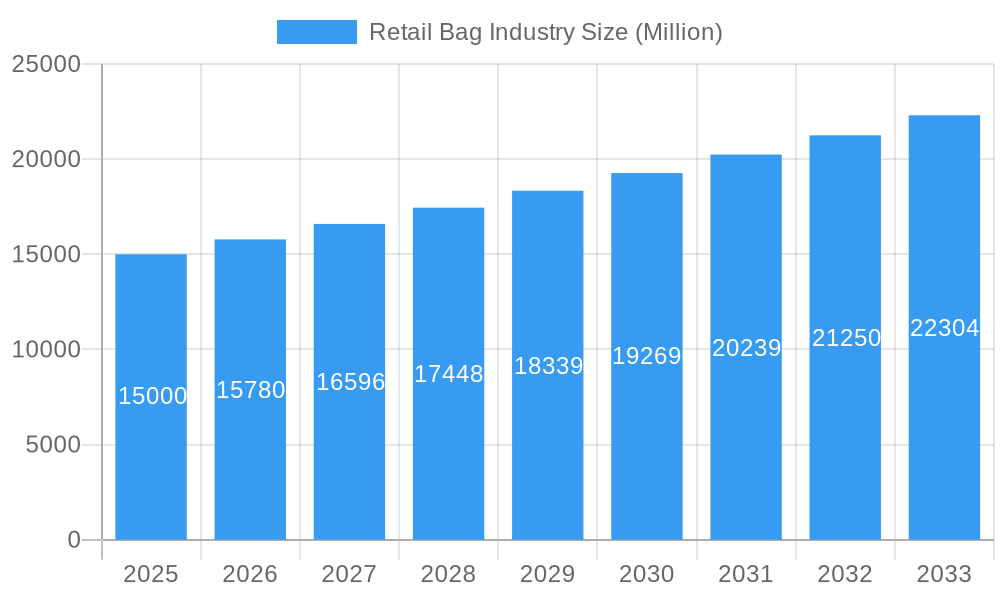
Retail Bag Industry Market Size (In Billion)
The forecast period of 2025-2033 presents considerable opportunities for businesses that effectively embrace sustainability trends. The market will increasingly prioritize innovative, eco-friendly packaging solutions that align with consumer preferences and regulatory mandates. Strategic collaborations across the supply chain will be crucial for efficient raw material sourcing, streamlined production, and optimized logistics. Diversifying product offerings to cater to varied end-user needs and material preferences will be essential for market share acquisition. Investment in research and development for advanced sustainable and recyclable materials is paramount for unlocking significant growth in this dynamic and environmentally focused market. Companies demonstrating a commitment to sustainability and supply chain transparency will resonate strongly with consumers and regulatory bodies.
Retail Bag Industry Company Market Share
This comprehensive analysis provides an in-depth overview of the retail bag industry, encompassing market dynamics, growth trajectories, key stakeholders, and future outlook. The report examines parent markets (packaging) and child markets (grocery, food service), serving as an indispensable resource for industry professionals, investors, and strategic planners. The study period covers 2019-2033, with 2025 designated as the base and estimated year.
Retail Bag Industry Market Dynamics & Structure
This section analyzes the Retail Bag market's competitive landscape, technological advancements, regulatory environment, and market trends, providing a holistic view of the industry's structure. The global retail bag market size reached xx million units in 2024 and is projected to reach xx million units by 2033.
- Market Concentration: The market is characterized by a mix of large multinational corporations and smaller regional players, resulting in a moderately consolidated structure. The top five players hold approximately xx% of the market share in 2024.
- Technological Innovation: Key drivers include advancements in sustainable materials (e.g., biodegradable plastics, recycled paper), improved printing techniques, and automation in manufacturing processes. Barriers include high R&D costs and the need for substantial infrastructure investment.
- Regulatory Framework: Stringent environmental regulations regarding plastic bag usage (e.g., bans, taxes) are significantly shaping market trends, fostering demand for eco-friendly alternatives.
- Competitive Product Substitutes: Reusable bags, boxes, and other packaging solutions present competitive pressure, particularly in the grocery and food service sectors.
- End-User Demographics: The growth is driven by a rising global population, increased consumer spending, and changing consumer preferences toward convenience and sustainability.
- M&A Trends: The industry witnessed xx M&A deals between 2019 and 2024, primarily driven by consolidation efforts and expansion into new markets and product segments. Examples include Coveris Holdings’ acquisition of Four 04 Packaging in 2021.
Retail Bag Industry Growth Trends & Insights
This section delves into the historical and projected growth of the retail bag market, analyzing factors influencing adoption rates, technological disruptions, and evolving consumer behavior. Utilizing detailed market research data, this report presents a comprehensive overview of the industry’s trajectory. The market is expected to exhibit a CAGR of xx% during the forecast period (2025-2033).
(Detailed paragraph analysis of market size evolution, adoption rates, technological disruptions, and consumer behavior shifts with specific metrics (e.g., CAGR, market penetration) would be included here - approximately 600 words).
Dominant Regions, Countries, or Segments in Retail Bag Industry
This section identifies the leading regions, countries, and segments driving market growth, offering insights into regional variations and growth potential.
- By Material Type: The Plastic segment is currently dominant, accounting for xx% of the market in 2024, followed by Paper (xx%) and Other Material Types (xx%). However, the Other Material Types segment is expected to experience faster growth due to increasing consumer demand for eco-friendly alternatives.
- By End-User: Grocery stores represent the largest end-user segment, followed by food service and other end-users. Growth in online grocery shopping is bolstering demand in this sector.
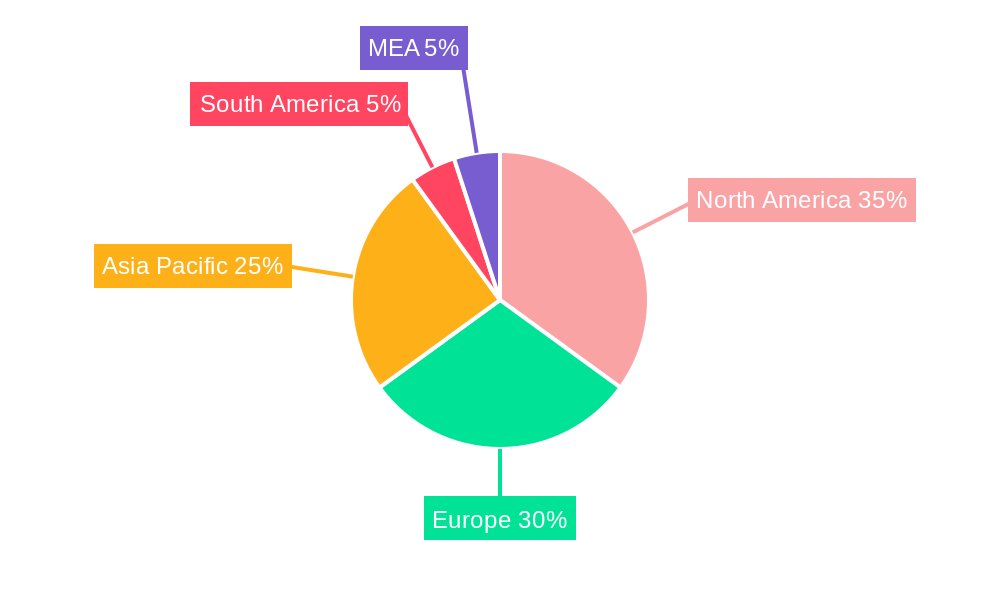
- By Region: North America and Europe are the leading regions, while Asia-Pacific is projected to exhibit the highest growth rate due to increasing urbanization and economic development. (Further detailed analysis of 600 words detailing regional and segmental dominance, market share, and growth potential would be included here, with supporting bullet points).
Retail Bag Industry Product Landscape
The retail bag industry offers a diverse product landscape, encompassing various materials, designs, and functionalities. Innovations focus on sustainability, convenience, and enhanced performance. Biodegradable and compostable bags are gaining popularity, while advancements in printing and coating technologies enhance bag aesthetics and functionality. Unique selling propositions (USPs) include customized designs, high-performance barriers, and eco-friendly certifications.
Key Drivers, Barriers & Challenges in Retail Bag Industry
Key Drivers:
- Growing e-commerce and online retail.
- Increased demand for sustainable and eco-friendly packaging.
- Stringent government regulations on plastic bag usage.
- Technological advancements in material science and manufacturing processes.
Challenges and Restraints:
- Fluctuations in raw material prices.
- Intense competition among numerous players.
- Rising labor costs and supply chain disruptions. These factors resulted in a xx% increase in production costs in 2024.
- Difficulty in balancing sustainability with cost-effectiveness.
Emerging Opportunities in Retail Bag Industry
Emerging opportunities include:
- Growing demand for customized and personalized bags.
- Expansion into niche markets (e.g., luxury retail, specialized food products).
- Development of innovative packaging solutions for emerging product categories.
- Leveraging digital printing for enhanced brand visibility.
Growth Accelerators in the Retail Bag Industry Industry
Long-term growth will be driven by strategic partnerships between manufacturers and retailers to create sustainable packaging solutions. Technological advancements in biodegradable materials and efficient manufacturing processes will also play a crucial role. Expansion into untapped markets, particularly in developing economies, will contribute significantly to market expansion.
Key Players Shaping the Retail Bag Industry Market
- El Dorado Packaging Inc
- Coveris Holdings SA
- Rutan Poly Industries Inc
- IMEX Packaging
- GreenPack Limited
- American Packaging Corporation
- Atlantic Poly Inc
- Rainbow Packaging Inc
- Global-Pak Inc
- Novolex Holdings Inc
- Mondi Group PLC
- International Paper Company
- Smurfit Kappa Group PLC
- BioPak Pty Ltd
- Welton Bibby And Baron Limited
- The Carry Bag Company
- Attwoods Packaging Company
Notable Milestones in Retail Bag Industry Sector
- June 2021: Mondi Group Inc. announced plans to expand its paper-based MailerBAG range, promoting a recyclable alternative to plastic packaging in e-commerce.
- May 2021: Coveris Holdings acquired Four 04 Packaging, strengthening its position in biodegradable bags for fresh produce and expanding its UK presence.
In-Depth Retail Bag Industry Market Outlook
The Retail Bag Industry is poised for sustained growth, driven by ongoing demand for sustainable packaging solutions and the expansion of e-commerce. Strategic partnerships, product innovation, and expansion into new markets will further accelerate market growth, creating lucrative opportunities for industry players. The market is expected to witness significant consolidation and innovation in the coming years.
Retail Bag Industry Segmentation
-
1. Material Type
-
1.1. Plastic
- 1.1.1. Polyethylene (PE)
- 1.1.2. Polypropylene (PP)
- 1.1.3. Other Plastic Types (PET, Polyester, rPET)
- 1.2. Paper
- 1.3. Other Material Types (Jute, Cotton, Canvas)
-
1.1. Plastic
-
2. End-User
- 2.1. Grocery Stores
- 2.2. Food Service
- 2.3. Other End-Users
Retail Bag Industry Segmentation By Geography
- 1. North America
- 2. Europe
- 3. Asia Pacific
- 4. Latin America
- 5. Middle East and Africa
Retail Bag Industry Regional Market Share
Geographic Coverage of Retail Bag Industry
Retail Bag Industry REPORT HIGHLIGHTS
| Aspects | Details |
|---|---|
| Study Period | 2020-2034 |
| Base Year | 2025 |
| Estimated Year | 2026 |
| Forecast Period | 2026-2034 |
| Historical Period | 2020-2025 |
| Growth Rate | CAGR of 5.66% from 2020-2034 |
| Segmentation |
|
Table of Contents
- 1. Introduction
- 1.1. Research Scope
- 1.2. Market Segmentation
- 1.3. Research Objective
- 1.4. Definitions and Assumptions
- 2. Executive Summary
- 2.1. Market Snapshot
- 3. Market Dynamics
- 3.1. Market Drivers
- 3.2. Market Restrains
- 3.3. Market Trends
- 3.4. Market Opportunities
- 4. Market Factor Analysis
- 4.1. Porters Five Forces
- 4.1.1. Bargaining Power of Suppliers
- 4.1.2. Bargaining Power of Buyers
- 4.1.3. Threat of New Entrants
- 4.1.4. Threat of Substitutes
- 4.1.5. Competitive Rivalry
- 4.2. PESTEL analysis
- 4.3. BCG Analysis
- 4.3.1. Stars (High Growth, High Market Share)
- 4.3.2. Cash Cows (Low Growth, High Market Share)
- 4.3.3. Question Mark (High Growth, Low Market Share)
- 4.3.4. Dogs (Low Growth, Low Market Share)
- 4.4. Ansoff Matrix Analysis
- 4.5. Supply Chain Analysis
- 4.6. Regulatory Landscape
- 4.7. Current Market Potential and Opportunity Assessment (TAM–SAM–SOM Framework)
- 4.8. IMR Analyst Note
- 4.1. Porters Five Forces
- 5. Market Analysis, Insights and Forecast 2021-2033
- 5.1. Market Analysis, Insights and Forecast - by Material Type
- 5.1.1. Plastic
- 5.1.1.1. Polyethylene (PE)
- 5.1.1.2. Polypropylene (PP)
- 5.1.1.3. Other Plastic Types (PET, Polyester, rPET)
- 5.1.2. Paper
- 5.1.3. Other Material Types (Jute, Cotton, Canvas)
- 5.1.1. Plastic
- 5.2. Market Analysis, Insights and Forecast - by End-User
- 5.2.1. Grocery Stores
- 5.2.2. Food Service
- 5.2.3. Other End-Users
- 5.3. Market Analysis, Insights and Forecast - by Region
- 5.3.1. North America
- 5.3.2. Europe
- 5.3.3. Asia Pacific
- 5.3.4. Latin America
- 5.3.5. Middle East and Africa
- 5.1. Market Analysis, Insights and Forecast - by Material Type
- 6. Global Retail Bag Industry Analysis, Insights and Forecast, 2021-2033
- 6.1. Market Analysis, Insights and Forecast - by Material Type
- 6.1.1. Plastic
- 6.1.1.1. Polyethylene (PE)
- 6.1.1.2. Polypropylene (PP)
- 6.1.1.3. Other Plastic Types (PET, Polyester, rPET)
- 6.1.2. Paper
- 6.1.3. Other Material Types (Jute, Cotton, Canvas)
- 6.1.1. Plastic
- 6.2. Market Analysis, Insights and Forecast - by End-User
- 6.2.1. Grocery Stores
- 6.2.2. Food Service
- 6.2.3. Other End-Users
- 6.1. Market Analysis, Insights and Forecast - by Material Type
- 7. North America Retail Bag Industry Analysis, Insights and Forecast, 2020-2032
- 7.1. Market Analysis, Insights and Forecast - by Material Type
- 7.1.1. Plastic
- 7.1.1.1. Polyethylene (PE)
- 7.1.1.2. Polypropylene (PP)
- 7.1.1.3. Other Plastic Types (PET, Polyester, rPET)
- 7.1.2. Paper
- 7.1.3. Other Material Types (Jute, Cotton, Canvas)
- 7.1.1. Plastic
- 7.2. Market Analysis, Insights and Forecast - by End-User
- 7.2.1. Grocery Stores
- 7.2.2. Food Service
- 7.2.3. Other End-Users
- 7.1. Market Analysis, Insights and Forecast - by Material Type
- 8. Europe Retail Bag Industry Analysis, Insights and Forecast, 2020-2032
- 8.1. Market Analysis, Insights and Forecast - by Material Type
- 8.1.1. Plastic
- 8.1.1.1. Polyethylene (PE)
- 8.1.1.2. Polypropylene (PP)
- 8.1.1.3. Other Plastic Types (PET, Polyester, rPET)
- 8.1.2. Paper
- 8.1.3. Other Material Types (Jute, Cotton, Canvas)
- 8.1.1. Plastic
- 8.2. Market Analysis, Insights and Forecast - by End-User
- 8.2.1. Grocery Stores
- 8.2.2. Food Service
- 8.2.3. Other End-Users
- 8.1. Market Analysis, Insights and Forecast - by Material Type
- 9. Asia Pacific Retail Bag Industry Analysis, Insights and Forecast, 2020-2032
- 9.1. Market Analysis, Insights and Forecast - by Material Type
- 9.1.1. Plastic
- 9.1.1.1. Polyethylene (PE)
- 9.1.1.2. Polypropylene (PP)
- 9.1.1.3. Other Plastic Types (PET, Polyester, rPET)
- 9.1.2. Paper
- 9.1.3. Other Material Types (Jute, Cotton, Canvas)
- 9.1.1. Plastic
- 9.2. Market Analysis, Insights and Forecast - by End-User
- 9.2.1. Grocery Stores
- 9.2.2. Food Service
- 9.2.3. Other End-Users
- 9.1. Market Analysis, Insights and Forecast - by Material Type
- 10. Latin America Retail Bag Industry Analysis, Insights and Forecast, 2020-2032
- 10.1. Market Analysis, Insights and Forecast - by Material Type
- 10.1.1. Plastic
- 10.1.1.1. Polyethylene (PE)
- 10.1.1.2. Polypropylene (PP)
- 10.1.1.3. Other Plastic Types (PET, Polyester, rPET)
- 10.1.2. Paper
- 10.1.3. Other Material Types (Jute, Cotton, Canvas)
- 10.1.1. Plastic
- 10.2. Market Analysis, Insights and Forecast - by End-User
- 10.2.1. Grocery Stores
- 10.2.2. Food Service
- 10.2.3. Other End-Users
- 10.1. Market Analysis, Insights and Forecast - by Material Type
- 11. Middle East and Africa Retail Bag Industry Analysis, Insights and Forecast, 2020-2032
- 11.1. Market Analysis, Insights and Forecast - by Material Type
- 11.1.1. Plastic
- 11.1.1.1. Polyethylene (PE)
- 11.1.1.2. Polypropylene (PP)
- 11.1.1.3. Other Plastic Types (PET, Polyester, rPET)
- 11.1.2. Paper
- 11.1.3. Other Material Types (Jute, Cotton, Canvas)
- 11.1.1. Plastic
- 11.2. Market Analysis, Insights and Forecast - by End-User
- 11.2.1. Grocery Stores
- 11.2.2. Food Service
- 11.2.3. Other End-Users
- 11.1. Market Analysis, Insights and Forecast - by Material Type
- 12. Competitive Analysis
- 12.1. Company Profiles
- 12.1.1 El Dorado Packaging Inc
- 12.1.1.1. Company Overview
- 12.1.1.2. Products
- 12.1.1.3. Company Financials
- 12.1.1.4. SWOT Analysis
- 12.1.2 Coveris Holdings SA
- 12.1.2.1. Company Overview
- 12.1.2.2. Products
- 12.1.2.3. Company Financials
- 12.1.2.4. SWOT Analysis
- 12.1.3 Rutan Poly Industries Inc *List Not Exhaustive
- 12.1.3.1. Company Overview
- 12.1.3.2. Products
- 12.1.3.3. Company Financials
- 12.1.3.4. SWOT Analysis
- 12.1.4 IMEX Packaging
- 12.1.4.1. Company Overview
- 12.1.4.2. Products
- 12.1.4.3. Company Financials
- 12.1.4.4. SWOT Analysis
- 12.1.5 GreenPack Limited
- 12.1.5.1. Company Overview
- 12.1.5.2. Products
- 12.1.5.3. Company Financials
- 12.1.5.4. SWOT Analysis
- 12.1.6 American Packaging Corporation
- 12.1.6.1. Company Overview
- 12.1.6.2. Products
- 12.1.6.3. Company Financials
- 12.1.6.4. SWOT Analysis
- 12.1.7 Atlantic Poly Inc
- 12.1.7.1. Company Overview
- 12.1.7.2. Products
- 12.1.7.3. Company Financials
- 12.1.7.4. SWOT Analysis
- 12.1.8 Rainbow Packaging Inc
- 12.1.8.1. Company Overview
- 12.1.8.2. Products
- 12.1.8.3. Company Financials
- 12.1.8.4. SWOT Analysis
- 12.1.9 Global-Pak Inc
- 12.1.9.1. Company Overview
- 12.1.9.2. Products
- 12.1.9.3. Company Financials
- 12.1.9.4. SWOT Analysis
- 12.1.10 Novolex Holdings Inc
- 12.1.10.1. Company Overview
- 12.1.10.2. Products
- 12.1.10.3. Company Financials
- 12.1.10.4. SWOT Analysis
- 12.1.11 Mondi Group PLC
- 12.1.11.1. Company Overview
- 12.1.11.2. Products
- 12.1.11.3. Company Financials
- 12.1.11.4. SWOT Analysis
- 12.1.12 International Paper Company
- 12.1.12.1. Company Overview
- 12.1.12.2. Products
- 12.1.12.3. Company Financials
- 12.1.12.4. SWOT Analysis
- 12.1.13 Smurfit Kappa Group PLC
- 12.1.13.1. Company Overview
- 12.1.13.2. Products
- 12.1.13.3. Company Financials
- 12.1.13.4. SWOT Analysis
- 12.1.14 BioPak Pty Ltd
- 12.1.14.1. Company Overview
- 12.1.14.2. Products
- 12.1.14.3. Company Financials
- 12.1.14.4. SWOT Analysis
- 12.1.15 Welton Bibby And Baron Limited
- 12.1.15.1. Company Overview
- 12.1.15.2. Products
- 12.1.15.3. Company Financials
- 12.1.15.4. SWOT Analysis
- 12.1.16 The Carry Bag Company
- 12.1.16.1. Company Overview
- 12.1.16.2. Products
- 12.1.16.3. Company Financials
- 12.1.16.4. SWOT Analysis
- 12.1.17 Attwoods Packaging Company
- 12.1.17.1. Company Overview
- 12.1.17.2. Products
- 12.1.17.3. Company Financials
- 12.1.17.4. SWOT Analysis
- 12.1.1 El Dorado Packaging Inc
- 12.2. Market Entropy
- 12.2.1 Company's Key Areas Served
- 12.2.2 Recent Developments
- 12.3. Company Market Share Analysis 2025
- 12.3.1 Top 5 Companies Market Share Analysis
- 12.3.2 Top 3 Companies Market Share Analysis
- 12.4. List of Potential Customers
- 13. Research Methodology
List of Figures
- Figure 1: Global Retail Bag Industry Revenue Breakdown (billion, %) by Region 2025 & 2033
- Figure 2: North America Retail Bag Industry Revenue (billion), by Material Type 2025 & 2033
- Figure 3: North America Retail Bag Industry Revenue Share (%), by Material Type 2025 & 2033
- Figure 4: North America Retail Bag Industry Revenue (billion), by End-User 2025 & 2033
- Figure 5: North America Retail Bag Industry Revenue Share (%), by End-User 2025 & 2033
- Figure 6: North America Retail Bag Industry Revenue (billion), by Country 2025 & 2033
- Figure 7: North America Retail Bag Industry Revenue Share (%), by Country 2025 & 2033
- Figure 8: Europe Retail Bag Industry Revenue (billion), by Material Type 2025 & 2033
- Figure 9: Europe Retail Bag Industry Revenue Share (%), by Material Type 2025 & 2033
- Figure 10: Europe Retail Bag Industry Revenue (billion), by End-User 2025 & 2033
- Figure 11: Europe Retail Bag Industry Revenue Share (%), by End-User 2025 & 2033
- Figure 12: Europe Retail Bag Industry Revenue (billion), by Country 2025 & 2033
- Figure 13: Europe Retail Bag Industry Revenue Share (%), by Country 2025 & 2033
- Figure 14: Asia Pacific Retail Bag Industry Revenue (billion), by Material Type 2025 & 2033
- Figure 15: Asia Pacific Retail Bag Industry Revenue Share (%), by Material Type 2025 & 2033
- Figure 16: Asia Pacific Retail Bag Industry Revenue (billion), by End-User 2025 & 2033
- Figure 17: Asia Pacific Retail Bag Industry Revenue Share (%), by End-User 2025 & 2033
- Figure 18: Asia Pacific Retail Bag Industry Revenue (billion), by Country 2025 & 2033
- Figure 19: Asia Pacific Retail Bag Industry Revenue Share (%), by Country 2025 & 2033
- Figure 20: Latin America Retail Bag Industry Revenue (billion), by Material Type 2025 & 2033
- Figure 21: Latin America Retail Bag Industry Revenue Share (%), by Material Type 2025 & 2033
- Figure 22: Latin America Retail Bag Industry Revenue (billion), by End-User 2025 & 2033
- Figure 23: Latin America Retail Bag Industry Revenue Share (%), by End-User 2025 & 2033
- Figure 24: Latin America Retail Bag Industry Revenue (billion), by Country 2025 & 2033
- Figure 25: Latin America Retail Bag Industry Revenue Share (%), by Country 2025 & 2033
- Figure 26: Middle East and Africa Retail Bag Industry Revenue (billion), by Material Type 2025 & 2033
- Figure 27: Middle East and Africa Retail Bag Industry Revenue Share (%), by Material Type 2025 & 2033
- Figure 28: Middle East and Africa Retail Bag Industry Revenue (billion), by End-User 2025 & 2033
- Figure 29: Middle East and Africa Retail Bag Industry Revenue Share (%), by End-User 2025 & 2033
- Figure 30: Middle East and Africa Retail Bag Industry Revenue (billion), by Country 2025 & 2033
- Figure 31: Middle East and Africa Retail Bag Industry Revenue Share (%), by Country 2025 & 2033
List of Tables
- Table 1: Global Retail Bag Industry Revenue billion Forecast, by Material Type 2020 & 2033
- Table 2: Global Retail Bag Industry Revenue billion Forecast, by End-User 2020 & 2033
- Table 3: Global Retail Bag Industry Revenue billion Forecast, by Region 2020 & 2033
- Table 4: Global Retail Bag Industry Revenue billion Forecast, by Material Type 2020 & 2033
- Table 5: Global Retail Bag Industry Revenue billion Forecast, by End-User 2020 & 2033
- Table 6: Global Retail Bag Industry Revenue billion Forecast, by Country 2020 & 2033
- Table 7: Global Retail Bag Industry Revenue billion Forecast, by Material Type 2020 & 2033
- Table 8: Global Retail Bag Industry Revenue billion Forecast, by End-User 2020 & 2033
- Table 9: Global Retail Bag Industry Revenue billion Forecast, by Country 2020 & 2033
- Table 10: Global Retail Bag Industry Revenue billion Forecast, by Material Type 2020 & 2033
- Table 11: Global Retail Bag Industry Revenue billion Forecast, by End-User 2020 & 2033
- Table 12: Global Retail Bag Industry Revenue billion Forecast, by Country 2020 & 2033
- Table 13: Global Retail Bag Industry Revenue billion Forecast, by Material Type 2020 & 2033
- Table 14: Global Retail Bag Industry Revenue billion Forecast, by End-User 2020 & 2033
- Table 15: Global Retail Bag Industry Revenue billion Forecast, by Country 2020 & 2033
- Table 16: Global Retail Bag Industry Revenue billion Forecast, by Material Type 2020 & 2033
- Table 17: Global Retail Bag Industry Revenue billion Forecast, by End-User 2020 & 2033
- Table 18: Global Retail Bag Industry Revenue billion Forecast, by Country 2020 & 2033
Frequently Asked Questions
1. What is the projected Compound Annual Growth Rate (CAGR) of the Retail Bag Industry?
The projected CAGR is approximately 5.66%.
2. Which companies are prominent players in the Retail Bag Industry?
Key companies in the market include El Dorado Packaging Inc, Coveris Holdings SA, Rutan Poly Industries Inc *List Not Exhaustive, IMEX Packaging, GreenPack Limited, American Packaging Corporation, Atlantic Poly Inc, Rainbow Packaging Inc, Global-Pak Inc, Novolex Holdings Inc, Mondi Group PLC, International Paper Company, Smurfit Kappa Group PLC, BioPak Pty Ltd, Welton Bibby And Baron Limited, The Carry Bag Company, Attwoods Packaging Company.
3. What are the main segments of the Retail Bag Industry?
The market segments include Material Type, End-User.
4. Can you provide details about the market size?
The market size is estimated to be USD 18.97 billion as of 2022.
5. What are some drivers contributing to market growth?
Growing Preference for Paper Bags Globally; Rising Consumption of Personal Care Products and Cosmetics.
6. What are the notable trends driving market growth?
Paper Material Segment to Have a Dominant Share in the Market.
7. Are there any restraints impacting market growth?
Restrictions on Using Plastic Retail Bags.
8. Can you provide examples of recent developments in the market?
June 2021 - Mondi Group Inc. announced plans for increasing its paper-based MailerBAG range to further replace plastic packaging in e-commerce with a recyclable solution made of responsibly sourced renewable materials.
9. What pricing options are available for accessing the report?
Pricing options include single-user, multi-user, and enterprise licenses priced at USD 4750, USD 5250, and USD 8750 respectively.
10. Is the market size provided in terms of value or volume?
The market size is provided in terms of value, measured in billion.
11. Are there any specific market keywords associated with the report?
Yes, the market keyword associated with the report is "Retail Bag Industry," which aids in identifying and referencing the specific market segment covered.
12. How do I determine which pricing option suits my needs best?
The pricing options vary based on user requirements and access needs. Individual users may opt for single-user licenses, while businesses requiring broader access may choose multi-user or enterprise licenses for cost-effective access to the report.
13. Are there any additional resources or data provided in the Retail Bag Industry report?
While the report offers comprehensive insights, it's advisable to review the specific contents or supplementary materials provided to ascertain if additional resources or data are available.
14. How can I stay updated on further developments or reports in the Retail Bag Industry?
To stay informed about further developments, trends, and reports in the Retail Bag Industry, consider subscribing to industry newsletters, following relevant companies and organizations, or regularly checking reputable industry news sources and publications.
Methodology
Step 1 - Identification of Relevant Samples Size from Population Database


Step 2 - Approaches for Defining Global Market Size (Value, Volume* & Price*)

Note*: In applicable scenarios
Step 3 - Data Sources
Primary Research
- Web Analytics
- Survey Reports
- Research Institute
- Latest Research Reports
- Opinion Leaders
Secondary Research
- Annual Reports
- White Paper
- Latest Press Release
- Industry Association
- Paid Database
- Investor Presentations

Step 4 - Data Triangulation
Involves using different sources of information in order to increase the validity of a study
These sources are likely to be stakeholders in a program - participants, other researchers, program staff, other community members, and so on.
Then we put all data in single framework & apply various statistical tools to find out the dynamic on the market.
During the analysis stage, feedback from the stakeholder groups would be compared to determine areas of agreement as well as areas of divergence