

Key Insights
The Retail Ready Packaging (RRP) market is poised for significant expansion, driven by evolving consumer preferences for convenience, enhanced in-store presentation, and sustainable solutions. The market is projected to achieve a Compound Annual Growth Rate (CAGR) of 5.7% from 2025 to 2033. Key growth catalysts include the rapid ascent of e-commerce, demanding robust and optimized packaging for online fulfillment, and a heightened global emphasis on sustainability, accelerating the adoption of eco-friendly materials such as recycled paper and paperboard. Innovative RRP designs, including striking die-cut displays and efficient shrink-wrapped trays, are instrumental in elevating product visibility and shelf appeal, thereby driving sales performance. Segmentation analysis indicates that paper and paperboard materials will continue to dominate, followed by plastics, owing to their cost-effectiveness and favorable properties. Corrugated cardboard boxes and versatile die-cut display containers are expected to lead package types, serving the diverse requirements of the food, beverage, and household product sectors. Geographically, North America and Europe represent strong existing markets, while the Asia Pacific region offers substantial growth potential, fueled by increasing disposable incomes and burgeoning retail landscapes.
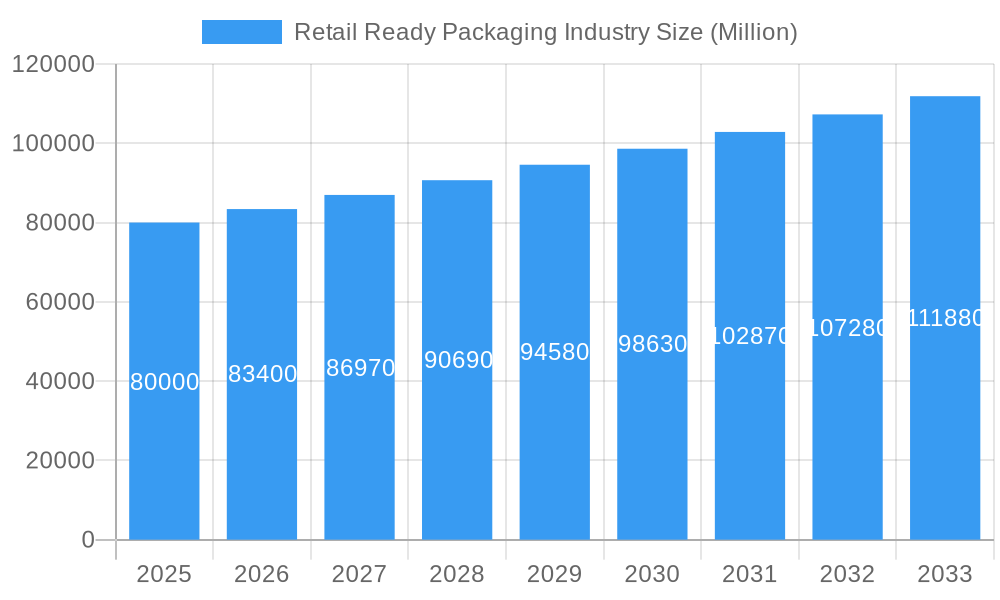
Retail Ready Packaging Industry Market Size (In Billion)
Despite robust growth prospects, the RRP market faces certain challenges. Volatility in raw material prices, particularly for paper and plastics, can influence profitability. Additionally, evolving environmental regulations necessitate significant investment in sustainable technologies and materials. The growing demand for bespoke packaging solutions presents both an opportunity for differentiation and a challenge for agility, requiring manufacturers to rapidly adapt to dynamic consumer and retail strategies. Navigating these challenges while capitalizing on emerging trends in sustainable packaging and optimized e-commerce logistics will be critical for market success. The estimated market size for 2025 stands at $78.31 billion, with a positive overall outlook driven by sustained consumer demand and technological innovation.
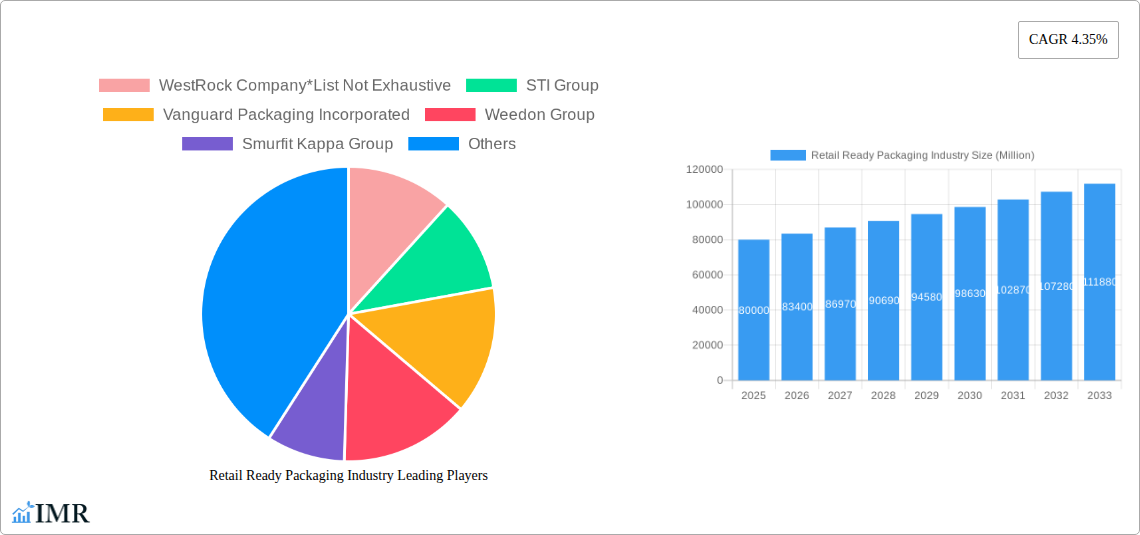
Retail Ready Packaging Industry Company Market Share
Retail Ready Packaging Market Report: 2019-2033
This comprehensive report provides a detailed analysis of the Retail Ready Packaging industry, encompassing market dynamics, growth trends, regional analysis, and key players. With a study period spanning 2019-2033, a base year of 2025, and a forecast period of 2025-2033, this report offers invaluable insights for industry professionals, investors, and strategic decision-makers. The report segments the market by material type (Paper and Paperboard, Plastics, Other Material Types), package type (Die-cut Display Containers, Corrugated Cardboard Boxes, Shrink Wrapped Trays, Modified Cases, Plastic Containers, Other Type of Packages), and end-user application (Food, Beverage, Household Products, Other End-User Applications). The market size is presented in million units.
Retail Ready Packaging Industry Market Dynamics & Structure
The retail ready packaging market is characterized by moderate concentration, with several large players holding significant market share. Technological innovation, particularly in sustainable materials and automation, is a key driver. Regulatory frameworks focusing on sustainability and recyclability are increasingly influencing packaging choices. Competitive pressures from substitute materials and packaging types are prevalent. End-user demographics, particularly the growing preference for convenience and e-commerce, shape demand. Mergers and acquisitions (M&A) activity has been consistent, reflecting industry consolidation.
- Market Concentration: The top 5 players hold an estimated xx% market share in 2025.
- Technological Innovation: Focus on automation, lightweighting, and sustainable materials like recycled paperboard and biodegradable plastics.
- Regulatory Landscape: Stringent regulations on packaging waste and recyclability are driving innovation in eco-friendly solutions.
- Competitive Substitutes: Reusable packaging systems and alternative delivery models pose challenges to traditional retail-ready packaging.
- M&A Activity: An estimated xx M&A deals occurred between 2019 and 2024, primarily driven by expansion and market consolidation.
- Innovation Barriers: High R&D costs and the need for regulatory approvals hinder rapid innovation.
Retail Ready Packaging Industry Growth Trends & Insights
The global retail ready packaging market exhibited a CAGR of xx% during the historical period (2019-2024), reaching xx million units in 2024. This growth is attributed to several factors, including the increasing adoption of retail-ready packaging by major retailers, the growth of e-commerce, and advancements in packaging technology. Technological disruptions, like the adoption of smart packaging and improved automation in packaging lines, are boosting efficiency and reducing costs. Shifting consumer preferences towards convenience and sustainability also fuel market expansion. The market is expected to maintain a healthy CAGR of xx% during the forecast period (2025-2033), reaching xx million units by 2033. Market penetration in developing economies is a significant growth driver.
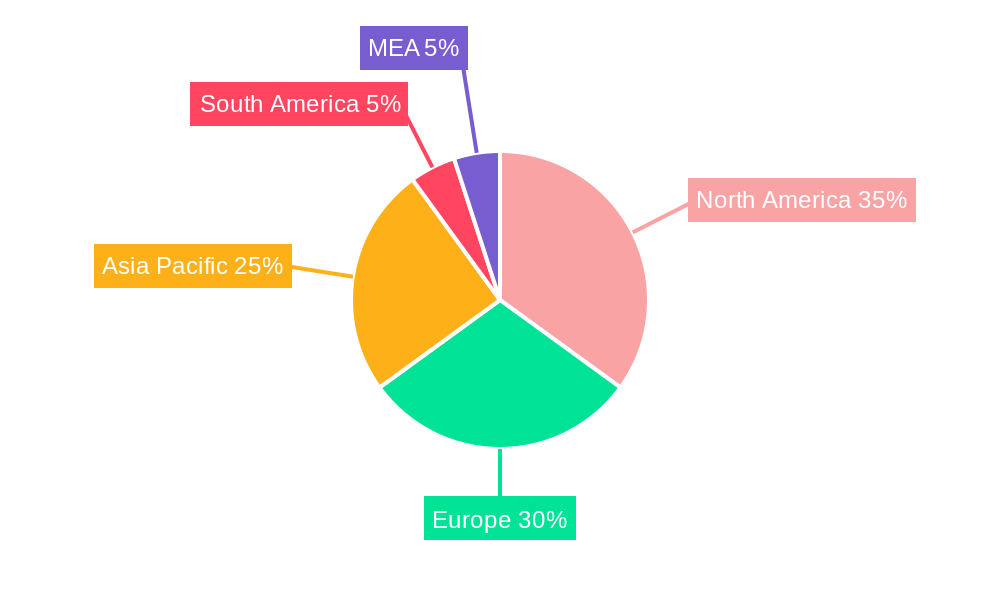
Dominant Regions, Countries, or Segments in Retail Ready Packaging Industry
North America and Europe currently dominate the retail ready packaging market, driven by robust retail sectors and high adoption rates of advanced packaging solutions. Within material types, paper and paperboard remain the leading segment due to their cost-effectiveness and recyclability. Corrugated cardboard boxes are the most widely used package type, followed by die-cut display containers. The food and beverage sector is the largest end-user application, followed by household products. However, significant growth potential exists in emerging markets like Asia-Pacific and Latin America due to rapid urbanization and rising disposable incomes.
- Key Drivers in North America: Strong retail infrastructure, high consumer spending, and emphasis on sustainable packaging practices.
- Key Drivers in Europe: Stringent environmental regulations, focus on eco-friendly solutions, and growing e-commerce sector.
- Growth Potential in Asia-Pacific: Rapid economic growth, expanding retail sector, and increasing demand for convenient packaging solutions.
- Market Share: North America holds approximately xx% market share, while Europe holds xx% in 2025.
Retail Ready Packaging Industry Product Landscape
Recent product innovations in retail ready packaging focus on sustainability, enhanced functionality, and improved consumer experience. This includes the use of lightweight materials, recyclable and compostable options, and integrated features for ease of handling and display. Advancements in printing and labeling technologies have enabled more visually appealing and informative packaging. Key performance metrics include cost-effectiveness, material efficiency, recyclability, and overall impact on supply chain efficiency.
Key Drivers, Barriers & Challenges in Retail Ready Packaging Industry
Key Drivers: The rising popularity of e-commerce, the need for efficient supply chain management, and increasing demand for sustainable packaging solutions are major drivers. Technological advancements, such as automated packaging lines and smart packaging solutions, improve efficiency and reduce costs. Favorable government regulations supporting sustainable packaging further propel market growth.
Challenges & Restraints: Fluctuating raw material prices, particularly for paper and plastics, pose a significant challenge. Supply chain disruptions and labor shortages can impact production and delivery. Stricter environmental regulations and compliance requirements can increase costs and complexity for manufacturers. Intense competition from existing and new players limits profit margins.
Emerging Opportunities in Retail Ready Packaging Industry
Untapped markets in developing economies present significant growth opportunities. The rising demand for customized packaging and personalized branding creates new avenues for innovation. The development of innovative, sustainable materials, such as bioplastics and mushroom packaging, offers a promising pathway to eco-friendly packaging solutions. Integration of smart packaging technologies, including RFID tags and QR codes, enhances product traceability and consumer engagement.
Growth Accelerators in the Retail Ready Packaging Industry
Strategic partnerships between packaging manufacturers, retailers, and technology providers will drive innovation and market expansion. Technological breakthroughs in materials science and automation will improve packaging efficiency and reduce costs. Expansion into new markets, especially in developing economies, will unlock significant growth potential. A focus on sustainable and eco-friendly packaging will cater to the growing consumer demand for environmentally responsible products.
Key Players Shaping the Retail Ready Packaging Industry Market
- WestRock Company
- STI Group
- Vanguard Packaging Incorporated
- Weedon Group
- Smurfit Kappa Group
- Caps Cases Limited
- Cardboard Box Company
- DS Smith PLC
- Mondi Group
- International Paper Company
Notable Milestones in Retail Ready Packaging Industry Sector
- October 2022: ORBIS Corporation showcased integrated reusable packaging solutions at PACK EXPO 2022, emphasizing supply chain efficiency and sustainability.
- February 2022: Linpac Packaging launched a new line of rigid-plastic, retail-ready packaging, focusing on flexibility and impact absorption.
In-Depth Retail Ready Packaging Industry Market Outlook
The retail ready packaging market is poised for continued growth, driven by technological advancements, sustainability initiatives, and expanding e-commerce. Strategic investments in innovation, sustainable materials, and automation will be crucial for success. Companies focusing on customized solutions and expanding into emerging markets are expected to gain a competitive edge. The long-term potential is significant, with opportunities for both established players and new entrants to capitalize on the growing demand for efficient and sustainable packaging solutions.
Retail Ready Packaging Industry Segmentation
-
1. Material Type
- 1.1. Paper and Paperboard
- 1.2. Plastics
- 1.3. Other Material Types
-
2. Type of Package
- 2.1. Die-cut Display Containers
- 2.2. Corrugated Cardboard Boxes
- 2.3. Shrink Wrapped Trays
- 2.4. Modified Cases
- 2.5. Plastic Containers
- 2.6. Other Type of Packages
-
3. End-User Application
- 3.1. Food
- 3.2. Beverage
- 3.3. Household Products
- 3.4. Other End-User Applications
Retail Ready Packaging Industry Segmentation By Geography
-
1. North America
- 1.1. United States
- 1.2. Canada
-
2. Europe
- 2.1. Germany
- 2.2. United Kingdoms
- 2.3. France
- 2.4. Rest of the Europe
-
3. Asia Pacific
- 3.1. China
- 3.2. India
- 3.3. Japan
- 3.4. Rest of the Asia Pacific
- 4. Latin America
- 5. Middle East and Africa
Retail Ready Packaging Industry Regional Market Share
Geographic Coverage of Retail Ready Packaging Industry
Retail Ready Packaging Industry REPORT HIGHLIGHTS
| Aspects | Details |
|---|---|
| Study Period | 2020-2034 |
| Base Year | 2025 |
| Estimated Year | 2026 |
| Forecast Period | 2026-2034 |
| Historical Period | 2020-2025 |
| Growth Rate | CAGR of 5.7% from 2020-2034 |
| Segmentation |
|
Table of Contents
- 1. Introduction
- 1.1. Research Scope
- 1.2. Market Segmentation
- 1.3. Research Objective
- 1.4. Definitions and Assumptions
- 2. Executive Summary
- 2.1. Market Snapshot
- 3. Market Dynamics
- 3.1. Market Drivers
- 3.2. Market Restrains
- 3.3. Market Trends
- 3.4. Market Opportunities
- 4. Market Factor Analysis
- 4.1. Porters Five Forces
- 4.1.1. Bargaining Power of Suppliers
- 4.1.2. Bargaining Power of Buyers
- 4.1.3. Threat of New Entrants
- 4.1.4. Threat of Substitutes
- 4.1.5. Competitive Rivalry
- 4.2. PESTEL analysis
- 4.3. BCG Analysis
- 4.3.1. Stars (High Growth, High Market Share)
- 4.3.2. Cash Cows (Low Growth, High Market Share)
- 4.3.3. Question Mark (High Growth, Low Market Share)
- 4.3.4. Dogs (Low Growth, Low Market Share)
- 4.4. Ansoff Matrix Analysis
- 4.5. Supply Chain Analysis
- 4.6. Regulatory Landscape
- 4.7. Current Market Potential and Opportunity Assessment (TAM–SAM–SOM Framework)
- 4.8. IMR Analyst Note
- 4.1. Porters Five Forces
- 5. Market Analysis, Insights and Forecast 2021-2033
- 5.1. Market Analysis, Insights and Forecast - by Material Type
- 5.1.1. Paper and Paperboard
- 5.1.2. Plastics
- 5.1.3. Other Material Types
- 5.2. Market Analysis, Insights and Forecast - by Type of Package
- 5.2.1. Die-cut Display Containers
- 5.2.2. Corrugated Cardboard Boxes
- 5.2.3. Shrink Wrapped Trays
- 5.2.4. Modified Cases
- 5.2.5. Plastic Containers
- 5.2.6. Other Type of Packages
- 5.3. Market Analysis, Insights and Forecast - by End-User Application
- 5.3.1. Food
- 5.3.2. Beverage
- 5.3.3. Household Products
- 5.3.4. Other End-User Applications
- 5.4. Market Analysis, Insights and Forecast - by Region
- 5.4.1. North America
- 5.4.2. Europe
- 5.4.3. Asia Pacific
- 5.4.4. Latin America
- 5.4.5. Middle East and Africa
- 5.1. Market Analysis, Insights and Forecast - by Material Type
- 6. Global Retail Ready Packaging Industry Analysis, Insights and Forecast, 2021-2033
- 6.1. Market Analysis, Insights and Forecast - by Material Type
- 6.1.1. Paper and Paperboard
- 6.1.2. Plastics
- 6.1.3. Other Material Types
- 6.2. Market Analysis, Insights and Forecast - by Type of Package
- 6.2.1. Die-cut Display Containers
- 6.2.2. Corrugated Cardboard Boxes
- 6.2.3. Shrink Wrapped Trays
- 6.2.4. Modified Cases
- 6.2.5. Plastic Containers
- 6.2.6. Other Type of Packages
- 6.3. Market Analysis, Insights and Forecast - by End-User Application
- 6.3.1. Food
- 6.3.2. Beverage
- 6.3.3. Household Products
- 6.3.4. Other End-User Applications
- 6.1. Market Analysis, Insights and Forecast - by Material Type
- 7. North America Retail Ready Packaging Industry Analysis, Insights and Forecast, 2020-2032
- 7.1. Market Analysis, Insights and Forecast - by Material Type
- 7.1.1. Paper and Paperboard
- 7.1.2. Plastics
- 7.1.3. Other Material Types
- 7.2. Market Analysis, Insights and Forecast - by Type of Package
- 7.2.1. Die-cut Display Containers
- 7.2.2. Corrugated Cardboard Boxes
- 7.2.3. Shrink Wrapped Trays
- 7.2.4. Modified Cases
- 7.2.5. Plastic Containers
- 7.2.6. Other Type of Packages
- 7.3. Market Analysis, Insights and Forecast - by End-User Application
- 7.3.1. Food
- 7.3.2. Beverage
- 7.3.3. Household Products
- 7.3.4. Other End-User Applications
- 7.1. Market Analysis, Insights and Forecast - by Material Type
- 8. Europe Retail Ready Packaging Industry Analysis, Insights and Forecast, 2020-2032
- 8.1. Market Analysis, Insights and Forecast - by Material Type
- 8.1.1. Paper and Paperboard
- 8.1.2. Plastics
- 8.1.3. Other Material Types
- 8.2. Market Analysis, Insights and Forecast - by Type of Package
- 8.2.1. Die-cut Display Containers
- 8.2.2. Corrugated Cardboard Boxes
- 8.2.3. Shrink Wrapped Trays
- 8.2.4. Modified Cases
- 8.2.5. Plastic Containers
- 8.2.6. Other Type of Packages
- 8.3. Market Analysis, Insights and Forecast - by End-User Application
- 8.3.1. Food
- 8.3.2. Beverage
- 8.3.3. Household Products
- 8.3.4. Other End-User Applications
- 8.1. Market Analysis, Insights and Forecast - by Material Type
- 9. Asia Pacific Retail Ready Packaging Industry Analysis, Insights and Forecast, 2020-2032
- 9.1. Market Analysis, Insights and Forecast - by Material Type
- 9.1.1. Paper and Paperboard
- 9.1.2. Plastics
- 9.1.3. Other Material Types
- 9.2. Market Analysis, Insights and Forecast - by Type of Package
- 9.2.1. Die-cut Display Containers
- 9.2.2. Corrugated Cardboard Boxes
- 9.2.3. Shrink Wrapped Trays
- 9.2.4. Modified Cases
- 9.2.5. Plastic Containers
- 9.2.6. Other Type of Packages
- 9.3. Market Analysis, Insights and Forecast - by End-User Application
- 9.3.1. Food
- 9.3.2. Beverage
- 9.3.3. Household Products
- 9.3.4. Other End-User Applications
- 9.1. Market Analysis, Insights and Forecast - by Material Type
- 10. Latin America Retail Ready Packaging Industry Analysis, Insights and Forecast, 2020-2032
- 10.1. Market Analysis, Insights and Forecast - by Material Type
- 10.1.1. Paper and Paperboard
- 10.1.2. Plastics
- 10.1.3. Other Material Types
- 10.2. Market Analysis, Insights and Forecast - by Type of Package
- 10.2.1. Die-cut Display Containers
- 10.2.2. Corrugated Cardboard Boxes
- 10.2.3. Shrink Wrapped Trays
- 10.2.4. Modified Cases
- 10.2.5. Plastic Containers
- 10.2.6. Other Type of Packages
- 10.3. Market Analysis, Insights and Forecast - by End-User Application
- 10.3.1. Food
- 10.3.2. Beverage
- 10.3.3. Household Products
- 10.3.4. Other End-User Applications
- 10.1. Market Analysis, Insights and Forecast - by Material Type
- 11. Middle East and Africa Retail Ready Packaging Industry Analysis, Insights and Forecast, 2020-2032
- 11.1. Market Analysis, Insights and Forecast - by Material Type
- 11.1.1. Paper and Paperboard
- 11.1.2. Plastics
- 11.1.3. Other Material Types
- 11.2. Market Analysis, Insights and Forecast - by Type of Package
- 11.2.1. Die-cut Display Containers
- 11.2.2. Corrugated Cardboard Boxes
- 11.2.3. Shrink Wrapped Trays
- 11.2.4. Modified Cases
- 11.2.5. Plastic Containers
- 11.2.6. Other Type of Packages
- 11.3. Market Analysis, Insights and Forecast - by End-User Application
- 11.3.1. Food
- 11.3.2. Beverage
- 11.3.3. Household Products
- 11.3.4. Other End-User Applications
- 11.1. Market Analysis, Insights and Forecast - by Material Type
- 12. Competitive Analysis
- 12.1. Company Profiles
- 12.1.1 WestRock Company*List Not Exhaustive
- 12.1.1.1. Company Overview
- 12.1.1.2. Products
- 12.1.1.3. Company Financials
- 12.1.1.4. SWOT Analysis
- 12.1.2 STI Group
- 12.1.2.1. Company Overview
- 12.1.2.2. Products
- 12.1.2.3. Company Financials
- 12.1.2.4. SWOT Analysis
- 12.1.3 Vanguard Packaging Incorporated
- 12.1.3.1. Company Overview
- 12.1.3.2. Products
- 12.1.3.3. Company Financials
- 12.1.3.4. SWOT Analysis
- 12.1.4 Weedon Group
- 12.1.4.1. Company Overview
- 12.1.4.2. Products
- 12.1.4.3. Company Financials
- 12.1.4.4. SWOT Analysis
- 12.1.5 Smurfit Kappa Group
- 12.1.5.1. Company Overview
- 12.1.5.2. Products
- 12.1.5.3. Company Financials
- 12.1.5.4. SWOT Analysis
- 12.1.6 Caps Cases Limited
- 12.1.6.1. Company Overview
- 12.1.6.2. Products
- 12.1.6.3. Company Financials
- 12.1.6.4. SWOT Analysis
- 12.1.7 Cardboard Box Company
- 12.1.7.1. Company Overview
- 12.1.7.2. Products
- 12.1.7.3. Company Financials
- 12.1.7.4. SWOT Analysis
- 12.1.8 DS Smith PLC
- 12.1.8.1. Company Overview
- 12.1.8.2. Products
- 12.1.8.3. Company Financials
- 12.1.8.4. SWOT Analysis
- 12.1.9 Mondi Group
- 12.1.9.1. Company Overview
- 12.1.9.2. Products
- 12.1.9.3. Company Financials
- 12.1.9.4. SWOT Analysis
- 12.1.10 International Paper Company
- 12.1.10.1. Company Overview
- 12.1.10.2. Products
- 12.1.10.3. Company Financials
- 12.1.10.4. SWOT Analysis
- 12.1.1 WestRock Company*List Not Exhaustive
- 12.2. Market Entropy
- 12.2.1 Company's Key Areas Served
- 12.2.2 Recent Developments
- 12.3. Company Market Share Analysis 2025
- 12.3.1 Top 5 Companies Market Share Analysis
- 12.3.2 Top 3 Companies Market Share Analysis
- 12.4. List of Potential Customers
- 13. Research Methodology
List of Figures
- Figure 1: Global Retail Ready Packaging Industry Revenue Breakdown (billion, %) by Region 2025 & 2033
- Figure 2: North America Retail Ready Packaging Industry Revenue (billion), by Material Type 2025 & 2033
- Figure 3: North America Retail Ready Packaging Industry Revenue Share (%), by Material Type 2025 & 2033
- Figure 4: North America Retail Ready Packaging Industry Revenue (billion), by Type of Package 2025 & 2033
- Figure 5: North America Retail Ready Packaging Industry Revenue Share (%), by Type of Package 2025 & 2033
- Figure 6: North America Retail Ready Packaging Industry Revenue (billion), by End-User Application 2025 & 2033
- Figure 7: North America Retail Ready Packaging Industry Revenue Share (%), by End-User Application 2025 & 2033
- Figure 8: North America Retail Ready Packaging Industry Revenue (billion), by Country 2025 & 2033
- Figure 9: North America Retail Ready Packaging Industry Revenue Share (%), by Country 2025 & 2033
- Figure 10: Europe Retail Ready Packaging Industry Revenue (billion), by Material Type 2025 & 2033
- Figure 11: Europe Retail Ready Packaging Industry Revenue Share (%), by Material Type 2025 & 2033
- Figure 12: Europe Retail Ready Packaging Industry Revenue (billion), by Type of Package 2025 & 2033
- Figure 13: Europe Retail Ready Packaging Industry Revenue Share (%), by Type of Package 2025 & 2033
- Figure 14: Europe Retail Ready Packaging Industry Revenue (billion), by End-User Application 2025 & 2033
- Figure 15: Europe Retail Ready Packaging Industry Revenue Share (%), by End-User Application 2025 & 2033
- Figure 16: Europe Retail Ready Packaging Industry Revenue (billion), by Country 2025 & 2033
- Figure 17: Europe Retail Ready Packaging Industry Revenue Share (%), by Country 2025 & 2033
- Figure 18: Asia Pacific Retail Ready Packaging Industry Revenue (billion), by Material Type 2025 & 2033
- Figure 19: Asia Pacific Retail Ready Packaging Industry Revenue Share (%), by Material Type 2025 & 2033
- Figure 20: Asia Pacific Retail Ready Packaging Industry Revenue (billion), by Type of Package 2025 & 2033
- Figure 21: Asia Pacific Retail Ready Packaging Industry Revenue Share (%), by Type of Package 2025 & 2033
- Figure 22: Asia Pacific Retail Ready Packaging Industry Revenue (billion), by End-User Application 2025 & 2033
- Figure 23: Asia Pacific Retail Ready Packaging Industry Revenue Share (%), by End-User Application 2025 & 2033
- Figure 24: Asia Pacific Retail Ready Packaging Industry Revenue (billion), by Country 2025 & 2033
- Figure 25: Asia Pacific Retail Ready Packaging Industry Revenue Share (%), by Country 2025 & 2033
- Figure 26: Latin America Retail Ready Packaging Industry Revenue (billion), by Material Type 2025 & 2033
- Figure 27: Latin America Retail Ready Packaging Industry Revenue Share (%), by Material Type 2025 & 2033
- Figure 28: Latin America Retail Ready Packaging Industry Revenue (billion), by Type of Package 2025 & 2033
- Figure 29: Latin America Retail Ready Packaging Industry Revenue Share (%), by Type of Package 2025 & 2033
- Figure 30: Latin America Retail Ready Packaging Industry Revenue (billion), by End-User Application 2025 & 2033
- Figure 31: Latin America Retail Ready Packaging Industry Revenue Share (%), by End-User Application 2025 & 2033
- Figure 32: Latin America Retail Ready Packaging Industry Revenue (billion), by Country 2025 & 2033
- Figure 33: Latin America Retail Ready Packaging Industry Revenue Share (%), by Country 2025 & 2033
- Figure 34: Middle East and Africa Retail Ready Packaging Industry Revenue (billion), by Material Type 2025 & 2033
- Figure 35: Middle East and Africa Retail Ready Packaging Industry Revenue Share (%), by Material Type 2025 & 2033
- Figure 36: Middle East and Africa Retail Ready Packaging Industry Revenue (billion), by Type of Package 2025 & 2033
- Figure 37: Middle East and Africa Retail Ready Packaging Industry Revenue Share (%), by Type of Package 2025 & 2033
- Figure 38: Middle East and Africa Retail Ready Packaging Industry Revenue (billion), by End-User Application 2025 & 2033
- Figure 39: Middle East and Africa Retail Ready Packaging Industry Revenue Share (%), by End-User Application 2025 & 2033
- Figure 40: Middle East and Africa Retail Ready Packaging Industry Revenue (billion), by Country 2025 & 2033
- Figure 41: Middle East and Africa Retail Ready Packaging Industry Revenue Share (%), by Country 2025 & 2033
List of Tables
- Table 1: Global Retail Ready Packaging Industry Revenue billion Forecast, by Material Type 2020 & 2033
- Table 2: Global Retail Ready Packaging Industry Revenue billion Forecast, by Type of Package 2020 & 2033
- Table 3: Global Retail Ready Packaging Industry Revenue billion Forecast, by End-User Application 2020 & 2033
- Table 4: Global Retail Ready Packaging Industry Revenue billion Forecast, by Region 2020 & 2033
- Table 5: Global Retail Ready Packaging Industry Revenue billion Forecast, by Material Type 2020 & 2033
- Table 6: Global Retail Ready Packaging Industry Revenue billion Forecast, by Type of Package 2020 & 2033
- Table 7: Global Retail Ready Packaging Industry Revenue billion Forecast, by End-User Application 2020 & 2033
- Table 8: Global Retail Ready Packaging Industry Revenue billion Forecast, by Country 2020 & 2033
- Table 9: United States Retail Ready Packaging Industry Revenue (billion) Forecast, by Application 2020 & 2033
- Table 10: Canada Retail Ready Packaging Industry Revenue (billion) Forecast, by Application 2020 & 2033
- Table 11: Global Retail Ready Packaging Industry Revenue billion Forecast, by Material Type 2020 & 2033
- Table 12: Global Retail Ready Packaging Industry Revenue billion Forecast, by Type of Package 2020 & 2033
- Table 13: Global Retail Ready Packaging Industry Revenue billion Forecast, by End-User Application 2020 & 2033
- Table 14: Global Retail Ready Packaging Industry Revenue billion Forecast, by Country 2020 & 2033
- Table 15: Germany Retail Ready Packaging Industry Revenue (billion) Forecast, by Application 2020 & 2033
- Table 16: United Kingdoms Retail Ready Packaging Industry Revenue (billion) Forecast, by Application 2020 & 2033
- Table 17: France Retail Ready Packaging Industry Revenue (billion) Forecast, by Application 2020 & 2033
- Table 18: Rest of the Europe Retail Ready Packaging Industry Revenue (billion) Forecast, by Application 2020 & 2033
- Table 19: Global Retail Ready Packaging Industry Revenue billion Forecast, by Material Type 2020 & 2033
- Table 20: Global Retail Ready Packaging Industry Revenue billion Forecast, by Type of Package 2020 & 2033
- Table 21: Global Retail Ready Packaging Industry Revenue billion Forecast, by End-User Application 2020 & 2033
- Table 22: Global Retail Ready Packaging Industry Revenue billion Forecast, by Country 2020 & 2033
- Table 23: China Retail Ready Packaging Industry Revenue (billion) Forecast, by Application 2020 & 2033
- Table 24: India Retail Ready Packaging Industry Revenue (billion) Forecast, by Application 2020 & 2033
- Table 25: Japan Retail Ready Packaging Industry Revenue (billion) Forecast, by Application 2020 & 2033
- Table 26: Rest of the Asia Pacific Retail Ready Packaging Industry Revenue (billion) Forecast, by Application 2020 & 2033
- Table 27: Global Retail Ready Packaging Industry Revenue billion Forecast, by Material Type 2020 & 2033
- Table 28: Global Retail Ready Packaging Industry Revenue billion Forecast, by Type of Package 2020 & 2033
- Table 29: Global Retail Ready Packaging Industry Revenue billion Forecast, by End-User Application 2020 & 2033
- Table 30: Global Retail Ready Packaging Industry Revenue billion Forecast, by Country 2020 & 2033
- Table 31: Global Retail Ready Packaging Industry Revenue billion Forecast, by Material Type 2020 & 2033
- Table 32: Global Retail Ready Packaging Industry Revenue billion Forecast, by Type of Package 2020 & 2033
- Table 33: Global Retail Ready Packaging Industry Revenue billion Forecast, by End-User Application 2020 & 2033
- Table 34: Global Retail Ready Packaging Industry Revenue billion Forecast, by Country 2020 & 2033
Frequently Asked Questions
1. What is the projected Compound Annual Growth Rate (CAGR) of the Retail Ready Packaging Industry?
The projected CAGR is approximately 5.7%.
2. Which companies are prominent players in the Retail Ready Packaging Industry?
Key companies in the market include WestRock Company*List Not Exhaustive, STI Group, Vanguard Packaging Incorporated, Weedon Group, Smurfit Kappa Group, Caps Cases Limited, Cardboard Box Company, DS Smith PLC, Mondi Group, International Paper Company.
3. What are the main segments of the Retail Ready Packaging Industry?
The market segments include Material Type, Type of Package, End-User Application.
4. Can you provide details about the market size?
The market size is estimated to be USD 78.31 billion as of 2022.
5. What are some drivers contributing to market growth?
Increasing Consumer Interest Towards Convenient and Eco-friendly Shopping Solutions; Growing Need for Streamlining the Supply Chain Process.
6. What are the notable trends driving market growth?
Die-cut Display Container to Hold Significant Share.
7. Are there any restraints impacting market growth?
Investment in R&D Activities and Additional Capital Expenditure.
8. Can you provide examples of recent developments in the market?
October 2022: At the 2022 PACK EXPO, ORBIS Corporation, a global pioneer in reusable packaging, highlighted the importance integrated reusable packaging solutions play in enhancing supply chain effectiveness and sustainability. By enabling a quick and simple transfer of product from the truck directly to the store floor, the XpressBulk retail-ready merchandising trays offer a sustainable, effective solution for the manual shelf replenishment process.
9. What pricing options are available for accessing the report?
Pricing options include single-user, multi-user, and enterprise licenses priced at USD 4750, USD 5250, and USD 8750 respectively.
10. Is the market size provided in terms of value or volume?
The market size is provided in terms of value, measured in billion.
11. Are there any specific market keywords associated with the report?
Yes, the market keyword associated with the report is "Retail Ready Packaging Industry," which aids in identifying and referencing the specific market segment covered.
12. How do I determine which pricing option suits my needs best?
The pricing options vary based on user requirements and access needs. Individual users may opt for single-user licenses, while businesses requiring broader access may choose multi-user or enterprise licenses for cost-effective access to the report.
13. Are there any additional resources or data provided in the Retail Ready Packaging Industry report?
While the report offers comprehensive insights, it's advisable to review the specific contents or supplementary materials provided to ascertain if additional resources or data are available.
14. How can I stay updated on further developments or reports in the Retail Ready Packaging Industry?
To stay informed about further developments, trends, and reports in the Retail Ready Packaging Industry, consider subscribing to industry newsletters, following relevant companies and organizations, or regularly checking reputable industry news sources and publications.
Methodology
Step 1 - Identification of Relevant Samples Size from Population Database


Step 2 - Approaches for Defining Global Market Size (Value, Volume* & Price*)

Note*: In applicable scenarios
Step 3 - Data Sources
Primary Research
- Web Analytics
- Survey Reports
- Research Institute
- Latest Research Reports
- Opinion Leaders
Secondary Research
- Annual Reports
- White Paper
- Latest Press Release
- Industry Association
- Paid Database
- Investor Presentations

Step 4 - Data Triangulation
Involves using different sources of information in order to increase the validity of a study
These sources are likely to be stakeholders in a program - participants, other researchers, program staff, other community members, and so on.
Then we put all data in single framework & apply various statistical tools to find out the dynamic on the market.
During the analysis stage, feedback from the stakeholder groups would be compared to determine areas of agreement as well as areas of divergence