

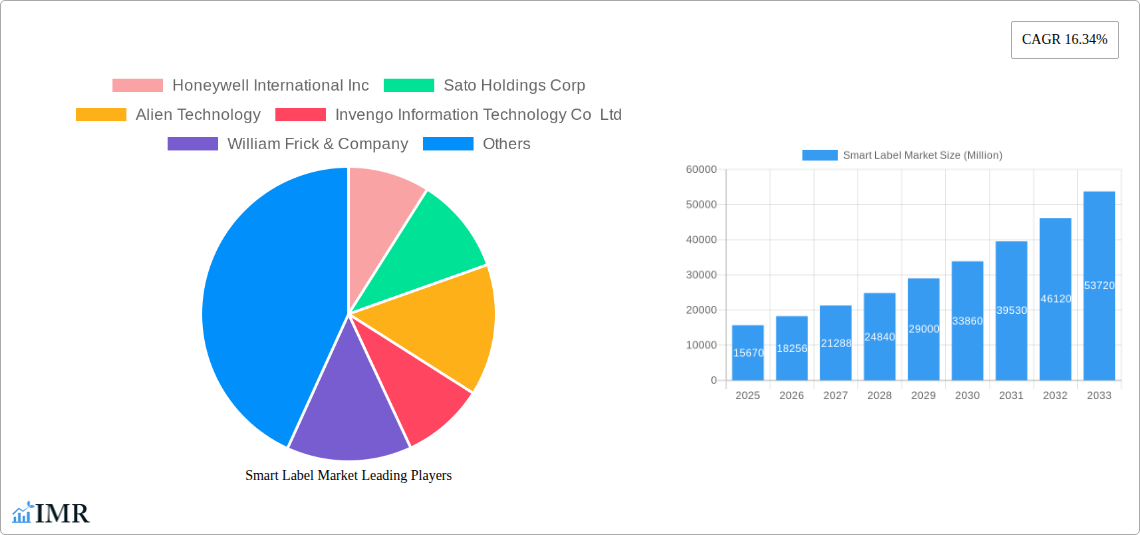
Key Insights
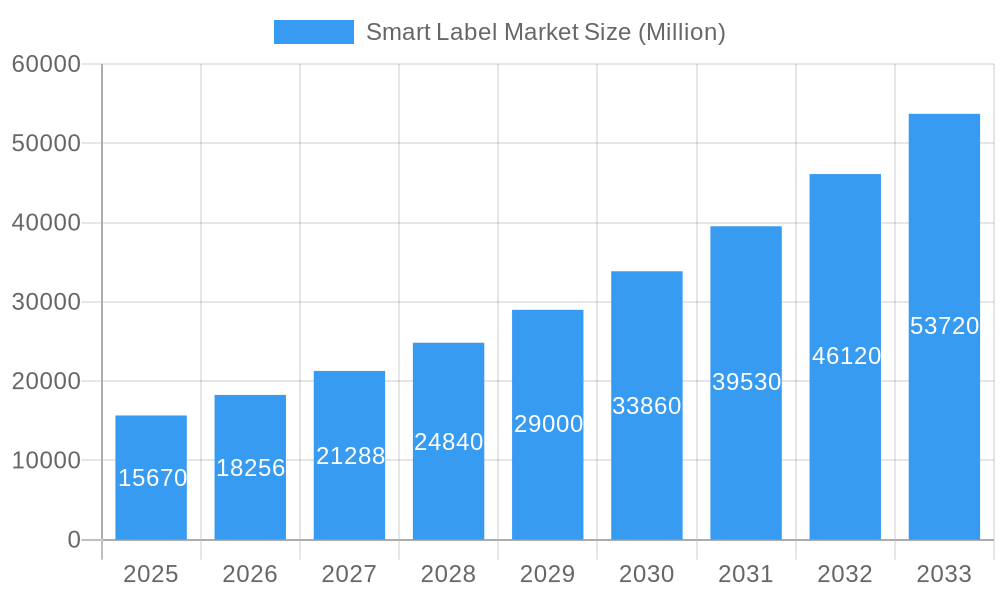
The global smart label market, valued at $15.67 billion in 2025, is poised for robust growth, exhibiting a Compound Annual Growth Rate (CAGR) of 16.34% from 2025 to 2033. This expansion is driven by several key factors. Firstly, the increasing demand for efficient supply chain management across various industries, including retail, healthcare, and logistics, fuels the adoption of smart labels for improved product tracking and inventory control. Secondly, advancements in technology, particularly in RFID (Radio-Frequency Identification) and Electronic Shelf Labels (ESL), are offering enhanced functionalities such as real-time data capture, improved security, and reduced operational costs. The growing adoption of e-commerce and the need for enhanced consumer experiences, through features like product authentication and interactive labels, are also contributing to market growth. Finally, stringent regulatory requirements related to product traceability and counterfeiting in sectors like pharmaceuticals are driving the demand for secure and reliable smart labeling solutions.
Smart Label Market Market Size (In Billion)
The market segmentation reveals significant opportunities across different technologies and end-user industries. While RFID and ESL hold a substantial market share currently, other technologies like NFC (Near Field Communication) and sensing labels are gaining traction, propelled by their unique applications and cost-effectiveness in specific use cases. The retail sector currently dominates the end-user landscape, but the healthcare and pharmaceutical industries present a promising avenue for future growth, driven by the imperative for drug traceability and patient safety. Geographic expansion, particularly in developing economies within Asia-Pacific, offers considerable potential for market expansion as these regions increasingly adopt advanced technologies and improve supply chain infrastructure. Competitive intensity is high, with established players like Honeywell International Inc. and Zebra Technologies Corp. alongside innovative smaller companies driving innovation and market penetration.
Smart Label Market Company Market Share
Smart Label Market: A Comprehensive Report (2019-2033)
This in-depth report provides a comprehensive analysis of the Smart Label Market, encompassing market dynamics, growth trends, regional segmentation, product landscape, key players, and future outlook. With a study period spanning 2019-2033, a base year of 2025, and a forecast period of 2025-2033, this report offers invaluable insights for industry professionals, investors, and strategic decision-makers. The total market size is projected to reach xx Million units by 2033.
Smart Label Market Market Dynamics & Structure
The Smart Label Market is characterized by moderate concentration, with key players like Honeywell International Inc, Sato Holdings Corp, and Avery Dennison Corporation holding significant market share. Technological innovation, particularly in RFID and Electronic Shelf Labels (ESL), is a primary growth driver. Regulatory frameworks concerning data privacy and supply chain traceability influence market dynamics. Competitive pressures stem from the emergence of innovative solutions and the availability of substitute technologies. The market is segmented by technology (EAS, RFID, Sensing Labels, NFC, ESL) and end-user industries (Retail, Healthcare & Pharmaceutical, Logistics, Manufacturing, Others). M&A activity is expected to increase as companies seek to expand their product portfolios and market reach.
- Market Concentration: Moderately concentrated, with top 5 players holding approximately xx% market share in 2024.
- Technological Innovation: Significant advancements in RFID, ESL, and sensing technologies are driving market expansion.
- Regulatory Landscape: Data privacy regulations and supply chain transparency mandates impact market adoption.
- Competitive Substitutes: Traditional labeling methods and emerging technologies pose competitive challenges.
- End-User Demographics: The retail and healthcare sectors are primary drivers, with increasing adoption across other industries.
- M&A Activity: An estimated xx M&A deals were recorded in the historical period (2019-2024).
Smart Label Market Growth Trends & Insights
The Smart Label Market has exhibited robust growth over the historical period (2019-2024), with a CAGR of xx%. This growth is attributed to the increasing demand for efficient inventory management, enhanced product traceability, and improved consumer experiences. The adoption rate of smart labels is accelerating across various industries, driven by technological advancements and falling prices. Technological disruptions, such as the integration of IoT and AI, are further fueling market growth. Consumer behavior shifts toward personalized experiences and increased product information access underpin market expansion. Market penetration is expected to reach xx% by 2033.
Dominant Regions, Countries, or Segments in Smart Label Market
North America and Europe currently dominate the Smart Label Market, driven by high technology adoption rates and robust retail and healthcare sectors. However, Asia-Pacific is projected to experience the fastest growth in the forecast period, fueled by increasing manufacturing activity and expanding e-commerce.
By Technology:
- RFID: The largest segment, holding a market share of approximately xx% in 2024, due to its versatility and scalability.
- ESL: Experiencing rapid growth due to its application in dynamic pricing and inventory management.
By End-User Industry:
- Retail: The dominant end-user sector, driving demand for inventory tracking and anti-theft solutions.
- Healthcare & Pharmaceutical: Growing adoption driven by stringent regulations and the need for enhanced product traceability.
Key Drivers:
- Favorable economic policies supporting technological advancement.
- Robust infrastructure supporting digital adoption.
Smart Label Market Product Landscape
Smart labels are evolving from simple barcodes to sophisticated solutions incorporating RFID, NFC, and sensing technologies. These labels offer improved data storage capacity, enhanced security features, and real-time data tracking capabilities. Recent innovations focus on miniaturization, improved energy efficiency, and integration with cloud-based platforms. Unique selling propositions include enhanced supply chain visibility, reduced operational costs, and improved consumer engagement.
Key Drivers, Barriers & Challenges in Smart Label Market
Key Drivers:
- Increasing demand for efficient supply chain management.
- Growing focus on product traceability and authenticity.
- Technological advancements in RFID, NFC, and sensing technologies.
Key Challenges:
- High initial investment costs associated with implementing smart labeling solutions.
- Concerns over data privacy and security.
- Complexity of integrating smart labels into existing systems. This results in a xx% reduction in adoption rate in some segments.
Emerging Opportunities in Smart Label Market
Emerging opportunities include the integration of smart labels with IoT devices, enabling real-time monitoring and predictive analytics. Expanding into untapped markets, such as agriculture and logistics, presents significant potential. The development of sustainable and biodegradable smart labels addresses environmental concerns. Furthermore, the increasing focus on personalized consumer experiences opens new avenues for innovative applications.
Growth Accelerators in the Smart Label Market Industry
Technological breakthroughs, particularly in low-cost and energy-efficient RFID and sensor technologies, are key growth accelerators. Strategic partnerships between technology providers and end-user industries foster innovation and market expansion. Government initiatives promoting digitalization and supply chain transparency further drive market growth.
Key Players Shaping the Smart Label Market Market
- Honeywell International Inc
- Sato Holdings Corp
- Alien Technology
- Invengo Information Technology Co Ltd
- William Frick & Company
- Scanbuy Inc
- CCL Industries Inc
- Avery Dennison Corporation
- Zebra Technologies Corp
- *List Not Exhaustive
Notable Milestones in Smart Label Market Sector
- March 2023: The Premier League and Avery Dennison collaborated on a new font for Premier League jerseys, enhancing visibility and impacting on and off-field branding.
- February 2023: Danavation Technologies Corp. secured contracts for four new digital smart label installations, expanding its presence in North American retail.
In-Depth Smart Label Market Market Outlook
The Smart Label Market is poised for sustained growth, driven by ongoing technological advancements and increasing demand across diverse industries. Strategic partnerships and investments in R&D will play a pivotal role in shaping the future market landscape. Untapped market segments and innovative applications represent significant opportunities for growth and expansion. The market is expected to reach xx Million units by 2033, representing a substantial increase from its current size.
Smart Label Market Segmentation
-
1. Technology
- 1.1. Electronic Article Surveillance (EAS)
- 1.2. RFID
- 1.3. Sensing Label
- 1.4. NFC
- 1.5. Electronic Shelf Label (ESL)
-
2. End-user Industry
- 2.1. Retail
- 2.2. Healthcare and Pharmaceutical
- 2.3. Logistics
- 2.4. Manufacturing
- 2.5. Other End-user Industries
Smart Label Market Segmentation By Geography
-
1. North America
- 1.1. United States
- 1.2. Canada
-
2. Europe
- 2.1. United Kingdom
- 2.2. Germany
- 2.3. France
- 2.4. Rest of Europe
-
3. Asia Pacific
- 3.1. China
- 3.2. India
- 3.3. Japan
- 3.4. South Korea
- 3.5. Rest of Asia Pacific
- 4. Latin America
- 5. Middle East and Africa
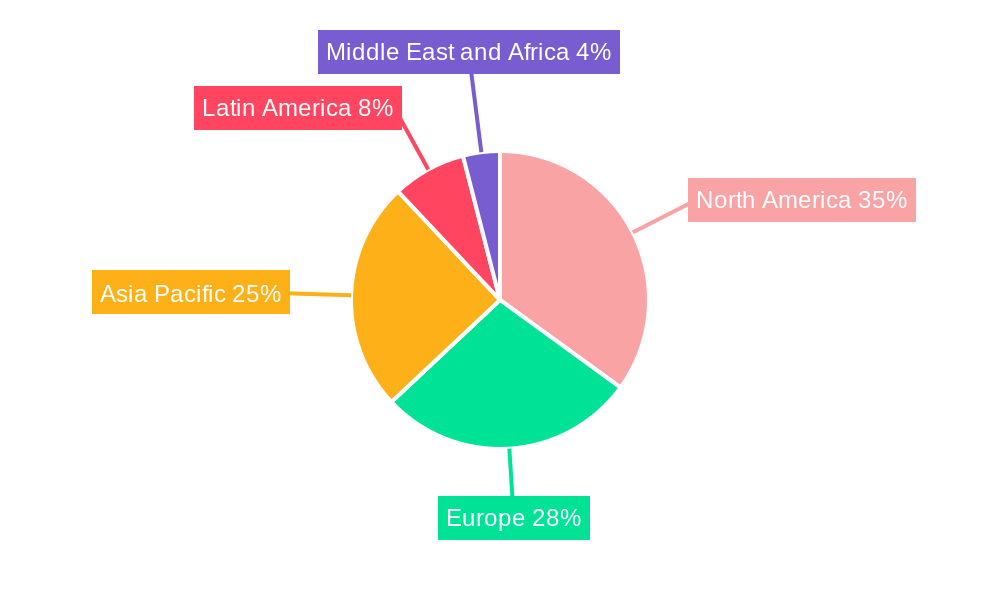
Smart Label Market Regional Market Share
Geographic Coverage of Smart Label Market
Smart Label Market REPORT HIGHLIGHTS
| Aspects | Details |
|---|---|
| Study Period | 2020-2034 |
| Base Year | 2025 |
| Estimated Year | 2026 |
| Forecast Period | 2026-2034 |
| Historical Period | 2020-2025 |
| Growth Rate | CAGR of 16.34% from 2020-2034 |
| Segmentation |
|
Table of Contents
- 1. Introduction
- 1.1. Research Scope
- 1.2. Market Segmentation
- 1.3. Research Objective
- 1.4. Definitions and Assumptions
- 2. Executive Summary
- 2.1. Market Snapshot
- 3. Market Dynamics
- 3.1. Market Drivers
- 3.2. Market Restrains
- 3.3. Market Trends
- 3.4. Market Opportunities
- 4. Market Factor Analysis
- 4.1. Porters Five Forces
- 4.1.1. Bargaining Power of Suppliers
- 4.1.2. Bargaining Power of Buyers
- 4.1.3. Threat of New Entrants
- 4.1.4. Threat of Substitutes
- 4.1.5. Competitive Rivalry
- 4.2. PESTEL analysis
- 4.3. BCG Analysis
- 4.3.1. Stars (High Growth, High Market Share)
- 4.3.2. Cash Cows (Low Growth, High Market Share)
- 4.3.3. Question Mark (High Growth, Low Market Share)
- 4.3.4. Dogs (Low Growth, Low Market Share)
- 4.4. Ansoff Matrix Analysis
- 4.5. Supply Chain Analysis
- 4.6. Regulatory Landscape
- 4.7. Current Market Potential and Opportunity Assessment (TAM–SAM–SOM Framework)
- 4.8. IMR Analyst Note
- 4.1. Porters Five Forces
- 5. Market Analysis, Insights and Forecast 2021-2033
- 5.1. Market Analysis, Insights and Forecast - by Technology
- 5.1.1. Electronic Article Surveillance (EAS)
- 5.1.2. RFID
- 5.1.3. Sensing Label
- 5.1.4. NFC
- 5.1.5. Electronic Shelf Label (ESL)
- 5.2. Market Analysis, Insights and Forecast - by End-user Industry
- 5.2.1. Retail
- 5.2.2. Healthcare and Pharmaceutical
- 5.2.3. Logistics
- 5.2.4. Manufacturing
- 5.2.5. Other End-user Industries
- 5.3. Market Analysis, Insights and Forecast - by Region
- 5.3.1. North America
- 5.3.2. Europe
- 5.3.3. Asia Pacific
- 5.3.4. Latin America
- 5.3.5. Middle East and Africa
- 5.1. Market Analysis, Insights and Forecast - by Technology
- 6. Global Smart Label Market Analysis, Insights and Forecast, 2021-2033
- 6.1. Market Analysis, Insights and Forecast - by Technology
- 6.1.1. Electronic Article Surveillance (EAS)
- 6.1.2. RFID
- 6.1.3. Sensing Label
- 6.1.4. NFC
- 6.1.5. Electronic Shelf Label (ESL)
- 6.2. Market Analysis, Insights and Forecast - by End-user Industry
- 6.2.1. Retail
- 6.2.2. Healthcare and Pharmaceutical
- 6.2.3. Logistics
- 6.2.4. Manufacturing
- 6.2.5. Other End-user Industries
- 6.1. Market Analysis, Insights and Forecast - by Technology
- 7. North America Smart Label Market Analysis, Insights and Forecast, 2020-2032
- 7.1. Market Analysis, Insights and Forecast - by Technology
- 7.1.1. Electronic Article Surveillance (EAS)
- 7.1.2. RFID
- 7.1.3. Sensing Label
- 7.1.4. NFC
- 7.1.5. Electronic Shelf Label (ESL)
- 7.2. Market Analysis, Insights and Forecast - by End-user Industry
- 7.2.1. Retail
- 7.2.2. Healthcare and Pharmaceutical
- 7.2.3. Logistics
- 7.2.4. Manufacturing
- 7.2.5. Other End-user Industries
- 7.1. Market Analysis, Insights and Forecast - by Technology
- 8. Europe Smart Label Market Analysis, Insights and Forecast, 2020-2032
- 8.1. Market Analysis, Insights and Forecast - by Technology
- 8.1.1. Electronic Article Surveillance (EAS)
- 8.1.2. RFID
- 8.1.3. Sensing Label
- 8.1.4. NFC
- 8.1.5. Electronic Shelf Label (ESL)
- 8.2. Market Analysis, Insights and Forecast - by End-user Industry
- 8.2.1. Retail
- 8.2.2. Healthcare and Pharmaceutical
- 8.2.3. Logistics
- 8.2.4. Manufacturing
- 8.2.5. Other End-user Industries
- 8.1. Market Analysis, Insights and Forecast - by Technology
- 9. Asia Pacific Smart Label Market Analysis, Insights and Forecast, 2020-2032
- 9.1. Market Analysis, Insights and Forecast - by Technology
- 9.1.1. Electronic Article Surveillance (EAS)
- 9.1.2. RFID
- 9.1.3. Sensing Label
- 9.1.4. NFC
- 9.1.5. Electronic Shelf Label (ESL)
- 9.2. Market Analysis, Insights and Forecast - by End-user Industry
- 9.2.1. Retail
- 9.2.2. Healthcare and Pharmaceutical
- 9.2.3. Logistics
- 9.2.4. Manufacturing
- 9.2.5. Other End-user Industries
- 9.1. Market Analysis, Insights and Forecast - by Technology
- 10. Latin America Smart Label Market Analysis, Insights and Forecast, 2020-2032
- 10.1. Market Analysis, Insights and Forecast - by Technology
- 10.1.1. Electronic Article Surveillance (EAS)
- 10.1.2. RFID
- 10.1.3. Sensing Label
- 10.1.4. NFC
- 10.1.5. Electronic Shelf Label (ESL)
- 10.2. Market Analysis, Insights and Forecast - by End-user Industry
- 10.2.1. Retail
- 10.2.2. Healthcare and Pharmaceutical
- 10.2.3. Logistics
- 10.2.4. Manufacturing
- 10.2.5. Other End-user Industries
- 10.1. Market Analysis, Insights and Forecast - by Technology
- 11. Middle East and Africa Smart Label Market Analysis, Insights and Forecast, 2020-2032
- 11.1. Market Analysis, Insights and Forecast - by Technology
- 11.1.1. Electronic Article Surveillance (EAS)
- 11.1.2. RFID
- 11.1.3. Sensing Label
- 11.1.4. NFC
- 11.1.5. Electronic Shelf Label (ESL)
- 11.2. Market Analysis, Insights and Forecast - by End-user Industry
- 11.2.1. Retail
- 11.2.2. Healthcare and Pharmaceutical
- 11.2.3. Logistics
- 11.2.4. Manufacturing
- 11.2.5. Other End-user Industries
- 11.1. Market Analysis, Insights and Forecast - by Technology
- 12. Competitive Analysis
- 12.1. Company Profiles
- 12.1.1 Honeywell International Inc
- 12.1.1.1. Company Overview
- 12.1.1.2. Products
- 12.1.1.3. Company Financials
- 12.1.1.4. SWOT Analysis
- 12.1.2 Sato Holdings Corp
- 12.1.2.1. Company Overview
- 12.1.2.2. Products
- 12.1.2.3. Company Financials
- 12.1.2.4. SWOT Analysis
- 12.1.3 Alien Technology
- 12.1.3.1. Company Overview
- 12.1.3.2. Products
- 12.1.3.3. Company Financials
- 12.1.3.4. SWOT Analysis
- 12.1.4 Invengo Information Technology Co Ltd
- 12.1.4.1. Company Overview
- 12.1.4.2. Products
- 12.1.4.3. Company Financials
- 12.1.4.4. SWOT Analysis
- 12.1.5 William Frick & Company
- 12.1.5.1. Company Overview
- 12.1.5.2. Products
- 12.1.5.3. Company Financials
- 12.1.5.4. SWOT Analysis
- 12.1.6 Scanbuy Inc
- 12.1.6.1. Company Overview
- 12.1.6.2. Products
- 12.1.6.3. Company Financials
- 12.1.6.4. SWOT Analysis
- 12.1.7 CCL Industries Inc
- 12.1.7.1. Company Overview
- 12.1.7.2. Products
- 12.1.7.3. Company Financials
- 12.1.7.4. SWOT Analysis
- 12.1.8 Avery Dennison Corporation
- 12.1.8.1. Company Overview
- 12.1.8.2. Products
- 12.1.8.3. Company Financials
- 12.1.8.4. SWOT Analysis
- 12.1.9 Zebra Technologies Corp *List Not Exhaustive
- 12.1.9.1. Company Overview
- 12.1.9.2. Products
- 12.1.9.3. Company Financials
- 12.1.9.4. SWOT Analysis
- 12.1.1 Honeywell International Inc
- 12.2. Market Entropy
- 12.2.1 Company's Key Areas Served
- 12.2.2 Recent Developments
- 12.3. Company Market Share Analysis 2025
- 12.3.1 Top 5 Companies Market Share Analysis
- 12.3.2 Top 3 Companies Market Share Analysis
- 12.4. List of Potential Customers
- 13. Research Methodology
List of Figures
- Figure 1: Global Smart Label Market Revenue Breakdown (Million, %) by Region 2025 & 2033
- Figure 2: North America Smart Label Market Revenue (Million), by Technology 2025 & 2033
- Figure 3: North America Smart Label Market Revenue Share (%), by Technology 2025 & 2033
- Figure 4: North America Smart Label Market Revenue (Million), by End-user Industry 2025 & 2033
- Figure 5: North America Smart Label Market Revenue Share (%), by End-user Industry 2025 & 2033
- Figure 6: North America Smart Label Market Revenue (Million), by Country 2025 & 2033
- Figure 7: North America Smart Label Market Revenue Share (%), by Country 2025 & 2033
- Figure 8: Europe Smart Label Market Revenue (Million), by Technology 2025 & 2033
- Figure 9: Europe Smart Label Market Revenue Share (%), by Technology 2025 & 2033
- Figure 10: Europe Smart Label Market Revenue (Million), by End-user Industry 2025 & 2033
- Figure 11: Europe Smart Label Market Revenue Share (%), by End-user Industry 2025 & 2033
- Figure 12: Europe Smart Label Market Revenue (Million), by Country 2025 & 2033
- Figure 13: Europe Smart Label Market Revenue Share (%), by Country 2025 & 2033
- Figure 14: Asia Pacific Smart Label Market Revenue (Million), by Technology 2025 & 2033
- Figure 15: Asia Pacific Smart Label Market Revenue Share (%), by Technology 2025 & 2033
- Figure 16: Asia Pacific Smart Label Market Revenue (Million), by End-user Industry 2025 & 2033
- Figure 17: Asia Pacific Smart Label Market Revenue Share (%), by End-user Industry 2025 & 2033
- Figure 18: Asia Pacific Smart Label Market Revenue (Million), by Country 2025 & 2033
- Figure 19: Asia Pacific Smart Label Market Revenue Share (%), by Country 2025 & 2033
- Figure 20: Latin America Smart Label Market Revenue (Million), by Technology 2025 & 2033
- Figure 21: Latin America Smart Label Market Revenue Share (%), by Technology 2025 & 2033
- Figure 22: Latin America Smart Label Market Revenue (Million), by End-user Industry 2025 & 2033
- Figure 23: Latin America Smart Label Market Revenue Share (%), by End-user Industry 2025 & 2033
- Figure 24: Latin America Smart Label Market Revenue (Million), by Country 2025 & 2033
- Figure 25: Latin America Smart Label Market Revenue Share (%), by Country 2025 & 2033
- Figure 26: Middle East and Africa Smart Label Market Revenue (Million), by Technology 2025 & 2033
- Figure 27: Middle East and Africa Smart Label Market Revenue Share (%), by Technology 2025 & 2033
- Figure 28: Middle East and Africa Smart Label Market Revenue (Million), by End-user Industry 2025 & 2033
- Figure 29: Middle East and Africa Smart Label Market Revenue Share (%), by End-user Industry 2025 & 2033
- Figure 30: Middle East and Africa Smart Label Market Revenue (Million), by Country 2025 & 2033
- Figure 31: Middle East and Africa Smart Label Market Revenue Share (%), by Country 2025 & 2033
List of Tables
- Table 1: Global Smart Label Market Revenue Million Forecast, by Technology 2020 & 2033
- Table 2: Global Smart Label Market Revenue Million Forecast, by End-user Industry 2020 & 2033
- Table 3: Global Smart Label Market Revenue Million Forecast, by Region 2020 & 2033
- Table 4: Global Smart Label Market Revenue Million Forecast, by Technology 2020 & 2033
- Table 5: Global Smart Label Market Revenue Million Forecast, by End-user Industry 2020 & 2033
- Table 6: Global Smart Label Market Revenue Million Forecast, by Country 2020 & 2033
- Table 7: United States Smart Label Market Revenue (Million) Forecast, by Application 2020 & 2033
- Table 8: Canada Smart Label Market Revenue (Million) Forecast, by Application 2020 & 2033
- Table 9: Global Smart Label Market Revenue Million Forecast, by Technology 2020 & 2033
- Table 10: Global Smart Label Market Revenue Million Forecast, by End-user Industry 2020 & 2033
- Table 11: Global Smart Label Market Revenue Million Forecast, by Country 2020 & 2033
- Table 12: United Kingdom Smart Label Market Revenue (Million) Forecast, by Application 2020 & 2033
- Table 13: Germany Smart Label Market Revenue (Million) Forecast, by Application 2020 & 2033
- Table 14: France Smart Label Market Revenue (Million) Forecast, by Application 2020 & 2033
- Table 15: Rest of Europe Smart Label Market Revenue (Million) Forecast, by Application 2020 & 2033
- Table 16: Global Smart Label Market Revenue Million Forecast, by Technology 2020 & 2033
- Table 17: Global Smart Label Market Revenue Million Forecast, by End-user Industry 2020 & 2033
- Table 18: Global Smart Label Market Revenue Million Forecast, by Country 2020 & 2033
- Table 19: China Smart Label Market Revenue (Million) Forecast, by Application 2020 & 2033
- Table 20: India Smart Label Market Revenue (Million) Forecast, by Application 2020 & 2033
- Table 21: Japan Smart Label Market Revenue (Million) Forecast, by Application 2020 & 2033
- Table 22: South Korea Smart Label Market Revenue (Million) Forecast, by Application 2020 & 2033
- Table 23: Rest of Asia Pacific Smart Label Market Revenue (Million) Forecast, by Application 2020 & 2033
- Table 24: Global Smart Label Market Revenue Million Forecast, by Technology 2020 & 2033
- Table 25: Global Smart Label Market Revenue Million Forecast, by End-user Industry 2020 & 2033
- Table 26: Global Smart Label Market Revenue Million Forecast, by Country 2020 & 2033
- Table 27: Global Smart Label Market Revenue Million Forecast, by Technology 2020 & 2033
- Table 28: Global Smart Label Market Revenue Million Forecast, by End-user Industry 2020 & 2033
- Table 29: Global Smart Label Market Revenue Million Forecast, by Country 2020 & 2033
Frequently Asked Questions
1. What is the projected Compound Annual Growth Rate (CAGR) of the Smart Label Market?
The projected CAGR is approximately 16.34%.
2. Which companies are prominent players in the Smart Label Market?
Key companies in the market include Honeywell International Inc, Sato Holdings Corp, Alien Technology, Invengo Information Technology Co Ltd, William Frick & Company, Scanbuy Inc, CCL Industries Inc, Avery Dennison Corporation, Zebra Technologies Corp *List Not Exhaustive.
3. What are the main segments of the Smart Label Market?
The market segments include Technology, End-user Industry.
4. Can you provide details about the market size?
The market size is estimated to be USD 15.67 Million as of 2022.
5. What are some drivers contributing to market growth?
Increased Demand for Security and Tracking Solutions.
6. What are the notable trends driving market growth?
Retail End User Industry to Hold Significant Market Share.
7. Are there any restraints impacting market growth?
Lack of Ubiquitous Standards. Safety Concerns. and Inability to withstand Harsh Climatic Conditions.
8. Can you provide examples of recent developments in the market?
March 2023: The Premier League and Avery Dennison collaborated on the new font, which is only the fourth makeover in Premier League history. The new font has enhanced visibility and impacts both on and off the pitch due to an increase in number height and the incorporation of the Premier League's unique graphic design. The new numbers, names, and sleeve badges will be available in the spring, following the release of each Premier League club's 2023-24 season shirt.
9. What pricing options are available for accessing the report?
Pricing options include single-user, multi-user, and enterprise licenses priced at USD 4750, USD 5250, and USD 8750 respectively.
10. Is the market size provided in terms of value or volume?
The market size is provided in terms of value, measured in Million.
11. Are there any specific market keywords associated with the report?
Yes, the market keyword associated with the report is "Smart Label Market," which aids in identifying and referencing the specific market segment covered.
12. How do I determine which pricing option suits my needs best?
The pricing options vary based on user requirements and access needs. Individual users may opt for single-user licenses, while businesses requiring broader access may choose multi-user or enterprise licenses for cost-effective access to the report.
13. Are there any additional resources or data provided in the Smart Label Market report?
While the report offers comprehensive insights, it's advisable to review the specific contents or supplementary materials provided to ascertain if additional resources or data are available.
14. How can I stay updated on further developments or reports in the Smart Label Market?
To stay informed about further developments, trends, and reports in the Smart Label Market, consider subscribing to industry newsletters, following relevant companies and organizations, or regularly checking reputable industry news sources and publications.
Methodology
Step 1 - Identification of Relevant Samples Size from Population Database


Step 2 - Approaches for Defining Global Market Size (Value, Volume* & Price*)

Note*: In applicable scenarios
Step 3 - Data Sources
Primary Research
- Web Analytics
- Survey Reports
- Research Institute
- Latest Research Reports
- Opinion Leaders
Secondary Research
- Annual Reports
- White Paper
- Latest Press Release
- Industry Association
- Paid Database
- Investor Presentations

Step 4 - Data Triangulation
Involves using different sources of information in order to increase the validity of a study
These sources are likely to be stakeholders in a program - participants, other researchers, program staff, other community members, and so on.
Then we put all data in single framework & apply various statistical tools to find out the dynamic on the market.
During the analysis stage, feedback from the stakeholder groups would be compared to determine areas of agreement as well as areas of divergence