

Key Insights
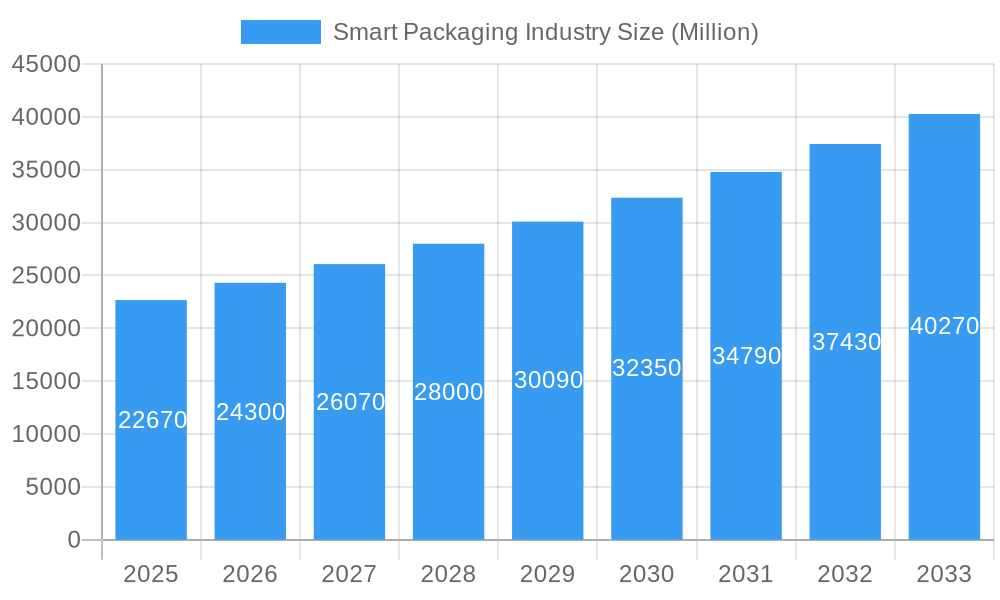
The smart packaging market, valued at $22.67 billion in 2025, is projected to experience robust growth, driven by increasing demand for enhanced product traceability, improved food safety, and reduced waste. A Compound Annual Growth Rate (CAGR) of 7.12% from 2025 to 2033 indicates a significant expansion of this market. Key drivers include the rising adoption of e-commerce, which necessitates secure and efficient packaging solutions, coupled with growing consumer awareness of sustainability and product authenticity. Technological advancements, such as the integration of RFID and sensors into packaging, are enabling real-time monitoring of product conditions throughout the supply chain. This facilitates better inventory management, minimizes spoilage, and enhances overall efficiency. The food and beverage sector currently dominates the market, fueled by the need to extend shelf life and maintain product quality, followed by the healthcare and personal care sectors, which benefit from enhanced tamper evidence and improved medication management. Geographical expansion is also a significant factor, with North America and Europe leading the market currently, while Asia-Pacific is expected to witness substantial growth due to increasing consumer spending and infrastructure development. However, challenges remain, including high initial investment costs for implementing smart packaging technologies and potential concerns about data security and privacy. Overcoming these hurdles will be key to unlocking the full potential of this dynamic market.
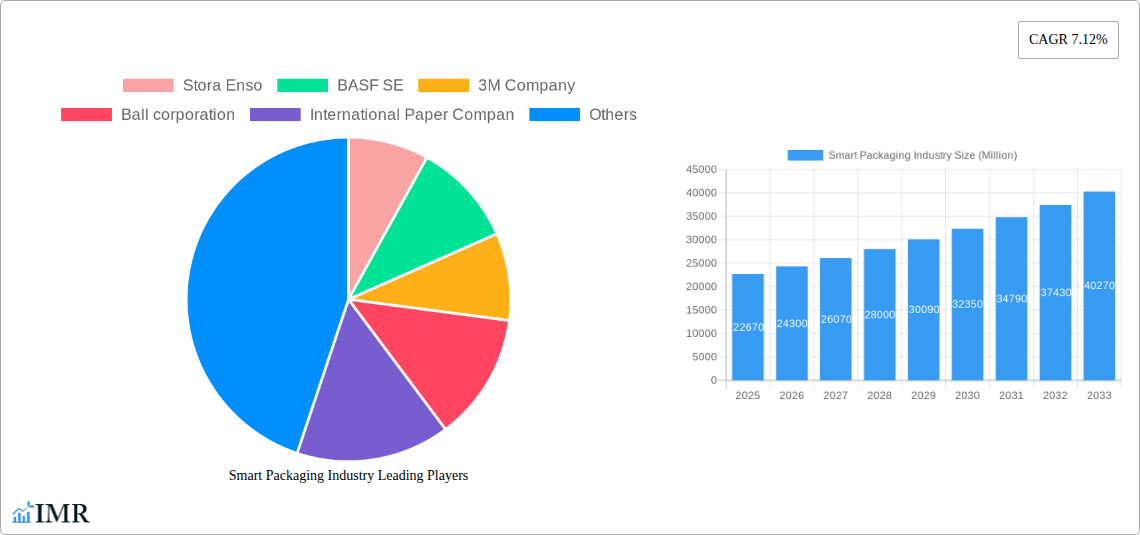
Smart Packaging Industry Market Size (In Billion)
The segmentation of the smart packaging market reveals specific opportunities within various technology types and end-user verticals. Active packaging, employing technologies to extend shelf life and maintain product quality, holds a significant market share, while intelligent packaging, incorporating sensors and tracking devices, is experiencing rapid growth due to its ability to provide real-time data and enhanced traceability. Among end-user verticals, the food and beverage industry leads in adoption, followed by healthcare and personal care. This is due to the significant impact smart packaging can have on food safety, medication adherence, and product authenticity. Regional analysis shows strong performance in North America and Europe, driven by robust regulatory frameworks and high consumer demand for advanced packaging solutions. However, developing regions like Asia-Pacific are poised for rapid growth, presenting significant expansion opportunities for market players. The competitive landscape includes major players like Stora Enso, BASF SE, 3M, Ball Corporation, and Amcor PLC, each vying for market share through innovation and strategic partnerships. The forecast period (2025-2033) promises continued growth driven by the convergence of technological advancements, changing consumer preferences, and evolving regulatory landscapes.
Smart Packaging Industry Company Market Share
Smart Packaging Industry Market Report: 2019-2033
This comprehensive report provides an in-depth analysis of the Smart Packaging market, encompassing market dynamics, growth trends, regional dominance, product landscape, key players, and future outlook. With a study period spanning 2019-2033, a base year of 2025, and a forecast period of 2025-2033, this report offers invaluable insights for industry professionals, investors, and strategic decision-makers. The report segments the market by technology (Active Packaging, Intelligent Packaging) and end-user vertical (Food, Beverage, Healthcare, Personal Care, Other End-user Verticals), delivering granular analysis for informed strategic planning. The market size is valued in million units.
Smart Packaging Industry Market Dynamics & Structure
The smart packaging market is experiencing significant growth driven by technological advancements, increasing consumer demand for convenience and product information, and stringent regulatory frameworks. Market concentration is moderate, with several key players holding substantial market share. Technological innovation, particularly in RFID, sensors, and connected packaging, is a primary driver. Regulatory pressures related to sustainability and food safety are also shaping market dynamics. The industry witnesses frequent mergers and acquisitions (M&A) as companies seek to expand their product portfolios and geographical reach. Substitute products, such as traditional packaging, face increasing competition due to the advantages offered by smart packaging solutions.
- Market Concentration: Moderate, with top 10 players holding approximately xx% market share in 2025.
- Technological Innovation: Focus on RFID, sensors, and connected packaging solutions.
- Regulatory Framework: Increasing emphasis on sustainability and food safety regulations.
- Competitive Substitutes: Traditional packaging faces declining market share.
- M&A Activity: XX deals recorded between 2019-2024, with an estimated xx% increase projected for 2025-2033.
- Innovation Barriers: High R&D costs and integration complexities.
Smart Packaging Industry Growth Trends & Insights
The smart packaging market is experiencing a significant surge, fueled by evolving consumer expectations for richer product information, an escalating emphasis on supply chain visibility, and the widespread adoption of e-commerce platforms. Historically, the market demonstrated a Compound Annual Growth Rate (CAGR) of [Insert Historical CAGR Here]% during the period of 2019-2024. Projections indicate a sustained and robust CAGR of [Insert Forecast CAGR Here]% for the forecast period spanning 2025-2033. This upward trajectory is primarily driven by rapid technological advancements, including the seamless integration of advanced sensors, Radio-Frequency Identification (RFID) tags, and Near Field Communication (NFC) technology. These innovations empower real-time tracking, robust product authentication, and unparalleled improvements in supply chain efficiency. Furthermore, a growing consumer preference for packaging that is not only convenient but also highly informative is significantly accelerating market penetration across a diverse spectrum of end-user verticals.
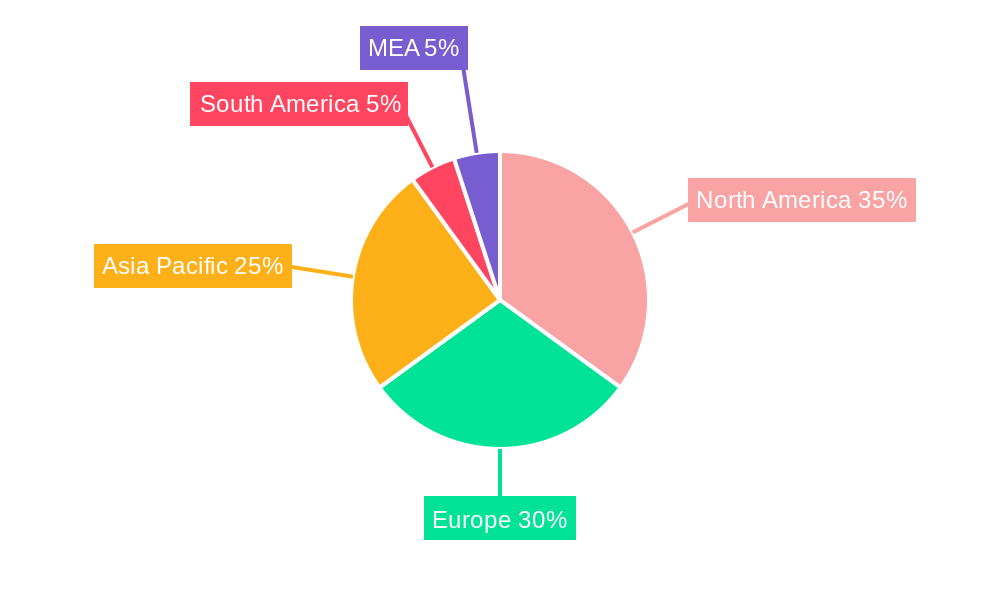
Dominant Regions, Countries, or Segments in Smart Packaging Industry
North America currently holds the largest market share, followed by Europe and Asia Pacific. Within the technology segments, Intelligent Packaging demonstrates higher growth potential due to its advanced functionalities. The Food and Beverage sector dominates the end-user verticals, driven by high demand for traceability and product safety.
- By Technology: Intelligent Packaging is expected to witness higher growth.
- By End-user Vertical: Food and Beverage segment accounts for xx% of market share.
- Key Regional Drivers: North America's strong economy and technological advancement, Europe's stringent regulatory environment, and Asia Pacific's expanding manufacturing sector.
Smart Packaging Industry Product Landscape
Smart packaging solutions are revolutionizing product protection and consumer engagement by offering a comprehensive suite of features. These include precise temperature monitoring for sensitive goods, advanced tamper-evident mechanisms to ensure product integrity, and sophisticated product authentication to combat counterfeiting and build consumer trust. Leading innovations are centered around the integration of Internet of Things (IoT) sensors and the development of cutting-edge materials designed to enhance both functionality and sustainability. Key performance indicators that are shaping the development and adoption of these solutions encompass cost-effectiveness, intuitive user-friendliness, and a minimized environmental footprint, aligning with global sustainability goals.
Key Drivers, Barriers & Challenges in Smart Packaging Industry
Key Drivers:
- The burgeoning demand for enhanced product traceability and irrefutable authentication, crucial for consumer safety and brand protection.
- The accelerating adoption of e-commerce and the growing prevalence of online grocery shopping, necessitating more robust and informative packaging.
- Increasingly stringent global regulations governing food safety standards and product labeling requirements, pushing for greater transparency.
- Continuous and rapid advancements in sensor technologies, RFID, and related connectivity solutions, making smart packaging more accessible and capable.
Key Challenges:
- The significant initial investment required for the successful implementation and integration of sophisticated smart packaging solutions across the value chain.
- Potential compatibility challenges with existing, legacy supply chain infrastructure and systems, requiring careful planning and integration strategies.
- Pervasive concerns surrounding the security of data generated by smart packaging and the privacy of consumer information, demanding robust cybersecurity measures.
- Limited consumer awareness and adoption rates in certain geographical regions, necessitating targeted education and marketing efforts. (estimated [Insert Estimated Impact]% impact on market growth in 2025).
Emerging Opportunities in Smart Packaging Industry
Untapped markets in developing economies offer significant growth potential. Emerging applications include smart labels for pharmaceutical products and personalized packaging solutions tailored to individual consumer preferences. The increasing focus on sustainable packaging materials and circular economy models presents new opportunities for eco-friendly smart packaging solutions.
Growth Accelerators in the Smart Packaging Industry Industry
The smart packaging market is set to accelerate its growth trajectory, propelled by groundbreaking technological breakthroughs. These include the development and adoption of bio-based materials that offer enhanced sustainability credentials and the creation of more sophisticated and miniaturized advanced sensor technologies. Furthermore, the formation of strategic partnerships and collaborations between established packaging manufacturers and innovative technology providers is a key catalyst, fostering rapid innovation and expanding market reach. Increased government support and incentives for sustainable packaging solutions also represent a significant growth accelerator, encouraging wider adoption of eco-friendly smart packaging alternatives.
Key Players Shaping the Smart Packaging Industry Market
Notable Milestones in Smart Packaging Industry Sector
- March 2023: Amcor's joint research project with NfiniteNanotechnology Inc. to enhance recyclable and compostable packaging.
- January 2023: Avery Dennison's significant investment in expanding RFID manufacturing capacity in Mexico.
In-Depth Smart Packaging Industry Market Outlook
The smart packaging market is on the cusp of substantial and sustained growth in the coming years. This expansion will be underpinned by a powerful combination of accelerating technological advancements, a rising tide of consumer demand for more engaging and informative packaging experiences, and the establishment of increasingly supportive regulatory frameworks. Strategic partnerships, substantial investments in research and development (R&D), and focused expansion into emerging and new markets will be pivotal in shaping the future dynamics of this industry. A paramount focus on sustainability and the principles of a circular economy will further intensify the drive towards the adoption of innovative, intelligent, and environmentally responsible smart packaging solutions.
Smart Packaging Industry Segmentation
-
1. Technology
- 1.1. Active Packaging
- 1.2. Intelligent Packaging
-
2. End-user Vertical
- 2.1. Food
- 2.2. Beverage
- 2.3. Healthcare
- 2.4. Personal Care
- 2.5. Other End-user Verticals
Smart Packaging Industry Segmentation By Geography
-
1. North America
- 1.1. United States
- 1.2. Canada
-
2. Europe
- 2.1. Germany
- 2.2. United Kingdom
- 2.3. France
- 2.4. Rest of Europe
-
3. Asia Pacific
- 3.1. China
- 3.2. Japan
- 3.3. India
- 3.4. Rest of Asia Pacific
- 4. Latin America
- 5. Middle East and Africa
Smart Packaging Industry Regional Market Share
Geographic Coverage of Smart Packaging Industry
Smart Packaging Industry REPORT HIGHLIGHTS
| Aspects | Details |
|---|---|
| Study Period | 2020-2034 |
| Base Year | 2025 |
| Estimated Year | 2026 |
| Forecast Period | 2026-2034 |
| Historical Period | 2020-2025 |
| Growth Rate | CAGR of 7.12% from 2020-2034 |
| Segmentation |
|
Table of Contents
- 1. Introduction
- 1.1. Research Scope
- 1.2. Market Segmentation
- 1.3. Research Objective
- 1.4. Definitions and Assumptions
- 2. Executive Summary
- 2.1. Market Snapshot
- 3. Market Dynamics
- 3.1. Market Drivers
- 3.2. Market Restrains
- 3.3. Market Trends
- 3.4. Market Opportunities
- 4. Market Factor Analysis
- 4.1. Porters Five Forces
- 4.1.1. Bargaining Power of Suppliers
- 4.1.2. Bargaining Power of Buyers
- 4.1.3. Threat of New Entrants
- 4.1.4. Threat of Substitutes
- 4.1.5. Competitive Rivalry
- 4.2. PESTEL analysis
- 4.3. BCG Analysis
- 4.3.1. Stars (High Growth, High Market Share)
- 4.3.2. Cash Cows (Low Growth, High Market Share)
- 4.3.3. Question Mark (High Growth, Low Market Share)
- 4.3.4. Dogs (Low Growth, Low Market Share)
- 4.4. Ansoff Matrix Analysis
- 4.5. Supply Chain Analysis
- 4.6. Regulatory Landscape
- 4.7. Current Market Potential and Opportunity Assessment (TAM–SAM–SOM Framework)
- 4.8. IMR Analyst Note
- 4.1. Porters Five Forces
- 5. Market Analysis, Insights and Forecast 2021-2033
- 5.1. Market Analysis, Insights and Forecast - by Technology
- 5.1.1. Active Packaging
- 5.1.2. Intelligent Packaging
- 5.2. Market Analysis, Insights and Forecast - by End-user Vertical
- 5.2.1. Food
- 5.2.2. Beverage
- 5.2.3. Healthcare
- 5.2.4. Personal Care
- 5.2.5. Other End-user Verticals
- 5.3. Market Analysis, Insights and Forecast - by Region
- 5.3.1. North America
- 5.3.2. Europe
- 5.3.3. Asia Pacific
- 5.3.4. Latin America
- 5.3.5. Middle East and Africa
- 5.1. Market Analysis, Insights and Forecast - by Technology
- 6. Global Smart Packaging Industry Analysis, Insights and Forecast, 2021-2033
- 6.1. Market Analysis, Insights and Forecast - by Technology
- 6.1.1. Active Packaging
- 6.1.2. Intelligent Packaging
- 6.2. Market Analysis, Insights and Forecast - by End-user Vertical
- 6.2.1. Food
- 6.2.2. Beverage
- 6.2.3. Healthcare
- 6.2.4. Personal Care
- 6.2.5. Other End-user Verticals
- 6.1. Market Analysis, Insights and Forecast - by Technology
- 7. North America Smart Packaging Industry Analysis, Insights and Forecast, 2020-2032
- 7.1. Market Analysis, Insights and Forecast - by Technology
- 7.1.1. Active Packaging
- 7.1.2. Intelligent Packaging
- 7.2. Market Analysis, Insights and Forecast - by End-user Vertical
- 7.2.1. Food
- 7.2.2. Beverage
- 7.2.3. Healthcare
- 7.2.4. Personal Care
- 7.2.5. Other End-user Verticals
- 7.1. Market Analysis, Insights and Forecast - by Technology
- 8. Europe Smart Packaging Industry Analysis, Insights and Forecast, 2020-2032
- 8.1. Market Analysis, Insights and Forecast - by Technology
- 8.1.1. Active Packaging
- 8.1.2. Intelligent Packaging
- 8.2. Market Analysis, Insights and Forecast - by End-user Vertical
- 8.2.1. Food
- 8.2.2. Beverage
- 8.2.3. Healthcare
- 8.2.4. Personal Care
- 8.2.5. Other End-user Verticals
- 8.1. Market Analysis, Insights and Forecast - by Technology
- 9. Asia Pacific Smart Packaging Industry Analysis, Insights and Forecast, 2020-2032
- 9.1. Market Analysis, Insights and Forecast - by Technology
- 9.1.1. Active Packaging
- 9.1.2. Intelligent Packaging
- 9.2. Market Analysis, Insights and Forecast - by End-user Vertical
- 9.2.1. Food
- 9.2.2. Beverage
- 9.2.3. Healthcare
- 9.2.4. Personal Care
- 9.2.5. Other End-user Verticals
- 9.1. Market Analysis, Insights and Forecast - by Technology
- 10. Latin America Smart Packaging Industry Analysis, Insights and Forecast, 2020-2032
- 10.1. Market Analysis, Insights and Forecast - by Technology
- 10.1.1. Active Packaging
- 10.1.2. Intelligent Packaging
- 10.2. Market Analysis, Insights and Forecast - by End-user Vertical
- 10.2.1. Food
- 10.2.2. Beverage
- 10.2.3. Healthcare
- 10.2.4. Personal Care
- 10.2.5. Other End-user Verticals
- 10.1. Market Analysis, Insights and Forecast - by Technology
- 11. Middle East and Africa Smart Packaging Industry Analysis, Insights and Forecast, 2020-2032
- 11.1. Market Analysis, Insights and Forecast - by Technology
- 11.1.1. Active Packaging
- 11.1.2. Intelligent Packaging
- 11.2. Market Analysis, Insights and Forecast - by End-user Vertical
- 11.2.1. Food
- 11.2.2. Beverage
- 11.2.3. Healthcare
- 11.2.4. Personal Care
- 11.2.5. Other End-user Verticals
- 11.1. Market Analysis, Insights and Forecast - by Technology
- 12. Competitive Analysis
- 12.1. Company Profiles
- 12.1.1 Stora Enso
- 12.1.1.1. Company Overview
- 12.1.1.2. Products
- 12.1.1.3. Company Financials
- 12.1.1.4. SWOT Analysis
- 12.1.2 BASF SE
- 12.1.2.1. Company Overview
- 12.1.2.2. Products
- 12.1.2.3. Company Financials
- 12.1.2.4. SWOT Analysis
- 12.1.3 3M Company
- 12.1.3.1. Company Overview
- 12.1.3.2. Products
- 12.1.3.3. Company Financials
- 12.1.3.4. SWOT Analysis
- 12.1.4 Ball corporation
- 12.1.4.1. Company Overview
- 12.1.4.2. Products
- 12.1.4.3. Company Financials
- 12.1.4.4. SWOT Analysis
- 12.1.5 International Paper Compan
- 12.1.5.1. Company Overview
- 12.1.5.2. Products
- 12.1.5.3. Company Financials
- 12.1.5.4. SWOT Analysis
- 12.1.6 Amcor PLC
- 12.1.6.1. Company Overview
- 12.1.6.2. Products
- 12.1.6.3. Company Financials
- 12.1.6.4. SWOT Analysis
- 12.1.7 Avery Dennison Corporation
- 12.1.7.1. Company Overview
- 12.1.7.2. Products
- 12.1.7.3. Company Financials
- 12.1.7.4. SWOT Analysis
- 12.1.8 Huhtamaki OYJ
- 12.1.8.1. Company Overview
- 12.1.8.2. Products
- 12.1.8.3. Company Financials
- 12.1.8.4. SWOT Analysis
- 12.1.9 Zebra Technologies Corporation
- 12.1.9.1. Company Overview
- 12.1.9.2. Products
- 12.1.9.3. Company Financials
- 12.1.9.4. SWOT Analysis
- 12.1.10 Sealed Air Corporation
- 12.1.10.1. Company Overview
- 12.1.10.2. Products
- 12.1.10.3. Company Financials
- 12.1.10.4. SWOT Analysis
- 12.1.1 Stora Enso
- 12.2. Market Entropy
- 12.2.1 Company's Key Areas Served
- 12.2.2 Recent Developments
- 12.3. Company Market Share Analysis 2025
- 12.3.1 Top 5 Companies Market Share Analysis
- 12.3.2 Top 3 Companies Market Share Analysis
- 12.4. List of Potential Customers
- 13. Research Methodology
List of Figures
- Figure 1: Global Smart Packaging Industry Revenue Breakdown (Million, %) by Region 2025 & 2033
- Figure 2: North America Smart Packaging Industry Revenue (Million), by Technology 2025 & 2033
- Figure 3: North America Smart Packaging Industry Revenue Share (%), by Technology 2025 & 2033
- Figure 4: North America Smart Packaging Industry Revenue (Million), by End-user Vertical 2025 & 2033
- Figure 5: North America Smart Packaging Industry Revenue Share (%), by End-user Vertical 2025 & 2033
- Figure 6: North America Smart Packaging Industry Revenue (Million), by Country 2025 & 2033
- Figure 7: North America Smart Packaging Industry Revenue Share (%), by Country 2025 & 2033
- Figure 8: Europe Smart Packaging Industry Revenue (Million), by Technology 2025 & 2033
- Figure 9: Europe Smart Packaging Industry Revenue Share (%), by Technology 2025 & 2033
- Figure 10: Europe Smart Packaging Industry Revenue (Million), by End-user Vertical 2025 & 2033
- Figure 11: Europe Smart Packaging Industry Revenue Share (%), by End-user Vertical 2025 & 2033
- Figure 12: Europe Smart Packaging Industry Revenue (Million), by Country 2025 & 2033
- Figure 13: Europe Smart Packaging Industry Revenue Share (%), by Country 2025 & 2033
- Figure 14: Asia Pacific Smart Packaging Industry Revenue (Million), by Technology 2025 & 2033
- Figure 15: Asia Pacific Smart Packaging Industry Revenue Share (%), by Technology 2025 & 2033
- Figure 16: Asia Pacific Smart Packaging Industry Revenue (Million), by End-user Vertical 2025 & 2033
- Figure 17: Asia Pacific Smart Packaging Industry Revenue Share (%), by End-user Vertical 2025 & 2033
- Figure 18: Asia Pacific Smart Packaging Industry Revenue (Million), by Country 2025 & 2033
- Figure 19: Asia Pacific Smart Packaging Industry Revenue Share (%), by Country 2025 & 2033
- Figure 20: Latin America Smart Packaging Industry Revenue (Million), by Technology 2025 & 2033
- Figure 21: Latin America Smart Packaging Industry Revenue Share (%), by Technology 2025 & 2033
- Figure 22: Latin America Smart Packaging Industry Revenue (Million), by End-user Vertical 2025 & 2033
- Figure 23: Latin America Smart Packaging Industry Revenue Share (%), by End-user Vertical 2025 & 2033
- Figure 24: Latin America Smart Packaging Industry Revenue (Million), by Country 2025 & 2033
- Figure 25: Latin America Smart Packaging Industry Revenue Share (%), by Country 2025 & 2033
- Figure 26: Middle East and Africa Smart Packaging Industry Revenue (Million), by Technology 2025 & 2033
- Figure 27: Middle East and Africa Smart Packaging Industry Revenue Share (%), by Technology 2025 & 2033
- Figure 28: Middle East and Africa Smart Packaging Industry Revenue (Million), by End-user Vertical 2025 & 2033
- Figure 29: Middle East and Africa Smart Packaging Industry Revenue Share (%), by End-user Vertical 2025 & 2033
- Figure 30: Middle East and Africa Smart Packaging Industry Revenue (Million), by Country 2025 & 2033
- Figure 31: Middle East and Africa Smart Packaging Industry Revenue Share (%), by Country 2025 & 2033
List of Tables
- Table 1: Global Smart Packaging Industry Revenue Million Forecast, by Technology 2020 & 2033
- Table 2: Global Smart Packaging Industry Revenue Million Forecast, by End-user Vertical 2020 & 2033
- Table 3: Global Smart Packaging Industry Revenue Million Forecast, by Region 2020 & 2033
- Table 4: Global Smart Packaging Industry Revenue Million Forecast, by Technology 2020 & 2033
- Table 5: Global Smart Packaging Industry Revenue Million Forecast, by End-user Vertical 2020 & 2033
- Table 6: Global Smart Packaging Industry Revenue Million Forecast, by Country 2020 & 2033
- Table 7: United States Smart Packaging Industry Revenue (Million) Forecast, by Application 2020 & 2033
- Table 8: Canada Smart Packaging Industry Revenue (Million) Forecast, by Application 2020 & 2033
- Table 9: Global Smart Packaging Industry Revenue Million Forecast, by Technology 2020 & 2033
- Table 10: Global Smart Packaging Industry Revenue Million Forecast, by End-user Vertical 2020 & 2033
- Table 11: Global Smart Packaging Industry Revenue Million Forecast, by Country 2020 & 2033
- Table 12: Germany Smart Packaging Industry Revenue (Million) Forecast, by Application 2020 & 2033
- Table 13: United Kingdom Smart Packaging Industry Revenue (Million) Forecast, by Application 2020 & 2033
- Table 14: France Smart Packaging Industry Revenue (Million) Forecast, by Application 2020 & 2033
- Table 15: Rest of Europe Smart Packaging Industry Revenue (Million) Forecast, by Application 2020 & 2033
- Table 16: Global Smart Packaging Industry Revenue Million Forecast, by Technology 2020 & 2033
- Table 17: Global Smart Packaging Industry Revenue Million Forecast, by End-user Vertical 2020 & 2033
- Table 18: Global Smart Packaging Industry Revenue Million Forecast, by Country 2020 & 2033
- Table 19: China Smart Packaging Industry Revenue (Million) Forecast, by Application 2020 & 2033
- Table 20: Japan Smart Packaging Industry Revenue (Million) Forecast, by Application 2020 & 2033
- Table 21: India Smart Packaging Industry Revenue (Million) Forecast, by Application 2020 & 2033
- Table 22: Rest of Asia Pacific Smart Packaging Industry Revenue (Million) Forecast, by Application 2020 & 2033
- Table 23: Global Smart Packaging Industry Revenue Million Forecast, by Technology 2020 & 2033
- Table 24: Global Smart Packaging Industry Revenue Million Forecast, by End-user Vertical 2020 & 2033
- Table 25: Global Smart Packaging Industry Revenue Million Forecast, by Country 2020 & 2033
- Table 26: Global Smart Packaging Industry Revenue Million Forecast, by Technology 2020 & 2033
- Table 27: Global Smart Packaging Industry Revenue Million Forecast, by End-user Vertical 2020 & 2033
- Table 28: Global Smart Packaging Industry Revenue Million Forecast, by Country 2020 & 2033
Frequently Asked Questions
1. What is the projected Compound Annual Growth Rate (CAGR) of the Smart Packaging Industry?
The projected CAGR is approximately 7.12%.
2. Which companies are prominent players in the Smart Packaging Industry?
Key companies in the market include Stora Enso, BASF SE, 3M Company, Ball corporation, International Paper Compan, Amcor PLC, Avery Dennison Corporation, Huhtamaki OYJ, Zebra Technologies Corporation, Sealed Air Corporation.
3. What are the main segments of the Smart Packaging Industry?
The market segments include Technology, End-user Vertical.
4. Can you provide details about the market size?
The market size is estimated to be USD 22.67 Million as of 2022.
5. What are some drivers contributing to market growth?
Advancement in Technology in Food Packaging for Quality Inspection; Rising Awareness Regarding Food Safety; Development in the Printing Industry Due to Various Applications of Smart Packaging.
6. What are the notable trends driving market growth?
Active Packaging to Hold Major Share in the Market.
7. Are there any restraints impacting market growth?
High Costs Due to Initial Requirement.
8. Can you provide examples of recent developments in the market?
March 2023: Amcor, a company that creates and manufactures environment-friendly packaging solutions, announced a joint research project agreement with NfiniteNanotechnology Inc. to validate the application of Nfinite's nanocoating technology to improve packaging that can be recycled and composted.
9. What pricing options are available for accessing the report?
Pricing options include single-user, multi-user, and enterprise licenses priced at USD 4750, USD 5250, and USD 8750 respectively.
10. Is the market size provided in terms of value or volume?
The market size is provided in terms of value, measured in Million.
11. Are there any specific market keywords associated with the report?
Yes, the market keyword associated with the report is "Smart Packaging Industry," which aids in identifying and referencing the specific market segment covered.
12. How do I determine which pricing option suits my needs best?
The pricing options vary based on user requirements and access needs. Individual users may opt for single-user licenses, while businesses requiring broader access may choose multi-user or enterprise licenses for cost-effective access to the report.
13. Are there any additional resources or data provided in the Smart Packaging Industry report?
While the report offers comprehensive insights, it's advisable to review the specific contents or supplementary materials provided to ascertain if additional resources or data are available.
14. How can I stay updated on further developments or reports in the Smart Packaging Industry?
To stay informed about further developments, trends, and reports in the Smart Packaging Industry, consider subscribing to industry newsletters, following relevant companies and organizations, or regularly checking reputable industry news sources and publications.
Methodology
Step 1 - Identification of Relevant Samples Size from Population Database


Step 2 - Approaches for Defining Global Market Size (Value, Volume* & Price*)

Note*: In applicable scenarios
Step 3 - Data Sources
Primary Research
- Web Analytics
- Survey Reports
- Research Institute
- Latest Research Reports
- Opinion Leaders
Secondary Research
- Annual Reports
- White Paper
- Latest Press Release
- Industry Association
- Paid Database
- Investor Presentations

Step 4 - Data Triangulation
Involves using different sources of information in order to increase the validity of a study
These sources are likely to be stakeholders in a program - participants, other researchers, program staff, other community members, and so on.
Then we put all data in single framework & apply various statistical tools to find out the dynamic on the market.
During the analysis stage, feedback from the stakeholder groups would be compared to determine areas of agreement as well as areas of divergence