

Key Insights
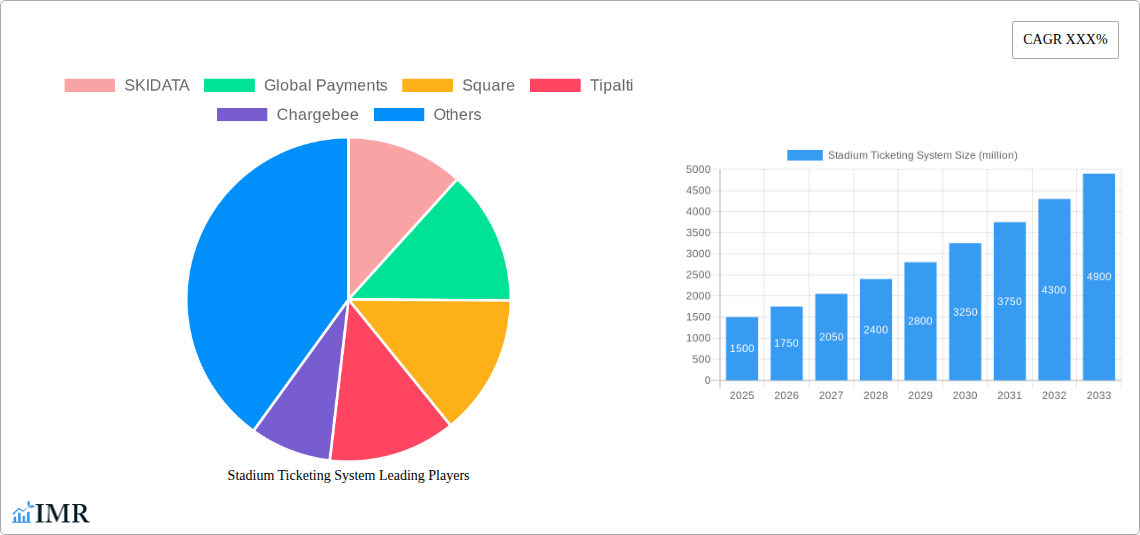
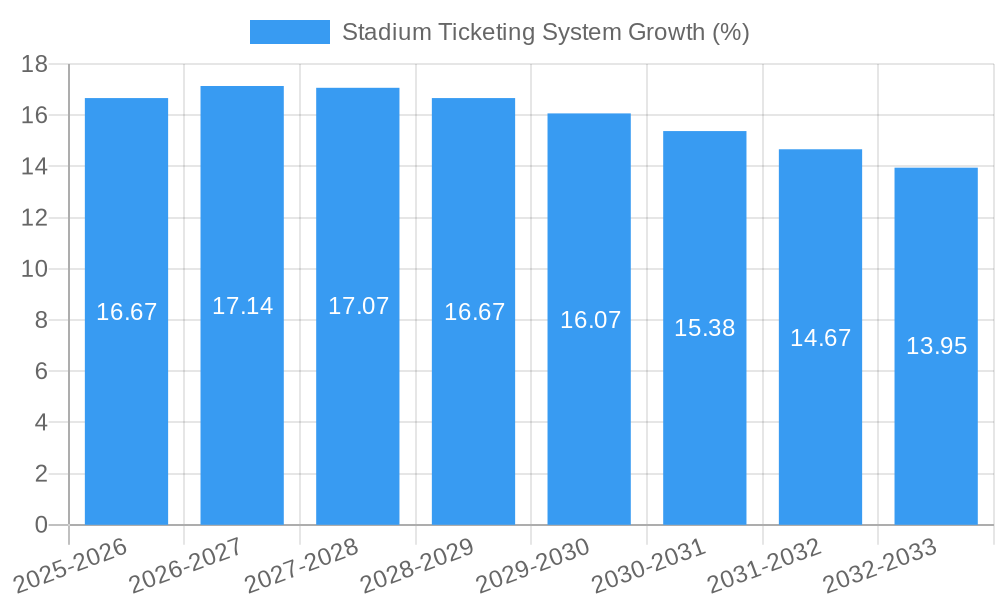
The global stadium ticketing system market is experiencing robust growth, driven by increasing adoption of digital ticketing solutions and the rising popularity of sporting events worldwide. The market's value, estimated at $2.5 billion in 2025, is projected to exhibit a Compound Annual Growth Rate (CAGR) of 12% from 2025 to 2033, reaching approximately $7 billion by 2033. This growth is fueled by several key factors. Firstly, the demand for enhanced fan experience is pushing stadiums to adopt sophisticated ticketing systems offering mobile ticketing, dynamic pricing, and personalized marketing capabilities. Secondly, the integration of these systems with other stadium technologies, such as access control and concessions, streamlines operations and improves revenue management. Thirdly, the increasing use of data analytics provides valuable insights into fan behavior, enabling teams and venues to optimize pricing strategies and enhance customer engagement. However, challenges remain, including the need for robust security measures to combat fraud and the complexities of integrating legacy systems with newer technologies.
Despite these challenges, the market's positive trajectory is evident. The segment of mobile ticketing is leading the growth, with a significant rise in smartphone adoption and consumer preference for contactless transactions. The competitive landscape is dynamic, featuring established players like SKIDATA and Global Payments, alongside emerging tech companies like Square and Chargebee offering innovative solutions. Geographic expansion is also a key driver, with developing markets in Asia-Pacific and Latin America showing considerable potential for growth. The ongoing technological advancements, such as blockchain technology for secure ticket transfers and AI-powered predictive analytics for demand forecasting, will continue to shape the market's evolution. The focus will be on delivering seamless, personalized experiences to fans, while enhancing operational efficiency and revenue generation for stadium operators.
Stadium Ticketing System Market Report: 2019-2033
This comprehensive report provides a detailed analysis of the Stadium Ticketing System market, encompassing market dynamics, growth trends, regional dominance, product landscape, key players, and future outlook. The study period covers 2019-2033, with 2025 as the base and estimated year. The forecast period spans 2025-2033, and the historical period includes 2019-2024. This report is crucial for industry professionals, investors, and businesses seeking to understand and capitalize on the opportunities within this dynamic sector. The global market is predicted to reach xx million by 2033.
Stadium Ticketing System Market Dynamics & Structure
The Stadium Ticketing System market exhibits a moderately concentrated structure, with key players holding significant market share. Technological innovation, driven by advancements in mobile ticketing, AI-powered analytics, and blockchain integration, is a primary growth driver. Regulatory frameworks concerning data privacy and security significantly influence market dynamics. Competitive substitutes include traditional paper ticketing and informal sales channels, though their market share is declining. End-user demographics, particularly the increasing adoption of mobile technology among younger generations, significantly impacts demand. M&A activity within the sector has been moderate, with approximately xx deals recorded during the historical period, resulting in a xx% increase in market concentration.
- Market Concentration: Moderately concentrated, with top 5 players holding xx% market share in 2024.
- Technological Innovation: Mobile ticketing, AI-driven analytics, blockchain for security.
- Regulatory Framework: GDPR, CCPA, and other data privacy regulations.
- Competitive Substitutes: Paper ticketing, informal resale markets.
- End-User Demographics: Growing adoption among younger demographics driving demand.
- M&A Activity: xx deals between 2019-2024, resulting in xx% market concentration increase.
Stadium Ticketing System Growth Trends & Insights
The Stadium Ticketing System market has experienced substantial growth during the historical period, expanding from xx million in 2019 to xx million in 2024. This growth is primarily attributed to increasing stadium attendance, rising adoption of mobile ticketing, and the integration of advanced features such as dynamic pricing and personalized offers. The market is expected to maintain a robust CAGR of xx% during the forecast period (2025-2033), driven by technological advancements and increasing digitalization within the sports and entertainment industry. Market penetration for mobile ticketing has increased significantly, reaching xx% in 2024. Consumer behavior shifts towards contactless transactions and personalized experiences further fuel market growth. Technological disruptions, such as the introduction of biometric authentication and cashless payment systems, are expected to further accelerate market expansion.
Dominant Regions, Countries, or Segments in Stadium Ticketing System
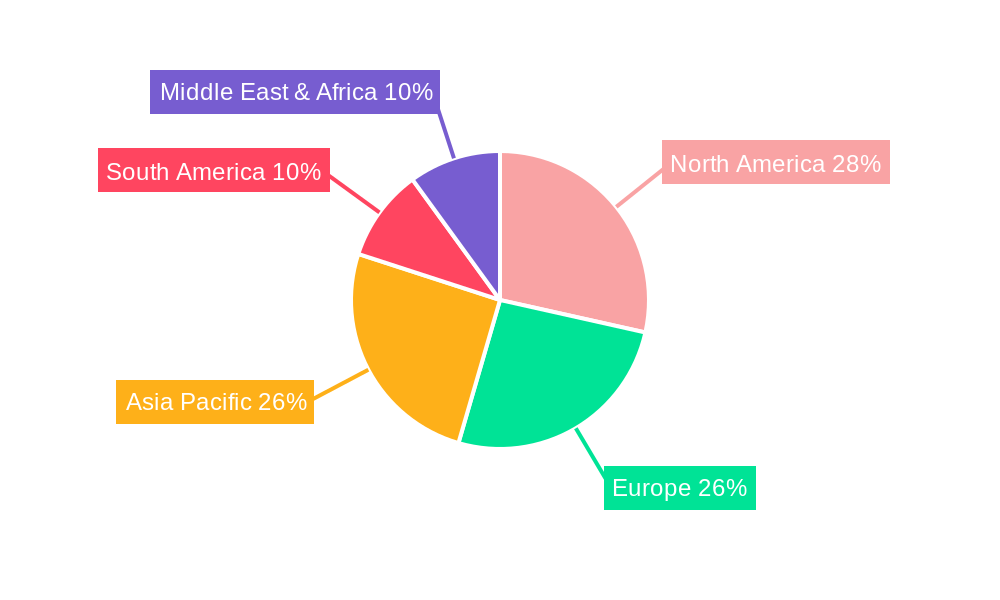
North America currently holds the largest market share in the Stadium Ticketing System market, driven by high stadium attendance, significant technological adoption, and well-established infrastructure. Europe follows closely, while Asia-Pacific exhibits strong growth potential due to rapid infrastructure development and rising disposable incomes. The major driver for North America's dominance is high sports fan engagement and the mature technological environment.
- North America: High stadium attendance, advanced technological adoption, strong infrastructure.
- Europe: High adoption rates, robust digital infrastructure.
- Asia-Pacific: Rapid infrastructure development, rising disposable incomes, increasing fan base.
- Market Share: North America (xx%), Europe (xx%), Asia-Pacific (xx%).
- Growth Potential: Asia-Pacific expected to witness highest growth rate during forecast period.
Stadium Ticketing System Product Landscape
The Stadium Ticketing System market offers a diverse range of products, including mobile ticketing apps, integrated POS systems, access control solutions, and analytics dashboards. Recent innovations focus on enhancing user experience through personalized offers, seamless integration with other platforms, and improved security features. These systems offer features like dynamic pricing, real-time inventory management, and detailed sales analytics, leading to increased revenue generation and operational efficiency for stadium operators.
Key Drivers, Barriers & Challenges in Stadium Ticketing System
Key Drivers: Increasing stadium attendance, rising adoption of mobile technology, demand for enhanced fan experience, and integration of advanced analytics for better revenue management are major drivers. Government initiatives promoting digitalization in the sports industry further propel growth.
Challenges: High initial investment costs for implementing new systems, concerns about data security and privacy, integration complexities with existing infrastructure, and the need for robust customer support are significant challenges. The impact of these challenges is estimated to be a xx% reduction in market growth by 2030.
Emerging Opportunities in Stadium Ticketing System
Emerging opportunities lie in untapped markets such as smaller stadiums and arenas. Innovative applications like integrating virtual reality (VR) and augmented reality (AR) technologies for enhanced fan experiences are promising. Evolving consumer preferences towards personalized experiences are creating opportunities for tailored ticketing solutions. The integration of loyalty programs and other rewards systems within ticketing platforms is also a significant emerging opportunity.
Growth Accelerators in the Stadium Ticketing System Industry
Strategic partnerships between ticketing providers and stadium operators are accelerating market growth, allowing for seamless integration and enhanced functionality. Technological breakthroughs, such as the adoption of blockchain technology for secure ticket management, are further fueling expansion. Market expansion into new geographic regions and the development of specialized solutions for diverse stadium types contribute to long-term growth.
Key Players Shaping the Stadium Ticketing System Market
- SKIDATA
- Global Payments
- Square
- Tipalti
- Chargebee
- Infor SunSystems
- Elorus
- Zoho Subscriptions
- EBS Toolbox
- Invoice Home
- Odoo
- Tridens Monetization
- More4apps
- Bitrix24
- PayPal Commerce Platform
- QuickBooks Online
- Deep Internet Technology
Notable Milestones in Stadium Ticketing System Sector
- 2020, Q3: Introduction of contactless mobile ticketing by SKIDATA.
- 2021, Q1: Global Payments launches integrated payment gateway for stadium ticketing.
- 2022, Q4: Square integrates its POS system with leading ticketing platforms.
- 2023, Q2: Partnership between Tipalti and a major stadium operator for streamlined payment processing.
In-Depth Stadium Ticketing System Market Outlook
The Stadium Ticketing System market is poised for significant growth in the coming years, driven by continuous technological advancements, increasing demand for enhanced fan experiences, and expansion into new geographic markets. Strategic partnerships and the development of innovative solutions will further accelerate market expansion, presenting lucrative opportunities for industry players to capitalize on the market's robust growth potential. The market is expected to experience substantial growth, reaching xx million by 2033.
Stadium Ticketing System Segmentation
-
1. Application
- 1.1. Football Field
- 1.2. Basketball Hall
- 1.3. Volleyball Court
- 1.4. Table Tennis Hall
- 1.5. Others
-
2. Types
- 2.1. Online Ticketing
- 2.2. On-Site Ticketing
Stadium Ticketing System Segmentation By Geography
-
1. North America
- 1.1. United States
- 1.2. Canada
- 1.3. Mexico
-
2. South America
- 2.1. Brazil
- 2.2. Argentina
- 2.3. Rest of South America
-
3. Europe
- 3.1. United Kingdom
- 3.2. Germany
- 3.3. France
- 3.4. Italy
- 3.5. Spain
- 3.6. Russia
- 3.7. Benelux
- 3.8. Nordics
- 3.9. Rest of Europe
-
4. Middle East & Africa
- 4.1. Turkey
- 4.2. Israel
- 4.3. GCC
- 4.4. North Africa
- 4.5. South Africa
- 4.6. Rest of Middle East & Africa
-
5. Asia Pacific
- 5.1. China
- 5.2. India
- 5.3. Japan
- 5.4. South Korea
- 5.5. ASEAN
- 5.6. Oceania
- 5.7. Rest of Asia Pacific
Stadium Ticketing System REPORT HIGHLIGHTS
| Aspects | Details |
|---|---|
| Study Period | 2019-2033 |
| Base Year | 2024 |
| Estimated Year | 2025 |
| Forecast Period | 2025-2033 |
| Historical Period | 2019-2024 |
| Growth Rate | CAGR of XX% from 2019-2033 |
| Segmentation |
|
Table of Contents
- 1. Introduction
- 1.1. Research Scope
- 1.2. Market Segmentation
- 1.3. Research Methodology
- 1.4. Definitions and Assumptions
- 2. Executive Summary
- 2.1. Introduction
- 3. Market Dynamics
- 3.1. Introduction
- 3.2. Market Drivers
- 3.3. Market Restrains
- 3.4. Market Trends
- 4. Market Factor Analysis
- 4.1. Porters Five Forces
- 4.2. Supply/Value Chain
- 4.3. PESTEL analysis
- 4.4. Market Entropy
- 4.5. Patent/Trademark Analysis
- 5. Global Stadium Ticketing System Analysis, Insights and Forecast, 2019-2031
- 5.1. Market Analysis, Insights and Forecast - by Application
- 5.1.1. Football Field
- 5.1.2. Basketball Hall
- 5.1.3. Volleyball Court
- 5.1.4. Table Tennis Hall
- 5.1.5. Others
- 5.2. Market Analysis, Insights and Forecast - by Types
- 5.2.1. Online Ticketing
- 5.2.2. On-Site Ticketing
- 5.3. Market Analysis, Insights and Forecast - by Region
- 5.3.1. North America
- 5.3.2. South America
- 5.3.3. Europe
- 5.3.4. Middle East & Africa
- 5.3.5. Asia Pacific
- 5.1. Market Analysis, Insights and Forecast - by Application
- 6. North America Stadium Ticketing System Analysis, Insights and Forecast, 2019-2031
- 6.1. Market Analysis, Insights and Forecast - by Application
- 6.1.1. Football Field
- 6.1.2. Basketball Hall
- 6.1.3. Volleyball Court
- 6.1.4. Table Tennis Hall
- 6.1.5. Others
- 6.2. Market Analysis, Insights and Forecast - by Types
- 6.2.1. Online Ticketing
- 6.2.2. On-Site Ticketing
- 6.1. Market Analysis, Insights and Forecast - by Application
- 7. South America Stadium Ticketing System Analysis, Insights and Forecast, 2019-2031
- 7.1. Market Analysis, Insights and Forecast - by Application
- 7.1.1. Football Field
- 7.1.2. Basketball Hall
- 7.1.3. Volleyball Court
- 7.1.4. Table Tennis Hall
- 7.1.5. Others
- 7.2. Market Analysis, Insights and Forecast - by Types
- 7.2.1. Online Ticketing
- 7.2.2. On-Site Ticketing
- 7.1. Market Analysis, Insights and Forecast - by Application
- 8. Europe Stadium Ticketing System Analysis, Insights and Forecast, 2019-2031
- 8.1. Market Analysis, Insights and Forecast - by Application
- 8.1.1. Football Field
- 8.1.2. Basketball Hall
- 8.1.3. Volleyball Court
- 8.1.4. Table Tennis Hall
- 8.1.5. Others
- 8.2. Market Analysis, Insights and Forecast - by Types
- 8.2.1. Online Ticketing
- 8.2.2. On-Site Ticketing
- 8.1. Market Analysis, Insights and Forecast - by Application
- 9. Middle East & Africa Stadium Ticketing System Analysis, Insights and Forecast, 2019-2031
- 9.1. Market Analysis, Insights and Forecast - by Application
- 9.1.1. Football Field
- 9.1.2. Basketball Hall
- 9.1.3. Volleyball Court
- 9.1.4. Table Tennis Hall
- 9.1.5. Others
- 9.2. Market Analysis, Insights and Forecast - by Types
- 9.2.1. Online Ticketing
- 9.2.2. On-Site Ticketing
- 9.1. Market Analysis, Insights and Forecast - by Application
- 10. Asia Pacific Stadium Ticketing System Analysis, Insights and Forecast, 2019-2031
- 10.1. Market Analysis, Insights and Forecast - by Application
- 10.1.1. Football Field
- 10.1.2. Basketball Hall
- 10.1.3. Volleyball Court
- 10.1.4. Table Tennis Hall
- 10.1.5. Others
- 10.2. Market Analysis, Insights and Forecast - by Types
- 10.2.1. Online Ticketing
- 10.2.2. On-Site Ticketing
- 10.1. Market Analysis, Insights and Forecast - by Application
- 11. Competitive Analysis
- 11.1. Global Market Share Analysis 2024
- 11.2. Company Profiles
- 11.2.1 SKIDATA
- 11.2.1.1. Overview
- 11.2.1.2. Products
- 11.2.1.3. SWOT Analysis
- 11.2.1.4. Recent Developments
- 11.2.1.5. Financials (Based on Availability)
- 11.2.2 Global Payments
- 11.2.2.1. Overview
- 11.2.2.2. Products
- 11.2.2.3. SWOT Analysis
- 11.2.2.4. Recent Developments
- 11.2.2.5. Financials (Based on Availability)
- 11.2.3 Square
- 11.2.3.1. Overview
- 11.2.3.2. Products
- 11.2.3.3. SWOT Analysis
- 11.2.3.4. Recent Developments
- 11.2.3.5. Financials (Based on Availability)
- 11.2.4 Tipalti
- 11.2.4.1. Overview
- 11.2.4.2. Products
- 11.2.4.3. SWOT Analysis
- 11.2.4.4. Recent Developments
- 11.2.4.5. Financials (Based on Availability)
- 11.2.5 Chargebee
- 11.2.5.1. Overview
- 11.2.5.2. Products
- 11.2.5.3. SWOT Analysis
- 11.2.5.4. Recent Developments
- 11.2.5.5. Financials (Based on Availability)
- 11.2.6 Infor SunSystems
- 11.2.6.1. Overview
- 11.2.6.2. Products
- 11.2.6.3. SWOT Analysis
- 11.2.6.4. Recent Developments
- 11.2.6.5. Financials (Based on Availability)
- 11.2.7 Elorus
- 11.2.7.1. Overview
- 11.2.7.2. Products
- 11.2.7.3. SWOT Analysis
- 11.2.7.4. Recent Developments
- 11.2.7.5. Financials (Based on Availability)
- 11.2.8 Zoho Subscriptions
- 11.2.8.1. Overview
- 11.2.8.2. Products
- 11.2.8.3. SWOT Analysis
- 11.2.8.4. Recent Developments
- 11.2.8.5. Financials (Based on Availability)
- 11.2.9 EBS Toolbox
- 11.2.9.1. Overview
- 11.2.9.2. Products
- 11.2.9.3. SWOT Analysis
- 11.2.9.4. Recent Developments
- 11.2.9.5. Financials (Based on Availability)
- 11.2.10 Invoice Home
- 11.2.10.1. Overview
- 11.2.10.2. Products
- 11.2.10.3. SWOT Analysis
- 11.2.10.4. Recent Developments
- 11.2.10.5. Financials (Based on Availability)
- 11.2.11 Odoo
- 11.2.11.1. Overview
- 11.2.11.2. Products
- 11.2.11.3. SWOT Analysis
- 11.2.11.4. Recent Developments
- 11.2.11.5. Financials (Based on Availability)
- 11.2.12 Tridens Monetization
- 11.2.12.1. Overview
- 11.2.12.2. Products
- 11.2.12.3. SWOT Analysis
- 11.2.12.4. Recent Developments
- 11.2.12.5. Financials (Based on Availability)
- 11.2.13 More4apps
- 11.2.13.1. Overview
- 11.2.13.2. Products
- 11.2.13.3. SWOT Analysis
- 11.2.13.4. Recent Developments
- 11.2.13.5. Financials (Based on Availability)
- 11.2.14 Bitrix24
- 11.2.14.1. Overview
- 11.2.14.2. Products
- 11.2.14.3. SWOT Analysis
- 11.2.14.4. Recent Developments
- 11.2.14.5. Financials (Based on Availability)
- 11.2.15 PayPal Commerce Platform
- 11.2.15.1. Overview
- 11.2.15.2. Products
- 11.2.15.3. SWOT Analysis
- 11.2.15.4. Recent Developments
- 11.2.15.5. Financials (Based on Availability)
- 11.2.16 QuickBooks Online
- 11.2.16.1. Overview
- 11.2.16.2. Products
- 11.2.16.3. SWOT Analysis
- 11.2.16.4. Recent Developments
- 11.2.16.5. Financials (Based on Availability)
- 11.2.17 Deep Internet Technology
- 11.2.17.1. Overview
- 11.2.17.2. Products
- 11.2.17.3. SWOT Analysis
- 11.2.17.4. Recent Developments
- 11.2.17.5. Financials (Based on Availability)
- 11.2.1 SKIDATA
List of Figures
- Figure 1: Global Stadium Ticketing System Revenue Breakdown (million, %) by Region 2024 & 2032
- Figure 2: North America Stadium Ticketing System Revenue (million), by Application 2024 & 2032
- Figure 3: North America Stadium Ticketing System Revenue Share (%), by Application 2024 & 2032
- Figure 4: North America Stadium Ticketing System Revenue (million), by Types 2024 & 2032
- Figure 5: North America Stadium Ticketing System Revenue Share (%), by Types 2024 & 2032
- Figure 6: North America Stadium Ticketing System Revenue (million), by Country 2024 & 2032
- Figure 7: North America Stadium Ticketing System Revenue Share (%), by Country 2024 & 2032
- Figure 8: South America Stadium Ticketing System Revenue (million), by Application 2024 & 2032
- Figure 9: South America Stadium Ticketing System Revenue Share (%), by Application 2024 & 2032
- Figure 10: South America Stadium Ticketing System Revenue (million), by Types 2024 & 2032
- Figure 11: South America Stadium Ticketing System Revenue Share (%), by Types 2024 & 2032
- Figure 12: South America Stadium Ticketing System Revenue (million), by Country 2024 & 2032
- Figure 13: South America Stadium Ticketing System Revenue Share (%), by Country 2024 & 2032
- Figure 14: Europe Stadium Ticketing System Revenue (million), by Application 2024 & 2032
- Figure 15: Europe Stadium Ticketing System Revenue Share (%), by Application 2024 & 2032
- Figure 16: Europe Stadium Ticketing System Revenue (million), by Types 2024 & 2032
- Figure 17: Europe Stadium Ticketing System Revenue Share (%), by Types 2024 & 2032
- Figure 18: Europe Stadium Ticketing System Revenue (million), by Country 2024 & 2032
- Figure 19: Europe Stadium Ticketing System Revenue Share (%), by Country 2024 & 2032
- Figure 20: Middle East & Africa Stadium Ticketing System Revenue (million), by Application 2024 & 2032
- Figure 21: Middle East & Africa Stadium Ticketing System Revenue Share (%), by Application 2024 & 2032
- Figure 22: Middle East & Africa Stadium Ticketing System Revenue (million), by Types 2024 & 2032
- Figure 23: Middle East & Africa Stadium Ticketing System Revenue Share (%), by Types 2024 & 2032
- Figure 24: Middle East & Africa Stadium Ticketing System Revenue (million), by Country 2024 & 2032
- Figure 25: Middle East & Africa Stadium Ticketing System Revenue Share (%), by Country 2024 & 2032
- Figure 26: Asia Pacific Stadium Ticketing System Revenue (million), by Application 2024 & 2032
- Figure 27: Asia Pacific Stadium Ticketing System Revenue Share (%), by Application 2024 & 2032
- Figure 28: Asia Pacific Stadium Ticketing System Revenue (million), by Types 2024 & 2032
- Figure 29: Asia Pacific Stadium Ticketing System Revenue Share (%), by Types 2024 & 2032
- Figure 30: Asia Pacific Stadium Ticketing System Revenue (million), by Country 2024 & 2032
- Figure 31: Asia Pacific Stadium Ticketing System Revenue Share (%), by Country 2024 & 2032
List of Tables
- Table 1: Global Stadium Ticketing System Revenue million Forecast, by Region 2019 & 2032
- Table 2: Global Stadium Ticketing System Revenue million Forecast, by Application 2019 & 2032
- Table 3: Global Stadium Ticketing System Revenue million Forecast, by Types 2019 & 2032
- Table 4: Global Stadium Ticketing System Revenue million Forecast, by Region 2019 & 2032
- Table 5: Global Stadium Ticketing System Revenue million Forecast, by Application 2019 & 2032
- Table 6: Global Stadium Ticketing System Revenue million Forecast, by Types 2019 & 2032
- Table 7: Global Stadium Ticketing System Revenue million Forecast, by Country 2019 & 2032
- Table 8: United States Stadium Ticketing System Revenue (million) Forecast, by Application 2019 & 2032
- Table 9: Canada Stadium Ticketing System Revenue (million) Forecast, by Application 2019 & 2032
- Table 10: Mexico Stadium Ticketing System Revenue (million) Forecast, by Application 2019 & 2032
- Table 11: Global Stadium Ticketing System Revenue million Forecast, by Application 2019 & 2032
- Table 12: Global Stadium Ticketing System Revenue million Forecast, by Types 2019 & 2032
- Table 13: Global Stadium Ticketing System Revenue million Forecast, by Country 2019 & 2032
- Table 14: Brazil Stadium Ticketing System Revenue (million) Forecast, by Application 2019 & 2032
- Table 15: Argentina Stadium Ticketing System Revenue (million) Forecast, by Application 2019 & 2032
- Table 16: Rest of South America Stadium Ticketing System Revenue (million) Forecast, by Application 2019 & 2032
- Table 17: Global Stadium Ticketing System Revenue million Forecast, by Application 2019 & 2032
- Table 18: Global Stadium Ticketing System Revenue million Forecast, by Types 2019 & 2032
- Table 19: Global Stadium Ticketing System Revenue million Forecast, by Country 2019 & 2032
- Table 20: United Kingdom Stadium Ticketing System Revenue (million) Forecast, by Application 2019 & 2032
- Table 21: Germany Stadium Ticketing System Revenue (million) Forecast, by Application 2019 & 2032
- Table 22: France Stadium Ticketing System Revenue (million) Forecast, by Application 2019 & 2032
- Table 23: Italy Stadium Ticketing System Revenue (million) Forecast, by Application 2019 & 2032
- Table 24: Spain Stadium Ticketing System Revenue (million) Forecast, by Application 2019 & 2032
- Table 25: Russia Stadium Ticketing System Revenue (million) Forecast, by Application 2019 & 2032
- Table 26: Benelux Stadium Ticketing System Revenue (million) Forecast, by Application 2019 & 2032
- Table 27: Nordics Stadium Ticketing System Revenue (million) Forecast, by Application 2019 & 2032
- Table 28: Rest of Europe Stadium Ticketing System Revenue (million) Forecast, by Application 2019 & 2032
- Table 29: Global Stadium Ticketing System Revenue million Forecast, by Application 2019 & 2032
- Table 30: Global Stadium Ticketing System Revenue million Forecast, by Types 2019 & 2032
- Table 31: Global Stadium Ticketing System Revenue million Forecast, by Country 2019 & 2032
- Table 32: Turkey Stadium Ticketing System Revenue (million) Forecast, by Application 2019 & 2032
- Table 33: Israel Stadium Ticketing System Revenue (million) Forecast, by Application 2019 & 2032
- Table 34: GCC Stadium Ticketing System Revenue (million) Forecast, by Application 2019 & 2032
- Table 35: North Africa Stadium Ticketing System Revenue (million) Forecast, by Application 2019 & 2032
- Table 36: South Africa Stadium Ticketing System Revenue (million) Forecast, by Application 2019 & 2032
- Table 37: Rest of Middle East & Africa Stadium Ticketing System Revenue (million) Forecast, by Application 2019 & 2032
- Table 38: Global Stadium Ticketing System Revenue million Forecast, by Application 2019 & 2032
- Table 39: Global Stadium Ticketing System Revenue million Forecast, by Types 2019 & 2032
- Table 40: Global Stadium Ticketing System Revenue million Forecast, by Country 2019 & 2032
- Table 41: China Stadium Ticketing System Revenue (million) Forecast, by Application 2019 & 2032
- Table 42: India Stadium Ticketing System Revenue (million) Forecast, by Application 2019 & 2032
- Table 43: Japan Stadium Ticketing System Revenue (million) Forecast, by Application 2019 & 2032
- Table 44: South Korea Stadium Ticketing System Revenue (million) Forecast, by Application 2019 & 2032
- Table 45: ASEAN Stadium Ticketing System Revenue (million) Forecast, by Application 2019 & 2032
- Table 46: Oceania Stadium Ticketing System Revenue (million) Forecast, by Application 2019 & 2032
- Table 47: Rest of Asia Pacific Stadium Ticketing System Revenue (million) Forecast, by Application 2019 & 2032
Frequently Asked Questions
1. What is the projected Compound Annual Growth Rate (CAGR) of the Stadium Ticketing System?
The projected CAGR is approximately XX%.
2. Which companies are prominent players in the Stadium Ticketing System?
Key companies in the market include SKIDATA, Global Payments, Square, Tipalti, Chargebee, Infor SunSystems, Elorus, Zoho Subscriptions, EBS Toolbox, Invoice Home, Odoo, Tridens Monetization, More4apps, Bitrix24, PayPal Commerce Platform, QuickBooks Online, Deep Internet Technology.
3. What are the main segments of the Stadium Ticketing System?
The market segments include Application, Types.
4. Can you provide details about the market size?
The market size is estimated to be USD XXX million as of 2022.
5. What are some drivers contributing to market growth?
N/A
6. What are the notable trends driving market growth?
N/A
7. Are there any restraints impacting market growth?
N/A
8. Can you provide examples of recent developments in the market?
N/A
9. What pricing options are available for accessing the report?
Pricing options include single-user, multi-user, and enterprise licenses priced at USD 2900.00, USD 4350.00, and USD 5800.00 respectively.
10. Is the market size provided in terms of value or volume?
The market size is provided in terms of value, measured in million.
11. Are there any specific market keywords associated with the report?
Yes, the market keyword associated with the report is "Stadium Ticketing System," which aids in identifying and referencing the specific market segment covered.
12. How do I determine which pricing option suits my needs best?
The pricing options vary based on user requirements and access needs. Individual users may opt for single-user licenses, while businesses requiring broader access may choose multi-user or enterprise licenses for cost-effective access to the report.
13. Are there any additional resources or data provided in the Stadium Ticketing System report?
While the report offers comprehensive insights, it's advisable to review the specific contents or supplementary materials provided to ascertain if additional resources or data are available.
14. How can I stay updated on further developments or reports in the Stadium Ticketing System?
To stay informed about further developments, trends, and reports in the Stadium Ticketing System, consider subscribing to industry newsletters, following relevant companies and organizations, or regularly checking reputable industry news sources and publications.
Methodology
Step 1 - Identification of Relevant Samples Size from Population Database


Step 2 - Approaches for Defining Global Market Size (Value, Volume* & Price*)

Note*: In applicable scenarios
Step 3 - Data Sources
Primary Research
- Web Analytics
- Survey Reports
- Research Institute
- Latest Research Reports
- Opinion Leaders
Secondary Research
- Annual Reports
- White Paper
- Latest Press Release
- Industry Association
- Paid Database
- Investor Presentations

Step 4 - Data Triangulation
Involves using different sources of information in order to increase the validity of a study
These sources are likely to be stakeholders in a program - participants, other researchers, program staff, other community members, and so on.
Then we put all data in single framework & apply various statistical tools to find out the dynamic on the market.
During the analysis stage, feedback from the stakeholder groups would be compared to determine areas of agreement as well as areas of divergence
