

Key Insights
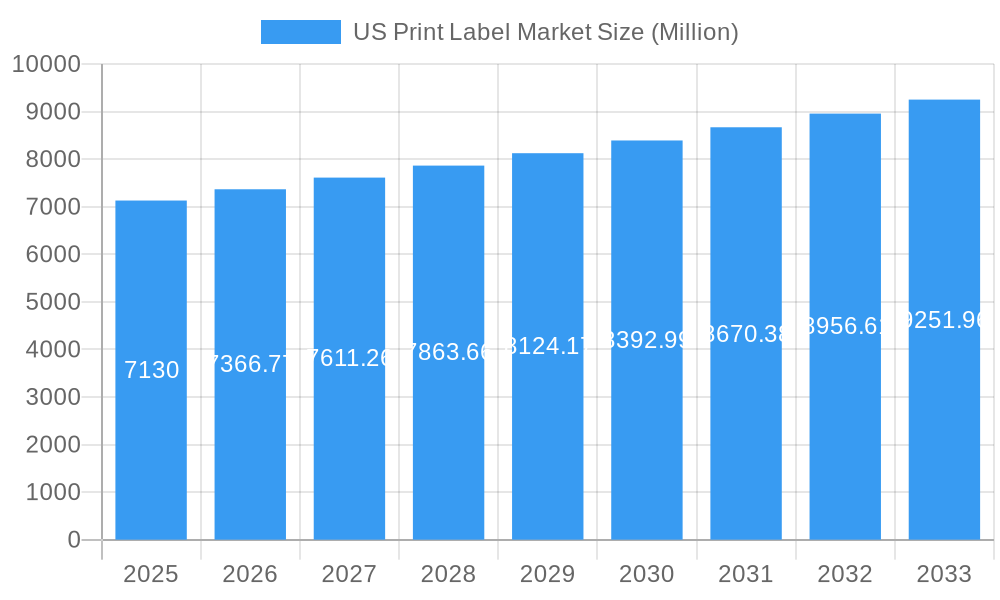
The US print label market, a significant segment of the broader packaging industry, is projected to experience steady growth, driven by the increasing demand for consumer goods and the ongoing shift towards customized, branded packaging. With a 2025 market size of $7.13 billion and a CAGR of 3.19%, the market is expected to reach approximately $9.0 billion by 2033. This growth is fueled by several key factors. The rise of e-commerce necessitates efficient and informative product labeling, boosting demand for pressure-sensitive and linerless labels. The food and beverage sector, a major end-user, continues to drive demand for high-quality, visually appealing labels that meet stringent regulatory requirements. Furthermore, advancements in print technologies, such as inkjet and digital printing, are enabling shorter print runs, personalized labels, and enhanced design capabilities, further stimulating market expansion. The growth is also being influenced by the increasing adoption of sustainable and eco-friendly label materials, aligning with the broader trend towards environmentally conscious packaging solutions.
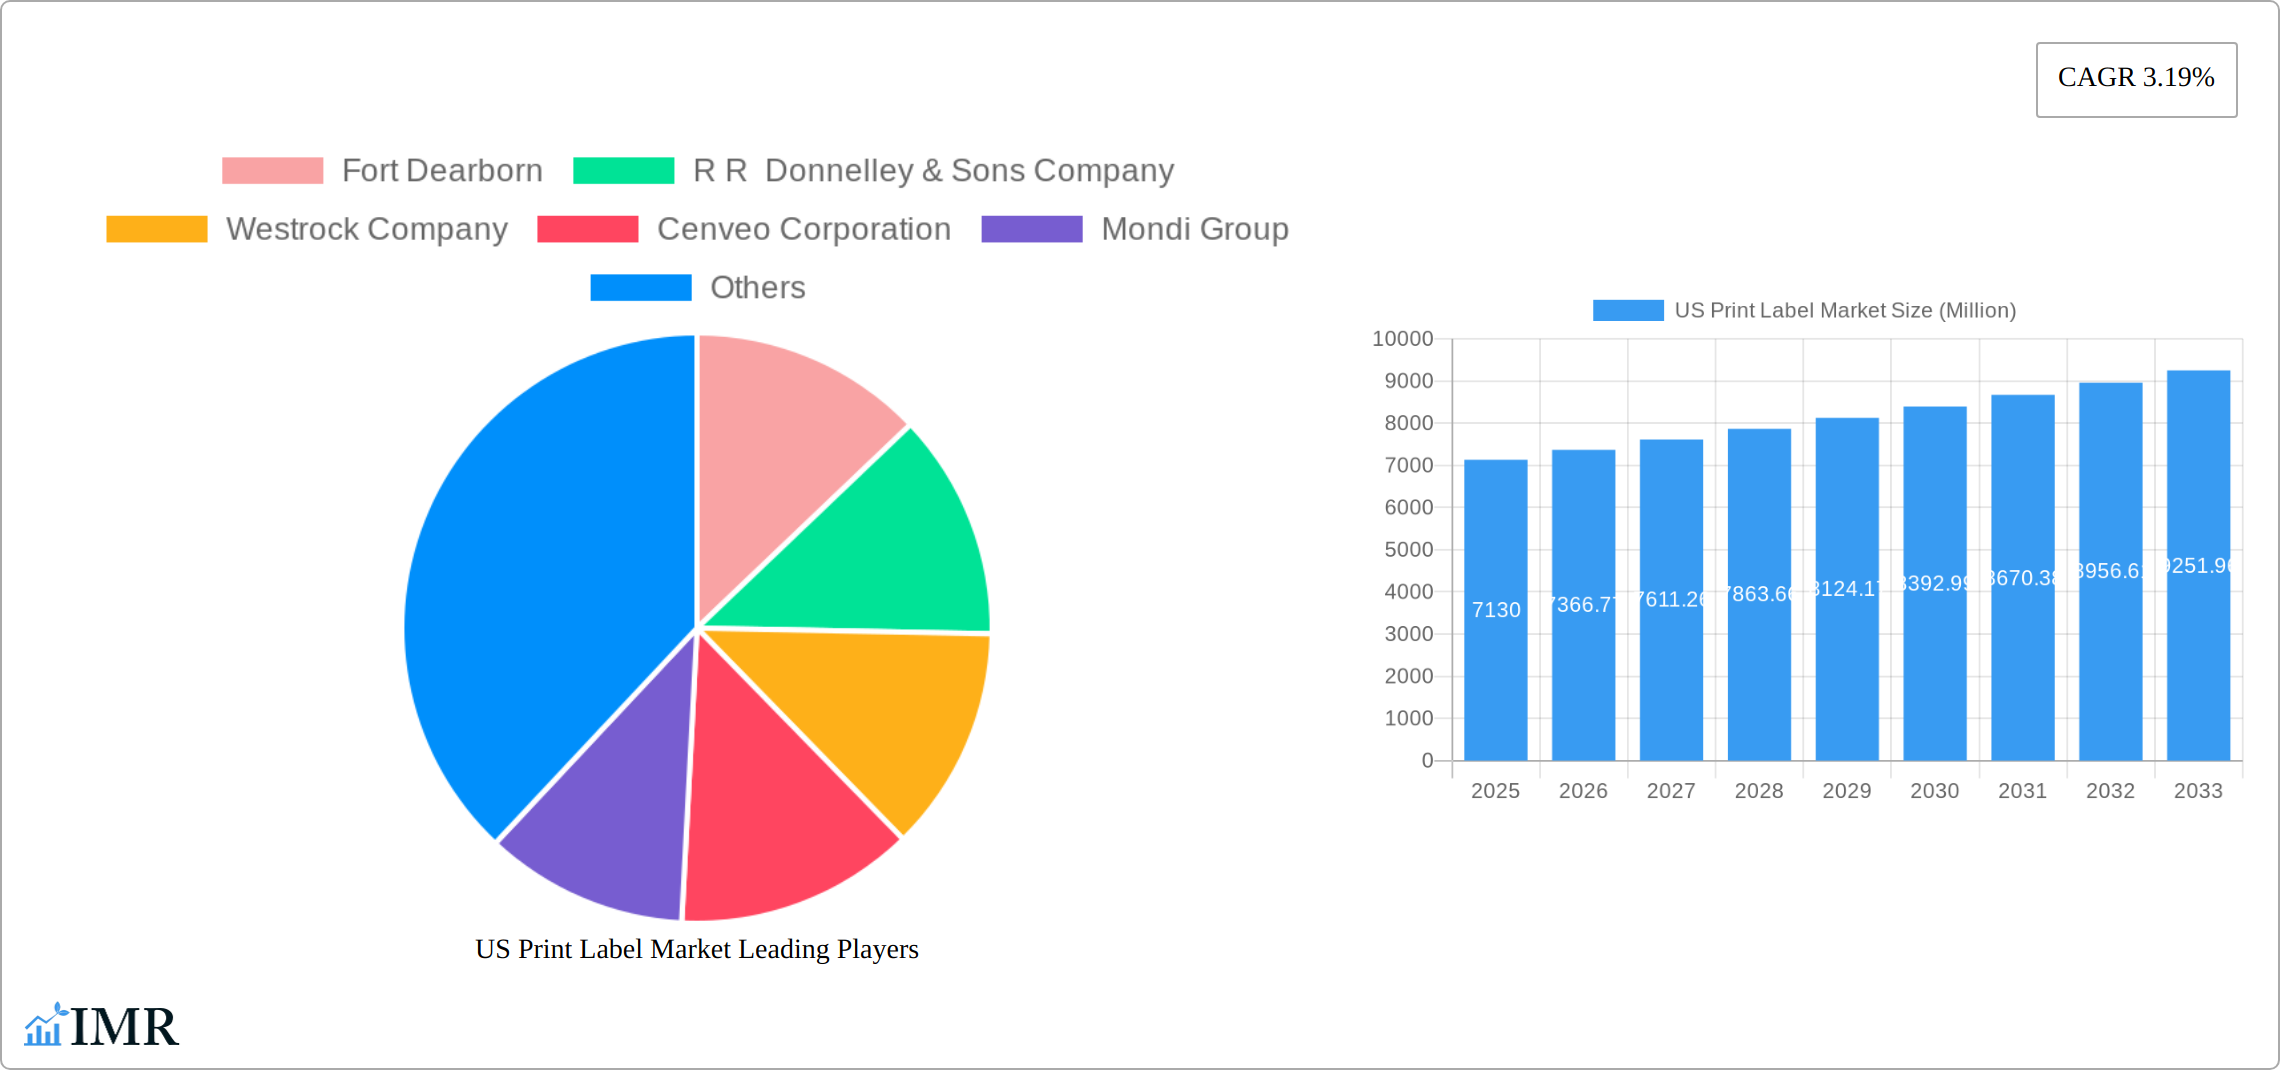
US Print Label Market Market Size (In Billion)
However, the market faces some challenges. Fluctuations in raw material prices, particularly paper and adhesives, can impact profitability. Competition from other labeling technologies, such as RFID tags and digital printing alternatives, also presents a restraint. Nevertheless, the market's diversification across various label formats (wet-glue, pressure-sensitive, etc.) and end-user industries (food, healthcare, cosmetics, etc.) provides resilience against specific sector downturns. Key players such as Fort Dearborn, R.R. Donnelley & Sons, and Avery Dennison are leveraging technological innovation and strategic partnerships to maintain their market positions and capitalize on growth opportunities. The geographic distribution across the US, with regional variations in demand based on industrial concentration, presents a complex yet dynamic landscape ripe for further market analysis and strategic investments.
US Print Label Market Company Market Share
This in-depth report provides a comprehensive analysis of the US print label market, encompassing market size, growth trends, competitive landscape, and future outlook. It's an essential resource for industry professionals, investors, and strategic decision-makers seeking to understand this dynamic sector. The report covers the parent market (Packaging Industry) and child market segments, providing granular insights for informed business strategies. The study period spans from 2019 to 2033, with 2025 as the base and estimated year.
US Print Label Market Market Dynamics & Structure
The US print label market is characterized by a dynamic and moderately consolidated structure. A mix of established global leaders and agile, specialized niche operators coexists, each contributing to the market's vibrancy. Market concentration is influenced by a confluence of factors, including rapid technological advancements, evolving regulatory landscapes, and a persistent, increasing demand for highly specialized labels across a diverse array of end-use industries. The market thrives on innovation in print processes and label formats, which are critical enablers of enhanced product differentiation, improved brand storytelling, and sophisticated functionality. Stringent regulatory requirements, particularly in the food and pharmaceutical sectors, dictate critical aspects of labeling and packaging, thereby shaping material choices and printing methodologies. The competitive terrain is robust, featuring established players offering comprehensive product and service portfolios alongside smaller, agile firms that excel in tailored solutions for niche markets. Mergers and acquisitions (M&A) remain a significant strategic tool, with recent high-profile acquisitions by industry giants like Avery Dennison underscoring ongoing consolidation and ambitious expansion strategies. This trend is anticipated to continue, potentially leading to further market concentration and the emergence of even more integrated solutions.
- Market Concentration: Moderately Consolidated. The top 5 players are estimated to hold approximately 55-60% of the market share in 2024, with a continuous trend towards consolidation.
- Technological Innovation Drivers: Key advancements include high-speed digital printing, the development of advanced flexible packaging solutions, and the integration of sustainable and biodegradable materials.
- Regulatory Frameworks: FDA and other governmental regulations for food, beverage, pharmaceutical, and medical device labeling are pivotal, directly impacting material selection, ink choices, and printing techniques to ensure safety and compliance.
- Competitive Product Substitutes: While traditional print label methods remain dominant, digital printing technologies, direct printing onto packaging, and emerging smart tagging solutions like RFID and NFC are increasingly presenting viable alternatives, especially for variable data and short runs.
- End-User Demographics: Significant growth is being driven by the booming e-commerce sector, the robust food & beverage industry's need for shelf appeal and traceability, and the highly regulated healthcare and pharmaceutical sectors.
- M&A Trends: The market has witnessed a consistent increase in consolidation through strategic acquisitions and mergers, aimed at expanding geographical reach, diversifying product portfolios, and acquiring specialized technological capabilities. Over 15 significant M&A deals have been reported in the last 5 years, reflecting a strategic imperative to scale and innovate.
US Print Label Market Growth Trends & Insights
The US print label market has experienced steady growth over the historical period (2019-2024), driven by factors such as the rising demand for packaged goods, the expansion of e-commerce, and technological advancements in label printing and materials. The market size reached xx million units in 2024, growing at a CAGR of xx% from 2019 to 2024. This growth trajectory is projected to continue into the forecast period (2025-2033), with a predicted CAGR of xx%. Several factors are contributing to this sustained growth: increasing demand for customized labels, the adoption of sustainable packaging solutions, and the emergence of new label technologies. Consumer preference shifts towards personalized products and brands fuel the demand for unique label designs and functionalities. Technological disruptions like the adoption of digital printing technologies are improving efficiency and lowering production costs, driving market expansion. The market penetration of digitally printed labels is increasing steadily, particularly in short-run and customized applications. This trend, along with the growing popularity of linerless and sustainable labels, is expected to further fuel market growth.
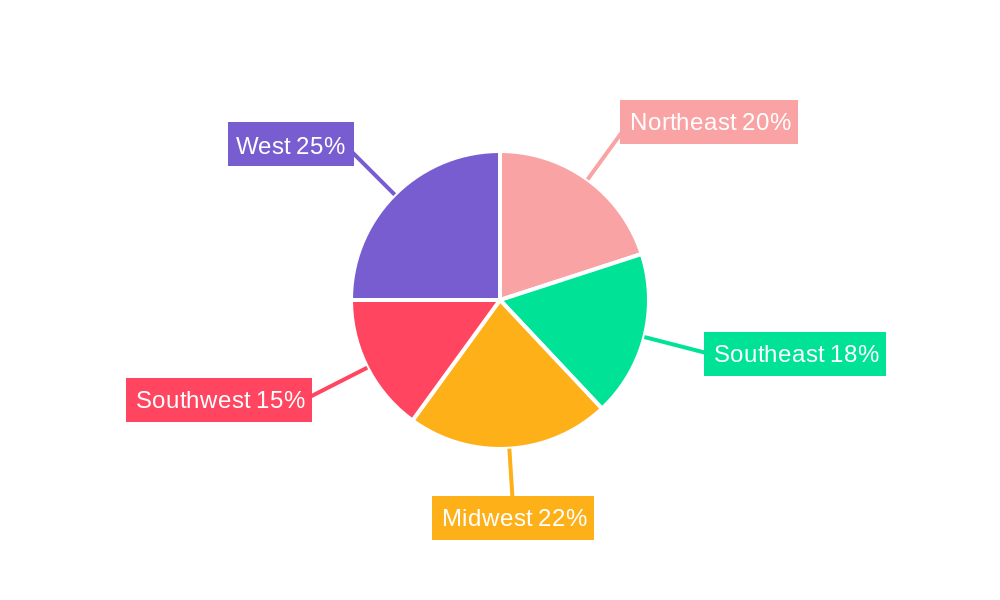
Dominant Regions, Countries, or Segments in US Print Label Market
The US print label market exhibits a strong geographical and segmental diversity, with growth trajectories varying significantly across different regions and states. However, certain segments within the market consistently demonstrate superior growth potential and market dominance. The pressure-sensitive label format continues to reign supreme, owing to its unparalleled versatility, user-friendliness in application, and adaptability to a vast range of substrates and end-use requirements. Within print processes, flexography maintains a substantial market share, primarily driven by its inherent cost-effectiveness and efficiency in handling high-volume production runs. The food and beverage industry remains the largest and most influential end-user sector, with the healthcare and cosmetics industries also contributing significantly to overall market demand. Collectively, these key sectors account for over 70% of the total market demand.
- By Print Process: Flexography (estimated 8.5 billion units) leads in volume, followed by Offset Lithography (estimated 3.2 billion units). Flexography is experiencing the fastest growth due to its cost-effectiveness for large runs and increasing advancements in its capabilities.
- By Label Format: Pressure-sensitive labels (estimated 12 billion units) continue to exhibit dominant market share due to their wide applicability and ease of use across industries.
- By End-user Industry: Food & Beverage (estimated 9.8 billion units) commands the largest portion of market demand, driven by consumer packaged goods and the need for product differentiation.
- Key Growth Drivers (by Segment):
- Flexography: Its proven cost-effectiveness for high-volume production, coupled with improvements in plate technology and ink formulations, makes it a continuing preferred choice.
- Pressure-sensitive labels: The inherent versatility, ease of application on automated lines, and availability of a wide range of facestock and adhesive options drive their sustained popularity.
- Food & Beverage: The sustained demand for packaged food products, coupled with the increasing emphasis on brand visibility, traceability, and regulatory compliance, fuels continuous growth in this segment.
US Print Label Market Product Landscape
The US print label market features a diverse range of products, catering to specific end-user needs and applications. Innovations focus on enhancing label durability, improving printability, and incorporating advanced features such as tamper evidence and RFID technology. There's a growing demand for sustainable labels made from recycled materials and utilizing eco-friendly inks. Unique selling propositions frequently include enhanced adhesive properties, improved resistance to moisture and chemicals, and specialized design features tailored to individual product requirements. Technological advancements in digital printing are driving customized label designs at scale, enhancing brand appeal and consumer engagement.
Key Drivers, Barriers & Challenges in US Print Label Market
Key Drivers:
- The ever-increasing demand for convenient and appealing packaged goods across a wide spectrum of consumer and industrial end-user industries is a primary growth engine.
- The exponential growth of e-commerce necessitates efficient, robust, and informative product identification and shipping labels, driving demand for specialized printing solutions.
- Continuous technological advancements in digital printing, the development of novel materials science for label substrates and adhesives, and the sophistication of label application technologies are creating new possibilities and efficiencies.
- A growing consumer preference for personalized products and unique brand experiences is pushing manufacturers to adopt more customized and eye-catching labeling strategies.
Challenges & Restraints:
- Significant fluctuations in the prices of key raw materials, including paper pulp, specialty films, and various adhesives, can directly impact production costs and profitability margins.
- Increasing competition from alternative labeling and identification technologies, such as advanced digital printing for direct-to-package applications, RFID tagging, and other smart solutions, presents a competitive challenge to traditional print label methods.
- Stringent and evolving regulatory compliance requirements pertaining to product labeling and packaging safety, especially in sensitive sectors like food and pharmaceuticals, can necessitate costly material changes and process adjustments.
- Persistent supply chain disruptions and complex logistical challenges can impact the timely procurement of raw materials and the consistent delivery of finished label products, leading to production delays and increased operational costs. Approximately 25% of market players reported significant supply chain issues impacting their operations in 2024.
Emerging Opportunities in US Print Label Market
- Sustainable and Eco-Friendly Labels: A significant and growing consumer demand for environmentally conscious packaging solutions is creating a substantial market opportunity for labels made from recycled materials, biodegradable substrates, and with reduced environmental footprints.
- Smart Labels with Embedded Technology: The integration of advanced technologies like RFID, NFC (Near Field Communication), QR codes, and IoT sensors within labels offers enhanced product tracking, authentication, supply chain visibility, and direct consumer engagement opportunities.
- Specialized Labels for Niche Applications: A rising demand for labels with unique functionalities, such as high-temperature resistance, chemical inertness, tamper-evidence, security features, and advanced aesthetic finishes, is creating lucrative opportunities in specialized sectors like healthcare, pharmaceuticals, electronics, and industrial manufacturing.
- Expansion into Untapped Markets: While the US market is mature, opportunities exist in catering to underserved niches, emerging geographical regions within the US that are experiencing rapid industrial growth, and specific application areas that are currently less penetrated.
Growth Accelerators in the US Print Label Market Industry
Technological breakthroughs in printing technologies, such as inkjet and digital printing, are driving innovation and enhancing production efficiency. Strategic partnerships and collaborations between label manufacturers, material suppliers, and technology providers are facilitating the development of new products and applications. Moreover, market expansion strategies targeting new end-user industries and regions are contributing to the long-term growth of the US print label market. These factors collectively create a positive outlook for sustained growth in the coming years.
Key Players Shaping the US Print Label Market Market
- Fort Dearborn
- R R Donnelley & Sons Company
- Westrock Company
- Cenveo Corporation
- Mondi Group
- Multi Color Corporation
- Avery Dennison Corporation
- Taylor Corporation
- Ahlstrom-munksjö Oyj
- Brady Corporation
Notable Milestones in US Print Label Market Sector
- February 2021: R.R. Donnelley & Sons Company expanded operations in Sacramento, creating Pacific Standard Print, enhancing its digital and sheetfed capabilities.
- March 2021: Avery Dennison Corporation acquired JDC Solutions, Inc. for USD 24 million, expanding its pressure-sensitive tape portfolio.
In-Depth US Print Label Market Market Outlook
The US print label market is projected to experience sustained and robust growth, propelled by a combination of ongoing technological innovations, a dynamic demand landscape across diverse end-user industries, and the accelerating adoption of environmentally responsible and sustainable practices. Significant opportunities lie in the development and deployment of cutting-edge, innovative label solutions that address evolving market needs, the strategic expansion into specialized niche markets, and the forging of impactful partnerships to effectively capture and expand market share. The overarching focus on sustainability, coupled with the increasing integration of sophisticated smart technologies within labels, will continue to be pivotal in shaping market dynamics and will present substantial, long-term growth prospects for forward-thinking industry players. The market is expected to witness a CAGR of approximately 4.5% over the next five years.
US Print Label Market Segmentation
-
1. Print Process
- 1.1. Offset Lithography
- 1.2. Gravure
- 1.3. Flexography
- 1.4. Screen
- 1.5. Letterpress
- 1.6. Electrophotography
- 1.7. Inkjet
-
2. Label Format
- 2.1. Wet-glue Labels
- 2.2. Pressure-sensitive Labels
- 2.3. Linerless Labels
- 2.4. Multi-part Tracking Labels
- 2.5. In-mold Labels
- 2.6. Shrink and Stretch Sleeves
-
3. End-user Industry
- 3.1. Food
- 3.2. Beverage
- 3.3. Healthcare
- 3.4. Cosmetics
- 3.5. Household
- 3.6. Industri
- 3.7. Logistics
- 3.8. Other End-user Industries
US Print Label Market Segmentation By Geography
-
1. North America
- 1.1. United States
- 1.2. Canada
- 1.3. Mexico
-
2. South America
- 2.1. Brazil
- 2.2. Argentina
- 2.3. Rest of South America
-
3. Europe
- 3.1. United Kingdom
- 3.2. Germany
- 3.3. France
- 3.4. Italy
- 3.5. Spain
- 3.6. Russia
- 3.7. Benelux
- 3.8. Nordics
- 3.9. Rest of Europe
-
4. Middle East & Africa
- 4.1. Turkey
- 4.2. Israel
- 4.3. GCC
- 4.4. North Africa
- 4.5. South Africa
- 4.6. Rest of Middle East & Africa
-
5. Asia Pacific
- 5.1. China
- 5.2. India
- 5.3. Japan
- 5.4. South Korea
- 5.5. ASEAN
- 5.6. Oceania
- 5.7. Rest of Asia Pacific
US Print Label Market Regional Market Share
Geographic Coverage of US Print Label Market
US Print Label Market REPORT HIGHLIGHTS
| Aspects | Details |
|---|---|
| Study Period | 2020-2034 |
| Base Year | 2025 |
| Estimated Year | 2026 |
| Forecast Period | 2026-2034 |
| Historical Period | 2020-2025 |
| Growth Rate | CAGR of 3.19% from 2020-2034 |
| Segmentation |
|
Table of Contents
- 1. Introduction
- 1.1. Research Scope
- 1.2. Market Segmentation
- 1.3. Research Objective
- 1.4. Definitions and Assumptions
- 2. Executive Summary
- 2.1. Market Snapshot
- 3. Market Dynamics
- 3.1. Market Drivers
- 3.2. Market Restrains
- 3.3. Market Trends
- 3.4. Market Opportunities
- 4. Market Factor Analysis
- 4.1. Porters Five Forces
- 4.1.1. Bargaining Power of Suppliers
- 4.1.2. Bargaining Power of Buyers
- 4.1.3. Threat of New Entrants
- 4.1.4. Threat of Substitutes
- 4.1.5. Competitive Rivalry
- 4.2. PESTEL analysis
- 4.3. BCG Analysis
- 4.3.1. Stars (High Growth, High Market Share)
- 4.3.2. Cash Cows (Low Growth, High Market Share)
- 4.3.3. Question Mark (High Growth, Low Market Share)
- 4.3.4. Dogs (Low Growth, Low Market Share)
- 4.4. Ansoff Matrix Analysis
- 4.5. Supply Chain Analysis
- 4.6. Regulatory Landscape
- 4.7. Current Market Potential and Opportunity Assessment (TAM–SAM–SOM Framework)
- 4.8. IMR Analyst Note
- 4.1. Porters Five Forces
- 5. Market Analysis, Insights and Forecast 2021-2033
- 5.1. Market Analysis, Insights and Forecast - by Print Process
- 5.1.1. Offset Lithography
- 5.1.2. Gravure
- 5.1.3. Flexography
- 5.1.4. Screen
- 5.1.5. Letterpress
- 5.1.6. Electrophotography
- 5.1.7. Inkjet
- 5.2. Market Analysis, Insights and Forecast - by Label Format
- 5.2.1. Wet-glue Labels
- 5.2.2. Pressure-sensitive Labels
- 5.2.3. Linerless Labels
- 5.2.4. Multi-part Tracking Labels
- 5.2.5. In-mold Labels
- 5.2.6. Shrink and Stretch Sleeves
- 5.3. Market Analysis, Insights and Forecast - by End-user Industry
- 5.3.1. Food
- 5.3.2. Beverage
- 5.3.3. Healthcare
- 5.3.4. Cosmetics
- 5.3.5. Household
- 5.3.6. Industri
- 5.3.7. Logistics
- 5.3.8. Other End-user Industries
- 5.4. Market Analysis, Insights and Forecast - by Region
- 5.4.1. North America
- 5.4.2. South America
- 5.4.3. Europe
- 5.4.4. Middle East & Africa
- 5.4.5. Asia Pacific
- 5.1. Market Analysis, Insights and Forecast - by Print Process
- 6. Global US Print Label Market Analysis, Insights and Forecast, 2021-2033
- 6.1. Market Analysis, Insights and Forecast - by Print Process
- 6.1.1. Offset Lithography
- 6.1.2. Gravure
- 6.1.3. Flexography
- 6.1.4. Screen
- 6.1.5. Letterpress
- 6.1.6. Electrophotography
- 6.1.7. Inkjet
- 6.2. Market Analysis, Insights and Forecast - by Label Format
- 6.2.1. Wet-glue Labels
- 6.2.2. Pressure-sensitive Labels
- 6.2.3. Linerless Labels
- 6.2.4. Multi-part Tracking Labels
- 6.2.5. In-mold Labels
- 6.2.6. Shrink and Stretch Sleeves
- 6.3. Market Analysis, Insights and Forecast - by End-user Industry
- 6.3.1. Food
- 6.3.2. Beverage
- 6.3.3. Healthcare
- 6.3.4. Cosmetics
- 6.3.5. Household
- 6.3.6. Industri
- 6.3.7. Logistics
- 6.3.8. Other End-user Industries
- 6.1. Market Analysis, Insights and Forecast - by Print Process
- 7. North America US Print Label Market Analysis, Insights and Forecast, 2020-2032
- 7.1. Market Analysis, Insights and Forecast - by Print Process
- 7.1.1. Offset Lithography
- 7.1.2. Gravure
- 7.1.3. Flexography
- 7.1.4. Screen
- 7.1.5. Letterpress
- 7.1.6. Electrophotography
- 7.1.7. Inkjet
- 7.2. Market Analysis, Insights and Forecast - by Label Format
- 7.2.1. Wet-glue Labels
- 7.2.2. Pressure-sensitive Labels
- 7.2.3. Linerless Labels
- 7.2.4. Multi-part Tracking Labels
- 7.2.5. In-mold Labels
- 7.2.6. Shrink and Stretch Sleeves
- 7.3. Market Analysis, Insights and Forecast - by End-user Industry
- 7.3.1. Food
- 7.3.2. Beverage
- 7.3.3. Healthcare
- 7.3.4. Cosmetics
- 7.3.5. Household
- 7.3.6. Industri
- 7.3.7. Logistics
- 7.3.8. Other End-user Industries
- 7.1. Market Analysis, Insights and Forecast - by Print Process
- 8. South America US Print Label Market Analysis, Insights and Forecast, 2020-2032
- 8.1. Market Analysis, Insights and Forecast - by Print Process
- 8.1.1. Offset Lithography
- 8.1.2. Gravure
- 8.1.3. Flexography
- 8.1.4. Screen
- 8.1.5. Letterpress
- 8.1.6. Electrophotography
- 8.1.7. Inkjet
- 8.2. Market Analysis, Insights and Forecast - by Label Format
- 8.2.1. Wet-glue Labels
- 8.2.2. Pressure-sensitive Labels
- 8.2.3. Linerless Labels
- 8.2.4. Multi-part Tracking Labels
- 8.2.5. In-mold Labels
- 8.2.6. Shrink and Stretch Sleeves
- 8.3. Market Analysis, Insights and Forecast - by End-user Industry
- 8.3.1. Food
- 8.3.2. Beverage
- 8.3.3. Healthcare
- 8.3.4. Cosmetics
- 8.3.5. Household
- 8.3.6. Industri
- 8.3.7. Logistics
- 8.3.8. Other End-user Industries
- 8.1. Market Analysis, Insights and Forecast - by Print Process
- 9. Europe US Print Label Market Analysis, Insights and Forecast, 2020-2032
- 9.1. Market Analysis, Insights and Forecast - by Print Process
- 9.1.1. Offset Lithography
- 9.1.2. Gravure
- 9.1.3. Flexography
- 9.1.4. Screen
- 9.1.5. Letterpress
- 9.1.6. Electrophotography
- 9.1.7. Inkjet
- 9.2. Market Analysis, Insights and Forecast - by Label Format
- 9.2.1. Wet-glue Labels
- 9.2.2. Pressure-sensitive Labels
- 9.2.3. Linerless Labels
- 9.2.4. Multi-part Tracking Labels
- 9.2.5. In-mold Labels
- 9.2.6. Shrink and Stretch Sleeves
- 9.3. Market Analysis, Insights and Forecast - by End-user Industry
- 9.3.1. Food
- 9.3.2. Beverage
- 9.3.3. Healthcare
- 9.3.4. Cosmetics
- 9.3.5. Household
- 9.3.6. Industri
- 9.3.7. Logistics
- 9.3.8. Other End-user Industries
- 9.1. Market Analysis, Insights and Forecast - by Print Process
- 10. Middle East & Africa US Print Label Market Analysis, Insights and Forecast, 2020-2032
- 10.1. Market Analysis, Insights and Forecast - by Print Process
- 10.1.1. Offset Lithography
- 10.1.2. Gravure
- 10.1.3. Flexography
- 10.1.4. Screen
- 10.1.5. Letterpress
- 10.1.6. Electrophotography
- 10.1.7. Inkjet
- 10.2. Market Analysis, Insights and Forecast - by Label Format
- 10.2.1. Wet-glue Labels
- 10.2.2. Pressure-sensitive Labels
- 10.2.3. Linerless Labels
- 10.2.4. Multi-part Tracking Labels
- 10.2.5. In-mold Labels
- 10.2.6. Shrink and Stretch Sleeves
- 10.3. Market Analysis, Insights and Forecast - by End-user Industry
- 10.3.1. Food
- 10.3.2. Beverage
- 10.3.3. Healthcare
- 10.3.4. Cosmetics
- 10.3.5. Household
- 10.3.6. Industri
- 10.3.7. Logistics
- 10.3.8. Other End-user Industries
- 10.1. Market Analysis, Insights and Forecast - by Print Process
- 11. Asia Pacific US Print Label Market Analysis, Insights and Forecast, 2020-2032
- 11.1. Market Analysis, Insights and Forecast - by Print Process
- 11.1.1. Offset Lithography
- 11.1.2. Gravure
- 11.1.3. Flexography
- 11.1.4. Screen
- 11.1.5. Letterpress
- 11.1.6. Electrophotography
- 11.1.7. Inkjet
- 11.2. Market Analysis, Insights and Forecast - by Label Format
- 11.2.1. Wet-glue Labels
- 11.2.2. Pressure-sensitive Labels
- 11.2.3. Linerless Labels
- 11.2.4. Multi-part Tracking Labels
- 11.2.5. In-mold Labels
- 11.2.6. Shrink and Stretch Sleeves
- 11.3. Market Analysis, Insights and Forecast - by End-user Industry
- 11.3.1. Food
- 11.3.2. Beverage
- 11.3.3. Healthcare
- 11.3.4. Cosmetics
- 11.3.5. Household
- 11.3.6. Industri
- 11.3.7. Logistics
- 11.3.8. Other End-user Industries
- 11.1. Market Analysis, Insights and Forecast - by Print Process
- 12. Competitive Analysis
- 12.1. Company Profiles
- 12.1.1 Fort Dearborn
- 12.1.1.1. Company Overview
- 12.1.1.2. Products
- 12.1.1.3. Company Financials
- 12.1.1.4. SWOT Analysis
- 12.1.2 R R Donnelley & Sons Company
- 12.1.2.1. Company Overview
- 12.1.2.2. Products
- 12.1.2.3. Company Financials
- 12.1.2.4. SWOT Analysis
- 12.1.3 Westrock Company
- 12.1.3.1. Company Overview
- 12.1.3.2. Products
- 12.1.3.3. Company Financials
- 12.1.3.4. SWOT Analysis
- 12.1.4 Cenveo Corporation
- 12.1.4.1. Company Overview
- 12.1.4.2. Products
- 12.1.4.3. Company Financials
- 12.1.4.4. SWOT Analysis
- 12.1.5 Mondi Group
- 12.1.5.1. Company Overview
- 12.1.5.2. Products
- 12.1.5.3. Company Financials
- 12.1.5.4. SWOT Analysis
- 12.1.6 Multi Color Corporation
- 12.1.6.1. Company Overview
- 12.1.6.2. Products
- 12.1.6.3. Company Financials
- 12.1.6.4. SWOT Analysis
- 12.1.7 Avery Dennison Corporation
- 12.1.7.1. Company Overview
- 12.1.7.2. Products
- 12.1.7.3. Company Financials
- 12.1.7.4. SWOT Analysis
- 12.1.8 Taylor Corporation*List Not Exhaustive
- 12.1.8.1. Company Overview
- 12.1.8.2. Products
- 12.1.8.3. Company Financials
- 12.1.8.4. SWOT Analysis
- 12.1.9 Ahlstrom-munksjö Oyj
- 12.1.9.1. Company Overview
- 12.1.9.2. Products
- 12.1.9.3. Company Financials
- 12.1.9.4. SWOT Analysis
- 12.1.10 Brady Corporation
- 12.1.10.1. Company Overview
- 12.1.10.2. Products
- 12.1.10.3. Company Financials
- 12.1.10.4. SWOT Analysis
- 12.1.1 Fort Dearborn
- 12.2. Market Entropy
- 12.2.1 Company's Key Areas Served
- 12.2.2 Recent Developments
- 12.3. Company Market Share Analysis 2025
- 12.3.1 Top 5 Companies Market Share Analysis
- 12.3.2 Top 3 Companies Market Share Analysis
- 12.4. List of Potential Customers
- 13. Research Methodology
List of Figures
- Figure 1: Global US Print Label Market Revenue Breakdown (Million, %) by Region 2025 & 2033
- Figure 2: North America US Print Label Market Revenue (Million), by Print Process 2025 & 2033
- Figure 3: North America US Print Label Market Revenue Share (%), by Print Process 2025 & 2033
- Figure 4: North America US Print Label Market Revenue (Million), by Label Format 2025 & 2033
- Figure 5: North America US Print Label Market Revenue Share (%), by Label Format 2025 & 2033
- Figure 6: North America US Print Label Market Revenue (Million), by End-user Industry 2025 & 2033
- Figure 7: North America US Print Label Market Revenue Share (%), by End-user Industry 2025 & 2033
- Figure 8: North America US Print Label Market Revenue (Million), by Country 2025 & 2033
- Figure 9: North America US Print Label Market Revenue Share (%), by Country 2025 & 2033
- Figure 10: South America US Print Label Market Revenue (Million), by Print Process 2025 & 2033
- Figure 11: South America US Print Label Market Revenue Share (%), by Print Process 2025 & 2033
- Figure 12: South America US Print Label Market Revenue (Million), by Label Format 2025 & 2033
- Figure 13: South America US Print Label Market Revenue Share (%), by Label Format 2025 & 2033
- Figure 14: South America US Print Label Market Revenue (Million), by End-user Industry 2025 & 2033
- Figure 15: South America US Print Label Market Revenue Share (%), by End-user Industry 2025 & 2033
- Figure 16: South America US Print Label Market Revenue (Million), by Country 2025 & 2033
- Figure 17: South America US Print Label Market Revenue Share (%), by Country 2025 & 2033
- Figure 18: Europe US Print Label Market Revenue (Million), by Print Process 2025 & 2033
- Figure 19: Europe US Print Label Market Revenue Share (%), by Print Process 2025 & 2033
- Figure 20: Europe US Print Label Market Revenue (Million), by Label Format 2025 & 2033
- Figure 21: Europe US Print Label Market Revenue Share (%), by Label Format 2025 & 2033
- Figure 22: Europe US Print Label Market Revenue (Million), by End-user Industry 2025 & 2033
- Figure 23: Europe US Print Label Market Revenue Share (%), by End-user Industry 2025 & 2033
- Figure 24: Europe US Print Label Market Revenue (Million), by Country 2025 & 2033
- Figure 25: Europe US Print Label Market Revenue Share (%), by Country 2025 & 2033
- Figure 26: Middle East & Africa US Print Label Market Revenue (Million), by Print Process 2025 & 2033
- Figure 27: Middle East & Africa US Print Label Market Revenue Share (%), by Print Process 2025 & 2033
- Figure 28: Middle East & Africa US Print Label Market Revenue (Million), by Label Format 2025 & 2033
- Figure 29: Middle East & Africa US Print Label Market Revenue Share (%), by Label Format 2025 & 2033
- Figure 30: Middle East & Africa US Print Label Market Revenue (Million), by End-user Industry 2025 & 2033
- Figure 31: Middle East & Africa US Print Label Market Revenue Share (%), by End-user Industry 2025 & 2033
- Figure 32: Middle East & Africa US Print Label Market Revenue (Million), by Country 2025 & 2033
- Figure 33: Middle East & Africa US Print Label Market Revenue Share (%), by Country 2025 & 2033
- Figure 34: Asia Pacific US Print Label Market Revenue (Million), by Print Process 2025 & 2033
- Figure 35: Asia Pacific US Print Label Market Revenue Share (%), by Print Process 2025 & 2033
- Figure 36: Asia Pacific US Print Label Market Revenue (Million), by Label Format 2025 & 2033
- Figure 37: Asia Pacific US Print Label Market Revenue Share (%), by Label Format 2025 & 2033
- Figure 38: Asia Pacific US Print Label Market Revenue (Million), by End-user Industry 2025 & 2033
- Figure 39: Asia Pacific US Print Label Market Revenue Share (%), by End-user Industry 2025 & 2033
- Figure 40: Asia Pacific US Print Label Market Revenue (Million), by Country 2025 & 2033
- Figure 41: Asia Pacific US Print Label Market Revenue Share (%), by Country 2025 & 2033
List of Tables
- Table 1: Global US Print Label Market Revenue Million Forecast, by Print Process 2020 & 2033
- Table 2: Global US Print Label Market Revenue Million Forecast, by Label Format 2020 & 2033
- Table 3: Global US Print Label Market Revenue Million Forecast, by End-user Industry 2020 & 2033
- Table 4: Global US Print Label Market Revenue Million Forecast, by Region 2020 & 2033
- Table 5: Global US Print Label Market Revenue Million Forecast, by Print Process 2020 & 2033
- Table 6: Global US Print Label Market Revenue Million Forecast, by Label Format 2020 & 2033
- Table 7: Global US Print Label Market Revenue Million Forecast, by End-user Industry 2020 & 2033
- Table 8: Global US Print Label Market Revenue Million Forecast, by Country 2020 & 2033
- Table 9: United States US Print Label Market Revenue (Million) Forecast, by Application 2020 & 2033
- Table 10: Canada US Print Label Market Revenue (Million) Forecast, by Application 2020 & 2033
- Table 11: Mexico US Print Label Market Revenue (Million) Forecast, by Application 2020 & 2033
- Table 12: Global US Print Label Market Revenue Million Forecast, by Print Process 2020 & 2033
- Table 13: Global US Print Label Market Revenue Million Forecast, by Label Format 2020 & 2033
- Table 14: Global US Print Label Market Revenue Million Forecast, by End-user Industry 2020 & 2033
- Table 15: Global US Print Label Market Revenue Million Forecast, by Country 2020 & 2033
- Table 16: Brazil US Print Label Market Revenue (Million) Forecast, by Application 2020 & 2033
- Table 17: Argentina US Print Label Market Revenue (Million) Forecast, by Application 2020 & 2033
- Table 18: Rest of South America US Print Label Market Revenue (Million) Forecast, by Application 2020 & 2033
- Table 19: Global US Print Label Market Revenue Million Forecast, by Print Process 2020 & 2033
- Table 20: Global US Print Label Market Revenue Million Forecast, by Label Format 2020 & 2033
- Table 21: Global US Print Label Market Revenue Million Forecast, by End-user Industry 2020 & 2033
- Table 22: Global US Print Label Market Revenue Million Forecast, by Country 2020 & 2033
- Table 23: United Kingdom US Print Label Market Revenue (Million) Forecast, by Application 2020 & 2033
- Table 24: Germany US Print Label Market Revenue (Million) Forecast, by Application 2020 & 2033
- Table 25: France US Print Label Market Revenue (Million) Forecast, by Application 2020 & 2033
- Table 26: Italy US Print Label Market Revenue (Million) Forecast, by Application 2020 & 2033
- Table 27: Spain US Print Label Market Revenue (Million) Forecast, by Application 2020 & 2033
- Table 28: Russia US Print Label Market Revenue (Million) Forecast, by Application 2020 & 2033
- Table 29: Benelux US Print Label Market Revenue (Million) Forecast, by Application 2020 & 2033
- Table 30: Nordics US Print Label Market Revenue (Million) Forecast, by Application 2020 & 2033
- Table 31: Rest of Europe US Print Label Market Revenue (Million) Forecast, by Application 2020 & 2033
- Table 32: Global US Print Label Market Revenue Million Forecast, by Print Process 2020 & 2033
- Table 33: Global US Print Label Market Revenue Million Forecast, by Label Format 2020 & 2033
- Table 34: Global US Print Label Market Revenue Million Forecast, by End-user Industry 2020 & 2033
- Table 35: Global US Print Label Market Revenue Million Forecast, by Country 2020 & 2033
- Table 36: Turkey US Print Label Market Revenue (Million) Forecast, by Application 2020 & 2033
- Table 37: Israel US Print Label Market Revenue (Million) Forecast, by Application 2020 & 2033
- Table 38: GCC US Print Label Market Revenue (Million) Forecast, by Application 2020 & 2033
- Table 39: North Africa US Print Label Market Revenue (Million) Forecast, by Application 2020 & 2033
- Table 40: South Africa US Print Label Market Revenue (Million) Forecast, by Application 2020 & 2033
- Table 41: Rest of Middle East & Africa US Print Label Market Revenue (Million) Forecast, by Application 2020 & 2033
- Table 42: Global US Print Label Market Revenue Million Forecast, by Print Process 2020 & 2033
- Table 43: Global US Print Label Market Revenue Million Forecast, by Label Format 2020 & 2033
- Table 44: Global US Print Label Market Revenue Million Forecast, by End-user Industry 2020 & 2033
- Table 45: Global US Print Label Market Revenue Million Forecast, by Country 2020 & 2033
- Table 46: China US Print Label Market Revenue (Million) Forecast, by Application 2020 & 2033
- Table 47: India US Print Label Market Revenue (Million) Forecast, by Application 2020 & 2033
- Table 48: Japan US Print Label Market Revenue (Million) Forecast, by Application 2020 & 2033
- Table 49: South Korea US Print Label Market Revenue (Million) Forecast, by Application 2020 & 2033
- Table 50: ASEAN US Print Label Market Revenue (Million) Forecast, by Application 2020 & 2033
- Table 51: Oceania US Print Label Market Revenue (Million) Forecast, by Application 2020 & 2033
- Table 52: Rest of Asia Pacific US Print Label Market Revenue (Million) Forecast, by Application 2020 & 2033
Frequently Asked Questions
1. What is the projected Compound Annual Growth Rate (CAGR) of the US Print Label Market?
The projected CAGR is approximately 3.19%.
2. Which companies are prominent players in the US Print Label Market?
Key companies in the market include Fort Dearborn, R R Donnelley & Sons Company, Westrock Company, Cenveo Corporation, Mondi Group, Multi Color Corporation, Avery Dennison Corporation, Taylor Corporation*List Not Exhaustive, Ahlstrom-munksjö Oyj, Brady Corporation.
3. What are the main segments of the US Print Label Market?
The market segments include Print Process, Label Format, End-user Industry.
4. Can you provide details about the market size?
The market size is estimated to be USD 7.13 Million as of 2022.
5. What are some drivers contributing to market growth?
Growing Demand for Labels Manufactured with Digital Print Technologies; High Adoption From Healthcare and Cosmetics Segment.
6. What are the notable trends driving market growth?
Pressure-sensitive Labels Accounts for the Largest Market Share.
7. Are there any restraints impacting market growth?
Lack of Products with Ability to Withstand Harsh Climatic Conditions.
8. Can you provide examples of recent developments in the market?
March 2021 - Avery Dennison Corporation acquired JDC Solutions, Inc., a privately-held manufacturer of pressure-sensitive specialty tapes in Mount Juliet, Tennessee, at USD 24 million. JDC's manufacturing operations, workforce, and product portfolio will become part of Avery Dennison's Performance Tapes North America business.
9. What pricing options are available for accessing the report?
Pricing options include single-user, multi-user, and enterprise licenses priced at USD 3800, USD 4500, and USD 5800 respectively.
10. Is the market size provided in terms of value or volume?
The market size is provided in terms of value, measured in Million.
11. Are there any specific market keywords associated with the report?
Yes, the market keyword associated with the report is "US Print Label Market," which aids in identifying and referencing the specific market segment covered.
12. How do I determine which pricing option suits my needs best?
The pricing options vary based on user requirements and access needs. Individual users may opt for single-user licenses, while businesses requiring broader access may choose multi-user or enterprise licenses for cost-effective access to the report.
13. Are there any additional resources or data provided in the US Print Label Market report?
While the report offers comprehensive insights, it's advisable to review the specific contents or supplementary materials provided to ascertain if additional resources or data are available.
14. How can I stay updated on further developments or reports in the US Print Label Market?
To stay informed about further developments, trends, and reports in the US Print Label Market, consider subscribing to industry newsletters, following relevant companies and organizations, or regularly checking reputable industry news sources and publications.
Methodology
Step 1 - Identification of Relevant Samples Size from Population Database


Step 2 - Approaches for Defining Global Market Size (Value, Volume* & Price*)

Note*: In applicable scenarios
Step 3 - Data Sources
Primary Research
- Web Analytics
- Survey Reports
- Research Institute
- Latest Research Reports
- Opinion Leaders
Secondary Research
- Annual Reports
- White Paper
- Latest Press Release
- Industry Association
- Paid Database
- Investor Presentations

Step 4 - Data Triangulation
Involves using different sources of information in order to increase the validity of a study
These sources are likely to be stakeholders in a program - participants, other researchers, program staff, other community members, and so on.
Then we put all data in single framework & apply various statistical tools to find out the dynamic on the market.
During the analysis stage, feedback from the stakeholder groups would be compared to determine areas of agreement as well as areas of divergence