

Key Insights
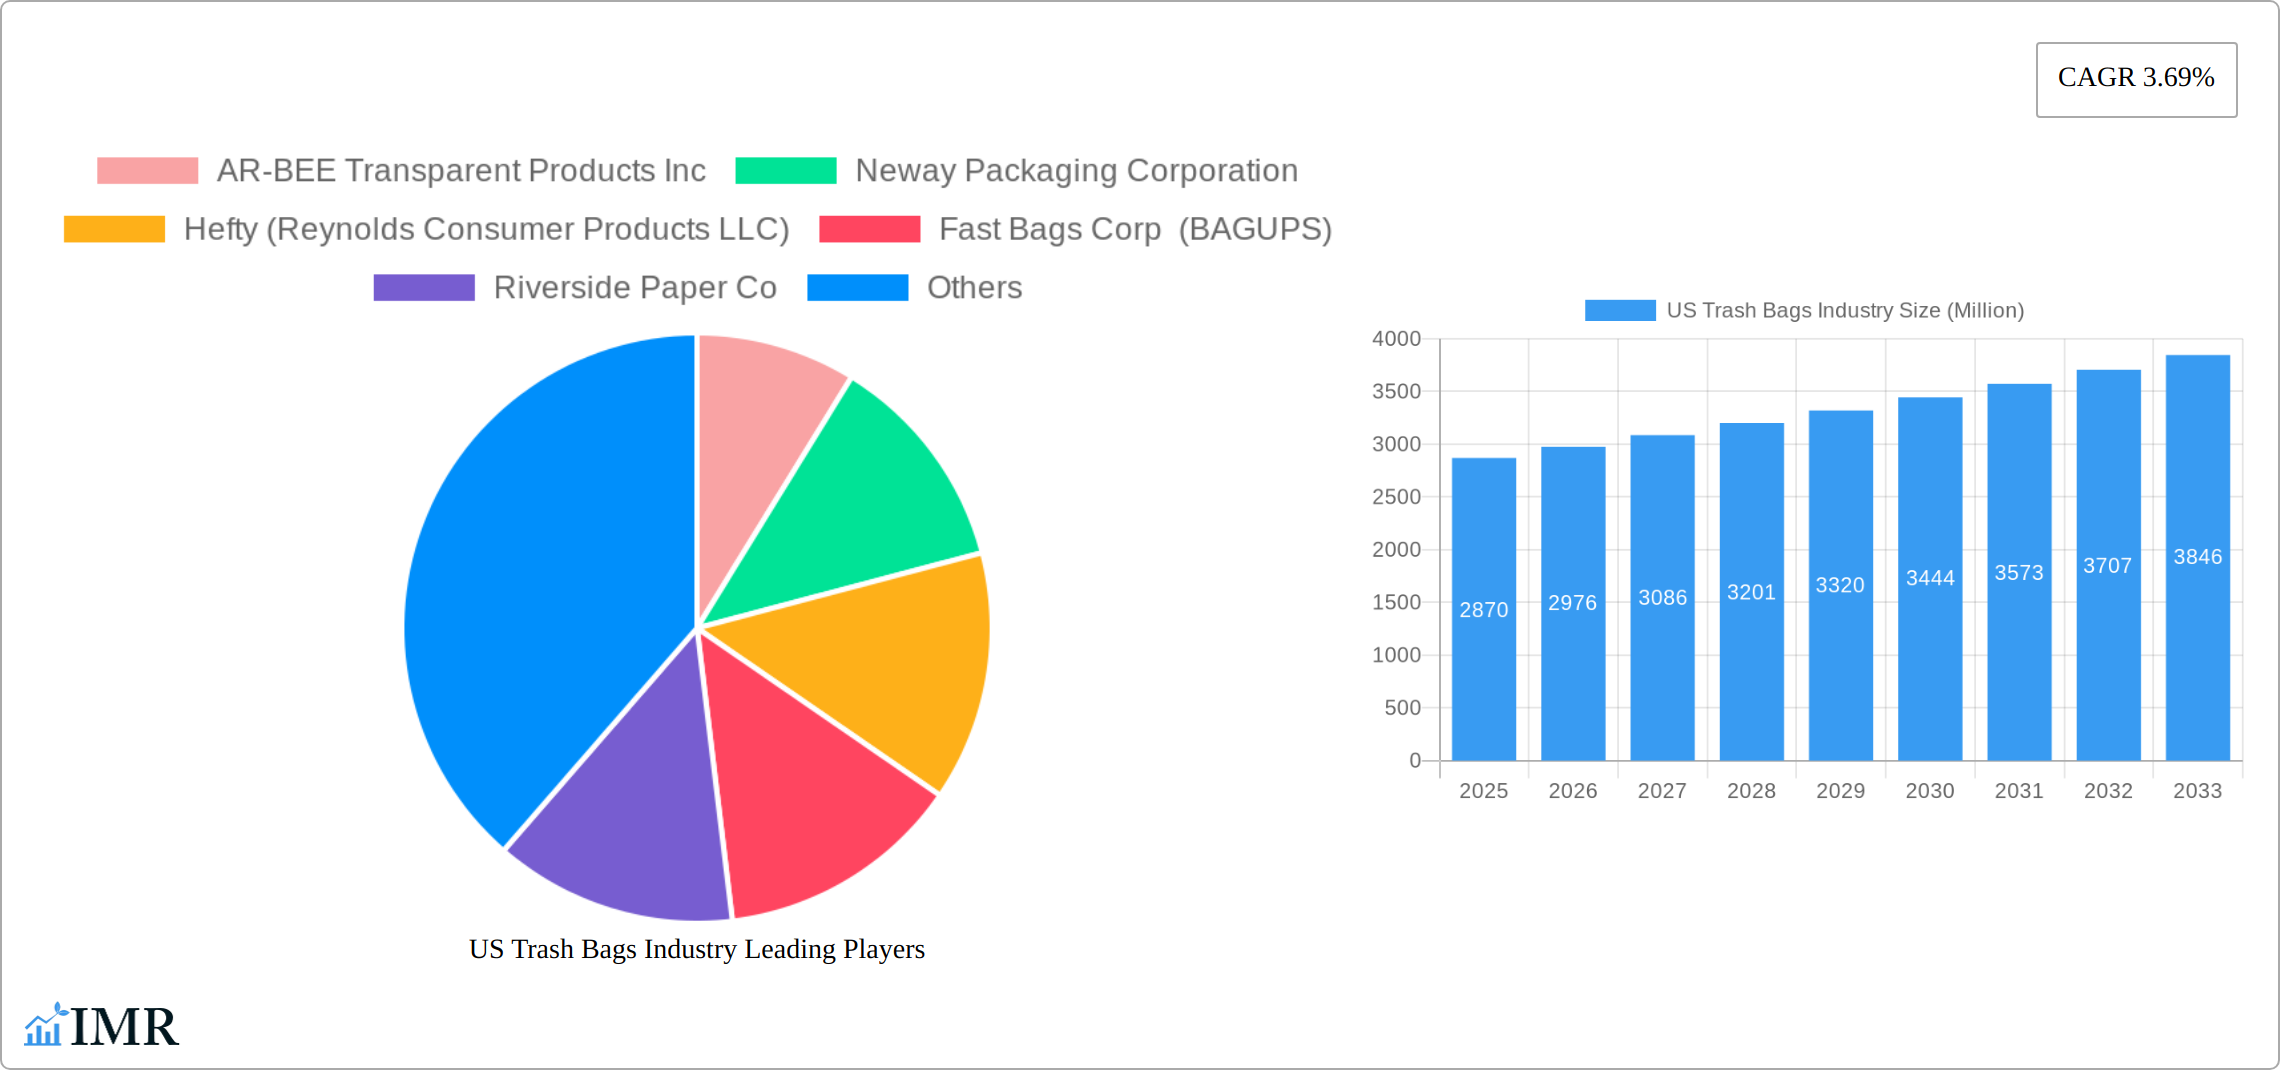
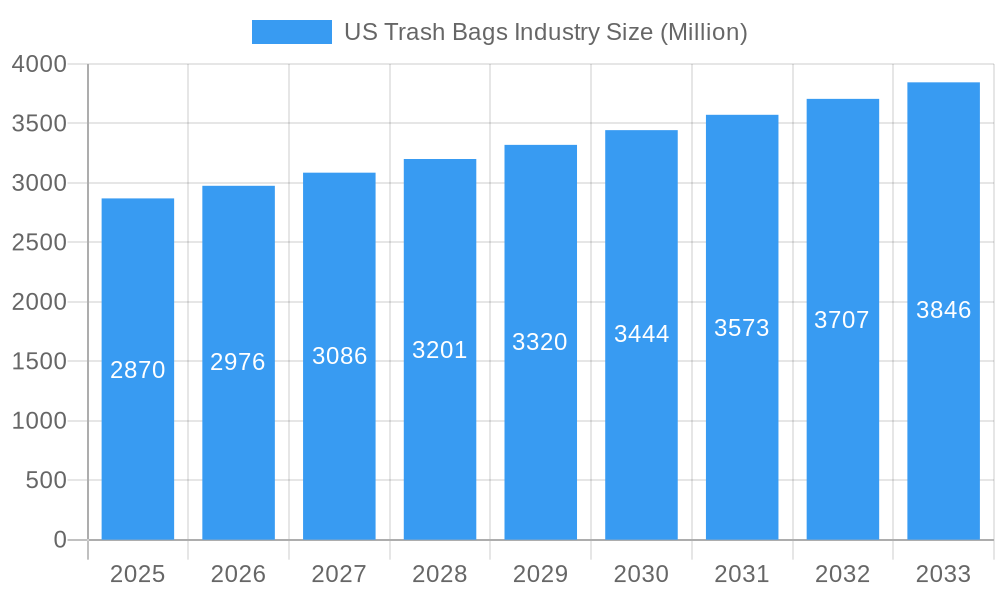
The US trash bag market, valued at $2.87 billion in 2025, is projected to experience steady growth, driven by factors such as increasing household waste generation, rising environmental awareness leading to demand for eco-friendly options, and a growing focus on hygiene in both residential and commercial settings. The market's Compound Annual Growth Rate (CAGR) of 3.69% from 2025 to 2033 indicates a consistent expansion, with significant contributions from all end-user segments—residential, commercial, and industrial. The residential sector is expected to remain the largest contributor, fueled by increasing urbanization and changing consumer lifestyles. The commercial segment is also poised for significant growth driven by the increasing number of businesses and stricter waste management regulations. The industrial sector, while smaller in comparison, will benefit from growth in manufacturing and industrial activities. Key players like Hefty, Berry Global, and Novolex are leveraging their established brands and distribution networks to maintain market share, while smaller companies are focusing on innovation and niche markets to compete effectively. Regional variations exist, with the Northeast and West potentially showing higher growth rates due to higher population density and stricter environmental regulations. However, all regions are expected to contribute to the overall market expansion.
US Trash Bags Industry Market Size (In Billion)
Continued market expansion hinges on several factors. The increasing adoption of biodegradable and compostable trash bags aligns with growing sustainability concerns, providing an avenue for market diversification. Furthermore, advancements in bag manufacturing technologies and the introduction of new materials with enhanced strength and durability are also likely to influence market trends. Conversely, fluctuations in raw material prices, particularly for plastics, and potential changes in waste management policies could pose challenges to market growth. The market will likely see increased competition among existing players and the emergence of new entrants, leading to further innovation and price adjustments in the coming years. Understanding these dynamics is crucial for effective strategy formulation within the US trash bag industry.
US Trash Bags Industry Company Market Share
US Trash Bags Industry Market Report: 2019-2033
This comprehensive report provides an in-depth analysis of the US trash bags industry, encompassing market dynamics, growth trends, key players, and future outlook. The report covers the period from 2019 to 2033, with a focus on the base year 2025. Market values are presented in million units.
US Trash Bags Industry Market Dynamics & Structure
The US trash bags market is characterized by a moderately consolidated landscape, featuring a blend of large, established manufacturers and a substantial number of nimble regional producers. This concentration is largely attributable to the significant economies of scale inherent in both large-scale manufacturing processes and extensive distribution networks. A pivotal force shaping market dynamics is technological innovation, particularly the advancement and adoption of biodegradable and compostable materials. This innovation not only influences evolving consumer preferences but also exerts considerable pressure on regulatory frameworks. Indeed, increasingly stringent environmental regulations, specifically designed to curb plastic waste and promote sustainability, are compelling manufacturers to pivot towards eco-friendly alternatives. The industry also navigates competition from reusable bags and a growing array of alternative waste management solutions. Merger and acquisition (M&A) activity, while moderate, is strategically focused on expanding product portfolios and extending geographical reach. The residential segment continues to represent the largest end-user market, while the commercial and industrial segments offer compelling avenues for future growth.
Market Dynamics:
- Market Concentration: Moderately consolidated, with the top 10 players collectively holding approximately 65% of the market share (2024 estimate).
- Technological Innovation: Ongoing advancements are centered on developing enhanced biodegradable and compostable materials, improving bag strength and durability, and introducing innovative dispensing systems for enhanced user convenience.
- Regulatory Framework: The industry is experiencing a tightening regulatory environment, with a strong emphasis on plastic waste reduction mandates and the promotion of circular economy principles.
- Competitive Substitutes: The market faces competition from the rising popularity of reusable shopping bags, as well as alternative waste management and disposal methods.
- End-User Demographics: Demand is steadily increasing across all key sectors, including a robust residential market, a growing commercial sector, and a specialized industrial segment.
- M&A Trends: Moderate M&A activity is observed, with a strategic focus on product line expansion, market diversification, and acquiring innovative technologies. An estimated 15-20 significant deals occurred between 2019-2024.
US Trash Bags Industry Growth Trends & Insights
The US trash bags market demonstrated consistent and healthy growth throughout the historical period of 2019-2024, primarily propelled by sustained demand from the residential sector. The estimated market size for US trash bags stands at approximately 1.8 billion units in 2025. The adoption of eco-friendly alternatives is on an upward trajectory, though current penetration rates still present significant room for expansion. Technological advancements, such as the introduction of innovative multi-functional bags and smart waste management solutions (as exemplified by innovations like Bagups in recent notable milestones), are poised to act as potent growth accelerators by enhancing convenience and promoting sustainability. Consumer behavior is undeniably shifting towards more environmentally conscious choices, directly fueling demand for biodegradable and compostable trash bags. The market is projected to expand at a compound annual growth rate (CAGR) of approximately 5.5% during the forecast period spanning 2025-2033, with an anticipated market size of around 2.7 billion units by 2033. The penetration of biodegradable bags is expected to reach a significant 40% of the total market by 2033, indicating a substantial shift towards sustainable options.
Dominant Regions, Countries, or Segments in US Trash Bags Industry
The residential segment unequivocally dominates the US trash bags market, accounting for an estimated 60% of the total market value in 2025. This sustained dominance is attributed to the consistently high household penetration rates across the nation and the inherent need for frequent replacement of trash bags. Growth within this segment is further bolstered by increasing urbanization trends and a steady rise in household formation. Concurrently, the commercial and industrial sectors present substantial and expanding growth opportunities, driven by escalating commercial activity and a heightened emphasis on robust waste management protocols within industrial settings.
Key Drivers by Segment:
- Residential: High household penetration, frequent replacement cycles, and the impact of ongoing urbanization and increasing household formation.
- Commercial: Expanding commercial activities, stricter waste management regulations for businesses, and a growing demand for hygienic disposal solutions.
- Industrial: Increased focus on operational efficiency and waste stream management, coupled with the demand for specialized, heavy-duty bags for industrial applications.
US Trash Bags Industry Product Landscape
The US trash bags market offers a wide range of products, differing in size, material (plastic, biodegradable, compostable), thickness, and features (e.g., drawstring closures, easy-open design). Recent innovations include improved material formulations for enhanced strength and durability, as well as the introduction of smart dispensing systems, such as the Bagups system, which enhances convenience and reduces waste. Unique selling propositions often focus on sustainability, performance, and ease of use.
Key Drivers, Barriers & Challenges in US Trash Bags Industry
Key Drivers:
- Consistent growth in residential and commercial waste generation, necessitating higher consumption of trash bags.
- Accelerating adoption rates of eco-friendly and sustainable alternatives by both consumers and businesses.
- Continuous technological advancements in the development of biodegradable, compostable, and enhanced performance materials.
- Increasingly stringent environmental regulations and government mandates promoting responsible waste management and plastic reduction.
Challenges & Restraints:
- Volatility in the prices of key raw materials, impacting manufacturing costs and profit margins.
- Intensified competition from reusable bag alternatives and the growing adoption of alternative waste management and disposal solutions.
- Potential disruptions within global supply chains, affecting raw material availability and product distribution.
- Navigating evolving environmental regulations and the associated compliance costs for manufacturers.
Emerging Opportunities in US Trash Bags Industry
- Growing demand for biodegradable and compostable bags.
- Expansion into niche markets, such as specialized industrial applications.
- Development of innovative dispensing systems for enhanced convenience.
- Opportunities in e-commerce and direct-to-consumer sales channels.
Growth Accelerators in the US Trash Bags Industry Industry
The US trash bag market is poised for sustained growth driven by ongoing technological innovation in materials and packaging design, increasing consumer awareness of environmental issues, and the adoption of efficient waste management practices. Strategic partnerships and expansions into underserved markets are also likely to play a key role.
Key Players Shaping the US Trash Bags Industry Market
- AR-BEE Transparent Products Inc
- Neway Packaging Corporation
- Hefty (Reynolds Consumer Products LLC)
- Fast Bags Corp (BAGUPS)
- Riverside Paper Co
- International Plastics Inc
- Novolex
- Berry Global Inc
- Inteplast Group
- Universal Plastic Bag Co
Notable Milestones in US Trash Bags Industry Sector
- January 2024: Recircle Brands launched Bagups, a biodegradable trash bag dispensing system, signifying a shift toward sustainable waste management solutions.
In-Depth US Trash Bags Industry Market Outlook
The future of the US trash bags market looks bright, with continued growth driven by increasing environmental awareness, technological advancements, and evolving consumer preferences. Strategic opportunities exist in the development and marketing of sustainable and convenient solutions, particularly in the commercial and industrial sectors. The market is expected to witness significant expansion as more players enter the arena with innovative products and solutions.
US Trash Bags Industry Segmentation
-
1. End User
- 1.1. Residential
- 1.2. Commercial
- 1.3. Industrial
US Trash Bags Industry Segmentation By Geography
-
1. North America
- 1.1. United States
- 1.2. Canada
- 1.3. Mexico
-
2. South America
- 2.1. Brazil
- 2.2. Argentina
- 2.3. Rest of South America
-
3. Europe
- 3.1. United Kingdom
- 3.2. Germany
- 3.3. France
- 3.4. Italy
- 3.5. Spain
- 3.6. Russia
- 3.7. Benelux
- 3.8. Nordics
- 3.9. Rest of Europe
-
4. Middle East & Africa
- 4.1. Turkey
- 4.2. Israel
- 4.3. GCC
- 4.4. North Africa
- 4.5. South Africa
- 4.6. Rest of Middle East & Africa
-
5. Asia Pacific
- 5.1. China
- 5.2. India
- 5.3. Japan
- 5.4. South Korea
- 5.5. ASEAN
- 5.6. Oceania
- 5.7. Rest of Asia Pacific
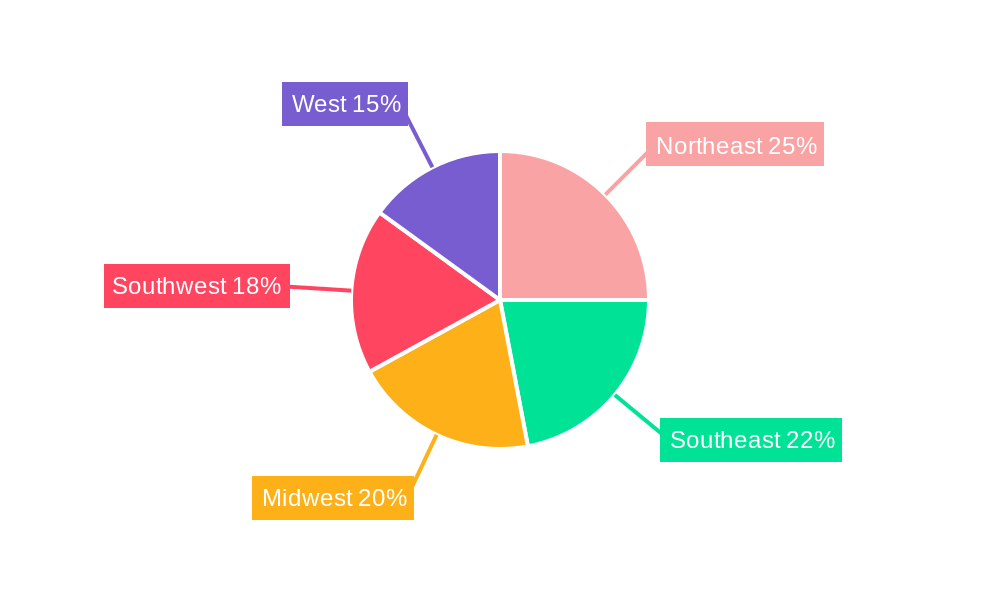
US Trash Bags Industry Regional Market Share
Geographic Coverage of US Trash Bags Industry
US Trash Bags Industry REPORT HIGHLIGHTS
| Aspects | Details |
|---|---|
| Study Period | 2020-2034 |
| Base Year | 2025 |
| Estimated Year | 2026 |
| Forecast Period | 2026-2034 |
| Historical Period | 2020-2025 |
| Growth Rate | CAGR of 3.69% from 2020-2034 |
| Segmentation |
|
Table of Contents
- 1. Introduction
- 1.1. Research Scope
- 1.2. Market Segmentation
- 1.3. Research Objective
- 1.4. Definitions and Assumptions
- 2. Executive Summary
- 2.1. Market Snapshot
- 3. Market Dynamics
- 3.1. Market Drivers
- 3.2. Market Restrains
- 3.3. Market Trends
- 3.4. Market Opportunities
- 4. Market Factor Analysis
- 4.1. Porters Five Forces
- 4.1.1. Bargaining Power of Suppliers
- 4.1.2. Bargaining Power of Buyers
- 4.1.3. Threat of New Entrants
- 4.1.4. Threat of Substitutes
- 4.1.5. Competitive Rivalry
- 4.2. PESTEL analysis
- 4.3. BCG Analysis
- 4.3.1. Stars (High Growth, High Market Share)
- 4.3.2. Cash Cows (Low Growth, High Market Share)
- 4.3.3. Question Mark (High Growth, Low Market Share)
- 4.3.4. Dogs (Low Growth, Low Market Share)
- 4.4. Ansoff Matrix Analysis
- 4.5. Supply Chain Analysis
- 4.6. Regulatory Landscape
- 4.7. Current Market Potential and Opportunity Assessment (TAM–SAM–SOM Framework)
- 4.8. IMR Analyst Note
- 4.1. Porters Five Forces
- 5. Market Analysis, Insights and Forecast 2021-2033
- 5.1. Market Analysis, Insights and Forecast - by End User
- 5.1.1. Residential
- 5.1.2. Commercial
- 5.1.3. Industrial
- 5.2. Market Analysis, Insights and Forecast - by Region
- 5.2.1. North America
- 5.2.2. South America
- 5.2.3. Europe
- 5.2.4. Middle East & Africa
- 5.2.5. Asia Pacific
- 5.1. Market Analysis, Insights and Forecast - by End User
- 6. Global US Trash Bags Industry Analysis, Insights and Forecast, 2021-2033
- 6.1. Market Analysis, Insights and Forecast - by End User
- 6.1.1. Residential
- 6.1.2. Commercial
- 6.1.3. Industrial
- 6.1. Market Analysis, Insights and Forecast - by End User
- 7. North America US Trash Bags Industry Analysis, Insights and Forecast, 2020-2032
- 7.1. Market Analysis, Insights and Forecast - by End User
- 7.1.1. Residential
- 7.1.2. Commercial
- 7.1.3. Industrial
- 7.1. Market Analysis, Insights and Forecast - by End User
- 8. South America US Trash Bags Industry Analysis, Insights and Forecast, 2020-2032
- 8.1. Market Analysis, Insights and Forecast - by End User
- 8.1.1. Residential
- 8.1.2. Commercial
- 8.1.3. Industrial
- 8.1. Market Analysis, Insights and Forecast - by End User
- 9. Europe US Trash Bags Industry Analysis, Insights and Forecast, 2020-2032
- 9.1. Market Analysis, Insights and Forecast - by End User
- 9.1.1. Residential
- 9.1.2. Commercial
- 9.1.3. Industrial
- 9.1. Market Analysis, Insights and Forecast - by End User
- 10. Middle East & Africa US Trash Bags Industry Analysis, Insights and Forecast, 2020-2032
- 10.1. Market Analysis, Insights and Forecast - by End User
- 10.1.1. Residential
- 10.1.2. Commercial
- 10.1.3. Industrial
- 10.1. Market Analysis, Insights and Forecast - by End User
- 11. Asia Pacific US Trash Bags Industry Analysis, Insights and Forecast, 2020-2032
- 11.1. Market Analysis, Insights and Forecast - by End User
- 11.1.1. Residential
- 11.1.2. Commercial
- 11.1.3. Industrial
- 11.1. Market Analysis, Insights and Forecast - by End User
- 12. Competitive Analysis
- 12.1. Company Profiles
- 12.1.1 AR-BEE Transparent Products Inc
- 12.1.1.1. Company Overview
- 12.1.1.2. Products
- 12.1.1.3. Company Financials
- 12.1.1.4. SWOT Analysis
- 12.1.2 Neway Packaging Corporation
- 12.1.2.1. Company Overview
- 12.1.2.2. Products
- 12.1.2.3. Company Financials
- 12.1.2.4. SWOT Analysis
- 12.1.3 Hefty (Reynolds Consumer Products LLC)
- 12.1.3.1. Company Overview
- 12.1.3.2. Products
- 12.1.3.3. Company Financials
- 12.1.3.4. SWOT Analysis
- 12.1.4 Fast Bags Corp (BAGUPS)
- 12.1.4.1. Company Overview
- 12.1.4.2. Products
- 12.1.4.3. Company Financials
- 12.1.4.4. SWOT Analysis
- 12.1.5 Riverside Paper Co
- 12.1.5.1. Company Overview
- 12.1.5.2. Products
- 12.1.5.3. Company Financials
- 12.1.5.4. SWOT Analysis
- 12.1.6 International Plastics Inc
- 12.1.6.1. Company Overview
- 12.1.6.2. Products
- 12.1.6.3. Company Financials
- 12.1.6.4. SWOT Analysis
- 12.1.7 Novolex
- 12.1.7.1. Company Overview
- 12.1.7.2. Products
- 12.1.7.3. Company Financials
- 12.1.7.4. SWOT Analysis
- 12.1.8 Berry Global Inc
- 12.1.8.1. Company Overview
- 12.1.8.2. Products
- 12.1.8.3. Company Financials
- 12.1.8.4. SWOT Analysis
- 12.1.9 Inteplast Group
- 12.1.9.1. Company Overview
- 12.1.9.2. Products
- 12.1.9.3. Company Financials
- 12.1.9.4. SWOT Analysis
- 12.1.10 Universal Plastic Bag Co
- 12.1.10.1. Company Overview
- 12.1.10.2. Products
- 12.1.10.3. Company Financials
- 12.1.10.4. SWOT Analysis
- 12.1.1 AR-BEE Transparent Products Inc
- 12.2. Market Entropy
- 12.2.1 Company's Key Areas Served
- 12.2.2 Recent Developments
- 12.3. Company Market Share Analysis 2025
- 12.3.1 Top 5 Companies Market Share Analysis
- 12.3.2 Top 3 Companies Market Share Analysis
- 12.4. List of Potential Customers
- 13. Research Methodology
List of Figures
- Figure 1: Global US Trash Bags Industry Revenue Breakdown (Million, %) by Region 2025 & 2033
- Figure 2: North America US Trash Bags Industry Revenue (Million), by End User 2025 & 2033
- Figure 3: North America US Trash Bags Industry Revenue Share (%), by End User 2025 & 2033
- Figure 4: North America US Trash Bags Industry Revenue (Million), by Country 2025 & 2033
- Figure 5: North America US Trash Bags Industry Revenue Share (%), by Country 2025 & 2033
- Figure 6: South America US Trash Bags Industry Revenue (Million), by End User 2025 & 2033
- Figure 7: South America US Trash Bags Industry Revenue Share (%), by End User 2025 & 2033
- Figure 8: South America US Trash Bags Industry Revenue (Million), by Country 2025 & 2033
- Figure 9: South America US Trash Bags Industry Revenue Share (%), by Country 2025 & 2033
- Figure 10: Europe US Trash Bags Industry Revenue (Million), by End User 2025 & 2033
- Figure 11: Europe US Trash Bags Industry Revenue Share (%), by End User 2025 & 2033
- Figure 12: Europe US Trash Bags Industry Revenue (Million), by Country 2025 & 2033
- Figure 13: Europe US Trash Bags Industry Revenue Share (%), by Country 2025 & 2033
- Figure 14: Middle East & Africa US Trash Bags Industry Revenue (Million), by End User 2025 & 2033
- Figure 15: Middle East & Africa US Trash Bags Industry Revenue Share (%), by End User 2025 & 2033
- Figure 16: Middle East & Africa US Trash Bags Industry Revenue (Million), by Country 2025 & 2033
- Figure 17: Middle East & Africa US Trash Bags Industry Revenue Share (%), by Country 2025 & 2033
- Figure 18: Asia Pacific US Trash Bags Industry Revenue (Million), by End User 2025 & 2033
- Figure 19: Asia Pacific US Trash Bags Industry Revenue Share (%), by End User 2025 & 2033
- Figure 20: Asia Pacific US Trash Bags Industry Revenue (Million), by Country 2025 & 2033
- Figure 21: Asia Pacific US Trash Bags Industry Revenue Share (%), by Country 2025 & 2033
List of Tables
- Table 1: Global US Trash Bags Industry Revenue Million Forecast, by End User 2020 & 2033
- Table 2: Global US Trash Bags Industry Revenue Million Forecast, by Region 2020 & 2033
- Table 3: Global US Trash Bags Industry Revenue Million Forecast, by End User 2020 & 2033
- Table 4: Global US Trash Bags Industry Revenue Million Forecast, by Country 2020 & 2033
- Table 5: United States US Trash Bags Industry Revenue (Million) Forecast, by Application 2020 & 2033
- Table 6: Canada US Trash Bags Industry Revenue (Million) Forecast, by Application 2020 & 2033
- Table 7: Mexico US Trash Bags Industry Revenue (Million) Forecast, by Application 2020 & 2033
- Table 8: Global US Trash Bags Industry Revenue Million Forecast, by End User 2020 & 2033
- Table 9: Global US Trash Bags Industry Revenue Million Forecast, by Country 2020 & 2033
- Table 10: Brazil US Trash Bags Industry Revenue (Million) Forecast, by Application 2020 & 2033
- Table 11: Argentina US Trash Bags Industry Revenue (Million) Forecast, by Application 2020 & 2033
- Table 12: Rest of South America US Trash Bags Industry Revenue (Million) Forecast, by Application 2020 & 2033
- Table 13: Global US Trash Bags Industry Revenue Million Forecast, by End User 2020 & 2033
- Table 14: Global US Trash Bags Industry Revenue Million Forecast, by Country 2020 & 2033
- Table 15: United Kingdom US Trash Bags Industry Revenue (Million) Forecast, by Application 2020 & 2033
- Table 16: Germany US Trash Bags Industry Revenue (Million) Forecast, by Application 2020 & 2033
- Table 17: France US Trash Bags Industry Revenue (Million) Forecast, by Application 2020 & 2033
- Table 18: Italy US Trash Bags Industry Revenue (Million) Forecast, by Application 2020 & 2033
- Table 19: Spain US Trash Bags Industry Revenue (Million) Forecast, by Application 2020 & 2033
- Table 20: Russia US Trash Bags Industry Revenue (Million) Forecast, by Application 2020 & 2033
- Table 21: Benelux US Trash Bags Industry Revenue (Million) Forecast, by Application 2020 & 2033
- Table 22: Nordics US Trash Bags Industry Revenue (Million) Forecast, by Application 2020 & 2033
- Table 23: Rest of Europe US Trash Bags Industry Revenue (Million) Forecast, by Application 2020 & 2033
- Table 24: Global US Trash Bags Industry Revenue Million Forecast, by End User 2020 & 2033
- Table 25: Global US Trash Bags Industry Revenue Million Forecast, by Country 2020 & 2033
- Table 26: Turkey US Trash Bags Industry Revenue (Million) Forecast, by Application 2020 & 2033
- Table 27: Israel US Trash Bags Industry Revenue (Million) Forecast, by Application 2020 & 2033
- Table 28: GCC US Trash Bags Industry Revenue (Million) Forecast, by Application 2020 & 2033
- Table 29: North Africa US Trash Bags Industry Revenue (Million) Forecast, by Application 2020 & 2033
- Table 30: South Africa US Trash Bags Industry Revenue (Million) Forecast, by Application 2020 & 2033
- Table 31: Rest of Middle East & Africa US Trash Bags Industry Revenue (Million) Forecast, by Application 2020 & 2033
- Table 32: Global US Trash Bags Industry Revenue Million Forecast, by End User 2020 & 2033
- Table 33: Global US Trash Bags Industry Revenue Million Forecast, by Country 2020 & 2033
- Table 34: China US Trash Bags Industry Revenue (Million) Forecast, by Application 2020 & 2033
- Table 35: India US Trash Bags Industry Revenue (Million) Forecast, by Application 2020 & 2033
- Table 36: Japan US Trash Bags Industry Revenue (Million) Forecast, by Application 2020 & 2033
- Table 37: South Korea US Trash Bags Industry Revenue (Million) Forecast, by Application 2020 & 2033
- Table 38: ASEAN US Trash Bags Industry Revenue (Million) Forecast, by Application 2020 & 2033
- Table 39: Oceania US Trash Bags Industry Revenue (Million) Forecast, by Application 2020 & 2033
- Table 40: Rest of Asia Pacific US Trash Bags Industry Revenue (Million) Forecast, by Application 2020 & 2033
Frequently Asked Questions
1. What is the projected Compound Annual Growth Rate (CAGR) of the US Trash Bags Industry?
The projected CAGR is approximately 3.69%.
2. Which companies are prominent players in the US Trash Bags Industry?
Key companies in the market include AR-BEE Transparent Products Inc, Neway Packaging Corporation, Hefty (Reynolds Consumer Products LLC), Fast Bags Corp (BAGUPS), Riverside Paper Co, International Plastics Inc, Novolex, Berry Global Inc, Inteplast Group, Universal Plastic Bag Co.
3. What are the main segments of the US Trash Bags Industry?
The market segments include End User.
4. Can you provide details about the market size?
The market size is estimated to be USD 2.87 Million as of 2022.
5. What are some drivers contributing to market growth?
Growing Demand for Compostable and Oxo-biodegradable Bags; Growing Awareness About Hygiene Among People.
6. What are the notable trends driving market growth?
The Residential Sector Holds the Largest Market Share.
7. Are there any restraints impacting market growth?
Unforeseen Consequences of Reusing Plastic Packaging and Health Related Concerns.
8. Can you provide examples of recent developments in the market?
January 2024: Recircle Brands, a visionary company in the eco-friendly products sector, announced the launch of Bagups, a groundbreaking trash bag dispensing system. Its unique design ensures that a new bag is always ready for use, eliminating the inconvenience of traditional trash bag replacement. The product's environmental impact is significantly reduced by using biodegradable materials, minimizing plastic waste, and reducing the overall carbon footprint.
9. What pricing options are available for accessing the report?
Pricing options include single-user, multi-user, and enterprise licenses priced at USD 3800, USD 4500, and USD 5800 respectively.
10. Is the market size provided in terms of value or volume?
The market size is provided in terms of value, measured in Million.
11. Are there any specific market keywords associated with the report?
Yes, the market keyword associated with the report is "US Trash Bags Industry," which aids in identifying and referencing the specific market segment covered.
12. How do I determine which pricing option suits my needs best?
The pricing options vary based on user requirements and access needs. Individual users may opt for single-user licenses, while businesses requiring broader access may choose multi-user or enterprise licenses for cost-effective access to the report.
13. Are there any additional resources or data provided in the US Trash Bags Industry report?
While the report offers comprehensive insights, it's advisable to review the specific contents or supplementary materials provided to ascertain if additional resources or data are available.
14. How can I stay updated on further developments or reports in the US Trash Bags Industry?
To stay informed about further developments, trends, and reports in the US Trash Bags Industry, consider subscribing to industry newsletters, following relevant companies and organizations, or regularly checking reputable industry news sources and publications.
Methodology
Step 1 - Identification of Relevant Samples Size from Population Database


Step 2 - Approaches for Defining Global Market Size (Value, Volume* & Price*)

Note*: In applicable scenarios
Step 3 - Data Sources
Primary Research
- Web Analytics
- Survey Reports
- Research Institute
- Latest Research Reports
- Opinion Leaders
Secondary Research
- Annual Reports
- White Paper
- Latest Press Release
- Industry Association
- Paid Database
- Investor Presentations

Step 4 - Data Triangulation
Involves using different sources of information in order to increase the validity of a study
These sources are likely to be stakeholders in a program - participants, other researchers, program staff, other community members, and so on.
Then we put all data in single framework & apply various statistical tools to find out the dynamic on the market.
During the analysis stage, feedback from the stakeholder groups would be compared to determine areas of agreement as well as areas of divergence