

Key Insights
The US valve market is projected to reach $19 billion by 2025, exhibiting a Compound Annual Growth Rate (CAGR) of 4.3% through 2033. Key growth drivers include significant infrastructure investments, increased oil and gas exploration, and the adoption of smart valves for industrial automation. Stringent safety and environmental regulations across water/wastewater, chemical processing, and power generation sectors, alongside the integration of IoT and AI for enhanced monitoring and predictive maintenance, are also fueling market expansion.
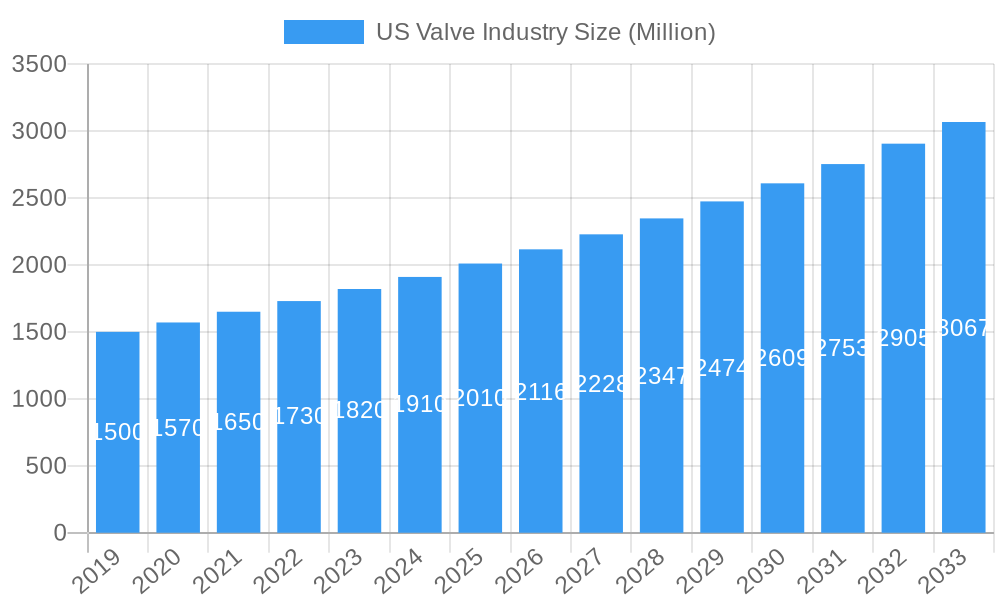
US Valve Industry Market Size (In Billion)
Market restraints include volatility in raw material prices and intense competition, particularly for standard valve types. However, continuous technological advancements, such as high-performance valves for extreme conditions and the use of advanced materials, alongside government initiatives for infrastructure modernization and growth in the renewable energy sector, are expected to sustain demand. Leading companies like Rotork Plc, Flowserve Corporation, and Emerson Electric Co. are investing in R&D to leverage these evolving market dynamics.
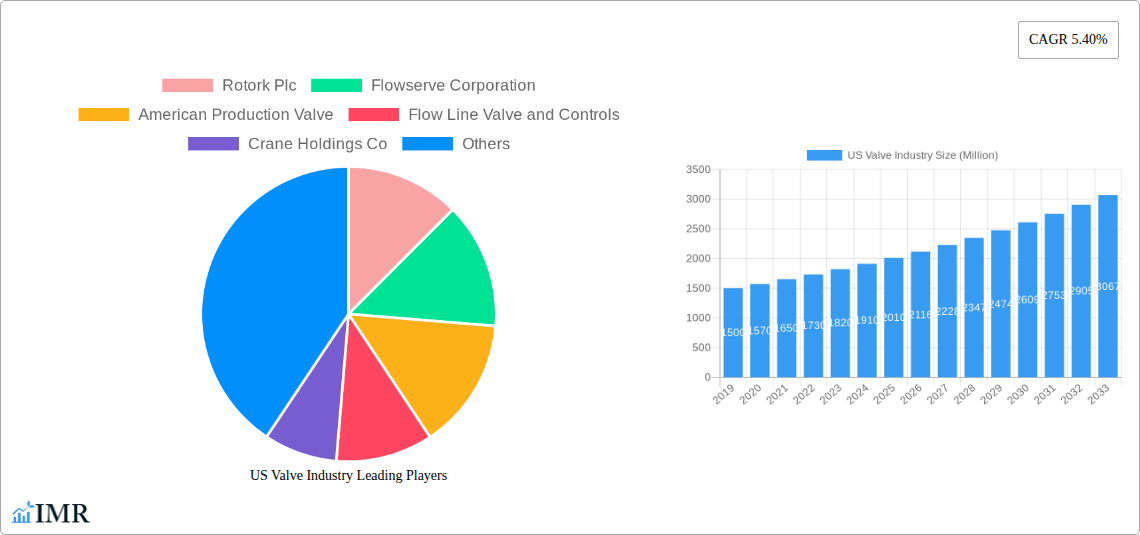
US Valve Industry Company Market Share
This comprehensive report analyzes the US Valve Industry from 2019 to 2033, with a base year of 2025. It offers critical insights into market dynamics, growth forecasts, and competitive landscapes, detailing parent and child market trends and segment performance, with all values presented in billions of dollars.
US Valve Industry Market Dynamics & Structure
The US Valve Industry is characterized by a moderate market concentration, with key players like Rotork Plc, Flowserve Corporation, and Emerson Electric Co. holding significant market share, estimated at approximately 40% collectively in 2025. Technological innovation is a primary driver, fueled by advancements in smart valves, IoT integration for predictive maintenance, and the development of highly specialized valves for extreme environments. Regulatory frameworks, particularly those concerning environmental emissions and safety standards, significantly influence product development and adoption. Competitive product substitutes, such as advanced sealing technologies and alternative fluid control mechanisms, pose a constant challenge, necessitating continuous innovation from valve manufacturers. End-user demographics are shifting, with a growing demand for automated and data-driven solutions across industrial sectors. Mergers and acquisitions (M&A) trends are active, with an estimated 15-20 significant M&A deals in the historical period (2019-2024), indicating a consolidation drive to expand product portfolios and market reach. Barriers to innovation include the high cost of R&D for advanced materials and integration, and lengthy product validation cycles.
US Valve Industry Growth Trends & Insights
The US Valve Industry is poised for robust expansion, driven by several key trends. The overall market size is projected to grow from an estimated $15,500 Million in 2025 to $21,000 Million by 2033, exhibiting a Compound Annual Growth Rate (CAGR) of approximately 4.5%. Adoption rates of advanced valve technologies, such as smart and IoT-enabled valves, are rapidly increasing, particularly in sectors like oil & gas, water & wastewater, and chemical processing. Technological disruptions, including the integration of artificial intelligence for process optimization and the development of novel materials for enhanced durability, are reshaping the product landscape. Consumer behavior shifts are evident, with a growing emphasis on lifecycle cost, energy efficiency, and operational reliability. The demand for customized solutions tailored to specific industrial applications is also on the rise. Market penetration for high-performance and specialized valves is deepening, reflecting the increasing complexity of industrial processes and stringent performance requirements.
Dominant Regions, Countries, or Segments in US Valve Industry
The Consumption Analysis segment is projected to be a dominant driver of market growth within the US Valve Industry. In 2025, the estimated consumption is valued at $13,000 Million. This dominance is underpinned by a confluence of factors, including robust industrial activity, significant infrastructure development, and increasing investments in modernization across key sectors. The demand for valves is intrinsically linked to the operational needs of industries such as oil and gas, chemical processing, power generation, and water treatment, all of which have a substantial presence and ongoing expansion in the United States.
- Key Drivers of Consumption Dominance:
- Aging Infrastructure: The need to upgrade and replace aging pipelines and industrial equipment in sectors like water and wastewater management creates a consistent demand for replacement valves.
- Energy Sector Investments: Continued exploration and production in the oil and gas sector, along with investments in renewable energy infrastructure, require a vast array of control and process valves.
- Manufacturing Reshoring: Initiatives to reshore manufacturing activities are boosting demand for new industrial facilities, thereby increasing the need for new valve installations.
- Environmental Regulations: Stricter environmental regulations necessitate the use of advanced valves with enhanced sealing capabilities and emission control features, particularly in chemical and power plants.
The Import Market Analysis (Value & Volume) is also a significant contributor, with estimated import value in 2025 at $3,500 Million and import volume at 800 Million units. This highlights the reliance on specialized valve components and finished products from international markets. Conversely, the Export Market Analysis (Value & Volume) shows an estimated export value of $2,000 Million and export volume of 450 Million units in 2025, demonstrating the US industry's global competitiveness in certain valve categories. The Production Analysis is expected to reach $17,500 Million in 2025, indicating a strong domestic manufacturing base. The Price Trend Analysis will see an estimated average price increase of 2.5% annually from 2025 onwards, influenced by raw material costs and technological advancements.
US Valve Industry Product Landscape
The US Valve Industry is witnessing an array of innovative product developments focused on enhanced performance, efficiency, and connectivity. Key innovations include the proliferation of smart valves equipped with IoT capabilities for remote monitoring, predictive maintenance, and real-time data analytics. The development of advanced materials, such as corrosion-resistant alloys and high-temperature polymers, is enabling valves to operate in increasingly challenging environments. Unique selling propositions for leading manufacturers often revolve around energy efficiency, with valves designed for minimal leakage and reduced pressure drop, contributing to significant operational cost savings for end-users. Technological advancements are also seen in the integration of digital actuation systems and sophisticated control algorithms, allowing for more precise and responsive fluid management across diverse applications.
Key Drivers, Barriers & Challenges in US Valve Industry
The US Valve Industry is propelled by significant growth drivers, including increasing industrial automation, a growing need for energy efficiency, and substantial infrastructure development projects. Technological advancements in smart valves and IoT integration are also creating new market opportunities. The resurgence of manufacturing and increased investments in sectors like renewable energy further bolster demand.
However, the industry faces several challenges. Supply chain disruptions, as experienced in recent years, continue to impact raw material availability and lead times, affecting production schedules. Stringent regulatory compliance, particularly for environmental and safety standards, adds to manufacturing costs and complexity. Intense competition from both domestic and international players, coupled with the pressure to maintain competitive pricing, also presents a significant hurdle.
Emerging Opportunities in US Valve Industry
Emerging opportunities in the US Valve Industry lie in the growing demand for smart and connected valves within the burgeoning Industrial Internet of Things (IIoT) ecosystem. The expansion of renewable energy infrastructure, particularly solar and wind power, presents a significant untapped market for specialized valves. Furthermore, the increasing focus on water conservation and smart water management systems is creating new applications for advanced control valves in municipal and industrial water treatment facilities. The adoption of advanced materials for extreme environments and the development of modular valve designs for easier maintenance and customization also represent promising avenues for growth.
Growth Accelerators in the US Valve Industry Industry
Several catalysts are accelerating long-term growth in the US Valve Industry. The ongoing digital transformation across all industrial sectors is driving the adoption of intelligent valve solutions that offer enhanced control, monitoring, and predictive maintenance capabilities. Strategic partnerships between valve manufacturers and technology providers are fostering innovation in areas like AI-powered diagnostics and remote asset management. Market expansion strategies, including focusing on niche applications within emerging industries such as advanced manufacturing and biotechnology, are also playing a crucial role in driving sustained growth and market penetration.
Key Players Shaping the US Valve Industry Market
- Rotork Plc
- Flowserve Corporation
- American Production Valve
- Flow Line Valve and Controls
- Crane Holdings Co
- Emerson Electric Co
- Valve Solutions
- Valtorc International
- Schlumberger Limited
Notable Milestones in US Valve Industry Sector
- June 2021 - Belimo Americas launched a new 6-way pressure-independent control valve with features hydronically decoupled heating and cooling circuits with the integration of an innovative ball design. The valve provides 100% leakage protection in the closed position, preventing energy losses, improving efficiency, and reducing operating costs.
- January 2021 - Warren Controls, the US manufacturer of control valves and specialty fluid handling products has introduced its new ILEA 5800E Series of high-quality, modulating, linear, electrically actuated industrial globe control valves.
In-Depth US Valve Industry Market Outlook
The US Valve Industry is set for a dynamic and growth-oriented future. The integration of advanced technologies like AI and IoT will redefine operational efficiency and predictive maintenance, creating a more robust and responsive industrial ecosystem. Continued investment in infrastructure and the ongoing transition towards sustainable energy sources will act as powerful growth accelerators. The industry's ability to adapt to evolving regulatory landscapes and leverage the demand for customized, high-performance solutions will be key to unlocking its full market potential and securing strategic advantages in the years ahead.
US Valve Industry Segmentation
- 1. Production Analysis
- 2. Consumption Analysis
- 3. Import Market Analysis (Value & Volume)
- 4. Export Market Analysis (Value & Volume)
- 5. Price Trend Analysis
US Valve Industry Segmentation By Geography
- 1. United States
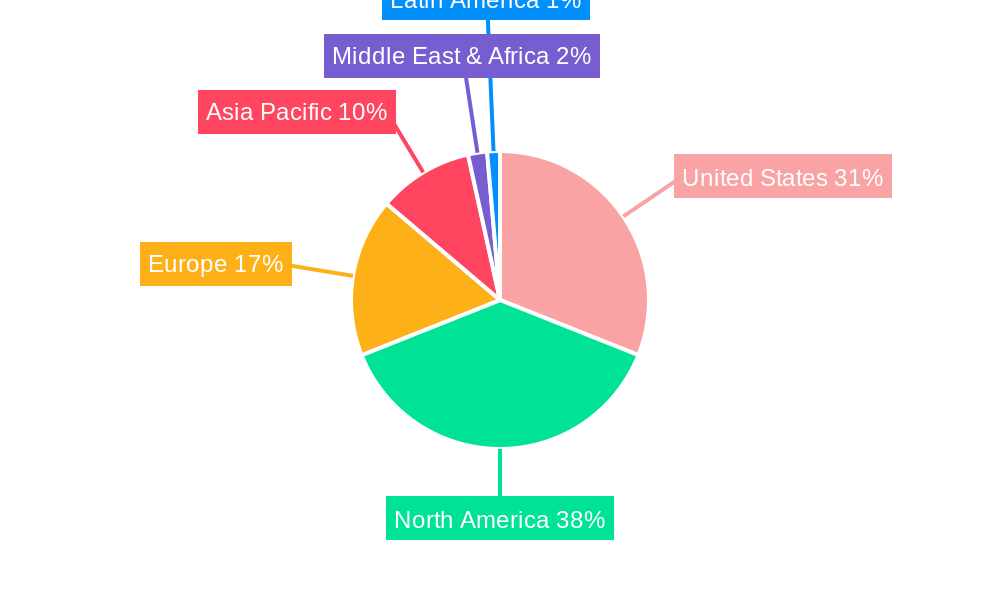
US Valve Industry Regional Market Share
Geographic Coverage of US Valve Industry
US Valve Industry REPORT HIGHLIGHTS
| Aspects | Details |
|---|---|
| Study Period | 2020-2034 |
| Base Year | 2025 |
| Estimated Year | 2026 |
| Forecast Period | 2026-2034 |
| Historical Period | 2020-2025 |
| Growth Rate | CAGR of 4.3% from 2020-2034 |
| Segmentation |
|
Table of Contents
- 1. Introduction
- 1.1. Research Scope
- 1.2. Market Segmentation
- 1.3. Research Methodology
- 1.4. Definitions and Assumptions
- 2. Executive Summary
- 2.1. Introduction
- 3. Market Dynamics
- 3.1. Introduction
- 3.2. Market Drivers
- 3.2.1. Increasing Demand of Valves in Oil & Gas Industry; Rising Adoption of Automation Technologies in Process Industries
- 3.3. Market Restrains
- 3.3.1. Lack of standardized certifications and government policies
- 3.4. Market Trends
- 3.4.1. Growing Adoption of Automation in Processing
- 4. Market Factor Analysis
- 4.1. Porters Five Forces
- 4.2. Supply/Value Chain
- 4.3. PESTEL analysis
- 4.4. Market Entropy
- 4.5. Patent/Trademark Analysis
- 5. US Valve Industry Analysis, Insights and Forecast, 2020-2032
- 5.1. Market Analysis, Insights and Forecast - by Production Analysis
- 5.2. Market Analysis, Insights and Forecast - by Consumption Analysis
- 5.3. Market Analysis, Insights and Forecast - by Import Market Analysis (Value & Volume)
- 5.4. Market Analysis, Insights and Forecast - by Export Market Analysis (Value & Volume)
- 5.5. Market Analysis, Insights and Forecast - by Price Trend Analysis
- 5.6. Market Analysis, Insights and Forecast - by Region
- 5.6.1. United States
- 5.1. Market Analysis, Insights and Forecast - by Production Analysis
- 6. Competitive Analysis
- 6.1. Market Share Analysis 2025
- 6.2. Company Profiles
- 6.2.1 Rotork Plc
- 6.2.1.1. Overview
- 6.2.1.2. Products
- 6.2.1.3. SWOT Analysis
- 6.2.1.4. Recent Developments
- 6.2.1.5. Financials (Based on Availability)
- 6.2.2 Flowserve Corporation
- 6.2.2.1. Overview
- 6.2.2.2. Products
- 6.2.2.3. SWOT Analysis
- 6.2.2.4. Recent Developments
- 6.2.2.5. Financials (Based on Availability)
- 6.2.3 American Production Valve
- 6.2.3.1. Overview
- 6.2.3.2. Products
- 6.2.3.3. SWOT Analysis
- 6.2.3.4. Recent Developments
- 6.2.3.5. Financials (Based on Availability)
- 6.2.4 Flow Line Valve and Controls
- 6.2.4.1. Overview
- 6.2.4.2. Products
- 6.2.4.3. SWOT Analysis
- 6.2.4.4. Recent Developments
- 6.2.4.5. Financials (Based on Availability)
- 6.2.5 Crane Holdings Co
- 6.2.5.1. Overview
- 6.2.5.2. Products
- 6.2.5.3. SWOT Analysis
- 6.2.5.4. Recent Developments
- 6.2.5.5. Financials (Based on Availability)
- 6.2.6 Emerson Electric Co
- 6.2.6.1. Overview
- 6.2.6.2. Products
- 6.2.6.3. SWOT Analysis
- 6.2.6.4. Recent Developments
- 6.2.6.5. Financials (Based on Availability)
- 6.2.7 Valve Solutions
- 6.2.7.1. Overview
- 6.2.7.2. Products
- 6.2.7.3. SWOT Analysis
- 6.2.7.4. Recent Developments
- 6.2.7.5. Financials (Based on Availability)
- 6.2.8 Valtorc International
- 6.2.8.1. Overview
- 6.2.8.2. Products
- 6.2.8.3. SWOT Analysis
- 6.2.8.4. Recent Developments
- 6.2.8.5. Financials (Based on Availability)
- 6.2.9 Schlumberger Limited
- 6.2.9.1. Overview
- 6.2.9.2. Products
- 6.2.9.3. SWOT Analysis
- 6.2.9.4. Recent Developments
- 6.2.9.5. Financials (Based on Availability)
- 6.2.1 Rotork Plc
List of Figures
- Figure 1: US Valve Industry Revenue Breakdown (billion, %) by Product 2025 & 2033
- Figure 2: US Valve Industry Share (%) by Company 2025
List of Tables
- Table 1: US Valve Industry Revenue billion Forecast, by Production Analysis 2020 & 2033
- Table 2: US Valve Industry Volume K Unit Forecast, by Production Analysis 2020 & 2033
- Table 3: US Valve Industry Revenue billion Forecast, by Consumption Analysis 2020 & 2033
- Table 4: US Valve Industry Volume K Unit Forecast, by Consumption Analysis 2020 & 2033
- Table 5: US Valve Industry Revenue billion Forecast, by Import Market Analysis (Value & Volume) 2020 & 2033
- Table 6: US Valve Industry Volume K Unit Forecast, by Import Market Analysis (Value & Volume) 2020 & 2033
- Table 7: US Valve Industry Revenue billion Forecast, by Export Market Analysis (Value & Volume) 2020 & 2033
- Table 8: US Valve Industry Volume K Unit Forecast, by Export Market Analysis (Value & Volume) 2020 & 2033
- Table 9: US Valve Industry Revenue billion Forecast, by Price Trend Analysis 2020 & 2033
- Table 10: US Valve Industry Volume K Unit Forecast, by Price Trend Analysis 2020 & 2033
- Table 11: US Valve Industry Revenue billion Forecast, by Region 2020 & 2033
- Table 12: US Valve Industry Volume K Unit Forecast, by Region 2020 & 2033
- Table 13: US Valve Industry Revenue billion Forecast, by Production Analysis 2020 & 2033
- Table 14: US Valve Industry Volume K Unit Forecast, by Production Analysis 2020 & 2033
- Table 15: US Valve Industry Revenue billion Forecast, by Consumption Analysis 2020 & 2033
- Table 16: US Valve Industry Volume K Unit Forecast, by Consumption Analysis 2020 & 2033
- Table 17: US Valve Industry Revenue billion Forecast, by Import Market Analysis (Value & Volume) 2020 & 2033
- Table 18: US Valve Industry Volume K Unit Forecast, by Import Market Analysis (Value & Volume) 2020 & 2033
- Table 19: US Valve Industry Revenue billion Forecast, by Export Market Analysis (Value & Volume) 2020 & 2033
- Table 20: US Valve Industry Volume K Unit Forecast, by Export Market Analysis (Value & Volume) 2020 & 2033
- Table 21: US Valve Industry Revenue billion Forecast, by Price Trend Analysis 2020 & 2033
- Table 22: US Valve Industry Volume K Unit Forecast, by Price Trend Analysis 2020 & 2033
- Table 23: US Valve Industry Revenue billion Forecast, by Country 2020 & 2033
- Table 24: US Valve Industry Volume K Unit Forecast, by Country 2020 & 2033
Frequently Asked Questions
1. What is the projected Compound Annual Growth Rate (CAGR) of the US Valve Industry?
The projected CAGR is approximately 4.3%.
2. Which companies are prominent players in the US Valve Industry?
Key companies in the market include Rotork Plc, Flowserve Corporation, American Production Valve, Flow Line Valve and Controls, Crane Holdings Co, Emerson Electric Co, Valve Solutions, Valtorc International, Schlumberger Limited.
3. What are the main segments of the US Valve Industry?
The market segments include Production Analysis, Consumption Analysis, Import Market Analysis (Value & Volume), Export Market Analysis (Value & Volume), Price Trend Analysis.
4. Can you provide details about the market size?
The market size is estimated to be USD 19 billion as of 2022.
5. What are some drivers contributing to market growth?
Increasing Demand of Valves in Oil & Gas Industry; Rising Adoption of Automation Technologies in Process Industries.
6. What are the notable trends driving market growth?
Growing Adoption of Automation in Processing.
7. Are there any restraints impacting market growth?
Lack of standardized certifications and government policies.
8. Can you provide examples of recent developments in the market?
June 2021 - Belimo Americas launched a new 6-way pressure-independent control valve with features hydronically decoupled heating and cooling circuits with the integration of an innovative ball design. The valve provides 100% leakage protection in the closed position, preventing energy losses, improving efficiency, and reducing operating costs.
9. What pricing options are available for accessing the report?
Pricing options include single-user, multi-user, and enterprise licenses priced at USD 3800, USD 4500, and USD 5800 respectively.
10. Is the market size provided in terms of value or volume?
The market size is provided in terms of value, measured in billion and volume, measured in K Unit.
11. Are there any specific market keywords associated with the report?
Yes, the market keyword associated with the report is "US Valve Industry," which aids in identifying and referencing the specific market segment covered.
12. How do I determine which pricing option suits my needs best?
The pricing options vary based on user requirements and access needs. Individual users may opt for single-user licenses, while businesses requiring broader access may choose multi-user or enterprise licenses for cost-effective access to the report.
13. Are there any additional resources or data provided in the US Valve Industry report?
While the report offers comprehensive insights, it's advisable to review the specific contents or supplementary materials provided to ascertain if additional resources or data are available.
14. How can I stay updated on further developments or reports in the US Valve Industry?
To stay informed about further developments, trends, and reports in the US Valve Industry, consider subscribing to industry newsletters, following relevant companies and organizations, or regularly checking reputable industry news sources and publications.
Methodology
Step 1 - Identification of Relevant Samples Size from Population Database


Step 2 - Approaches for Defining Global Market Size (Value, Volume* & Price*)

Note*: In applicable scenarios
Step 3 - Data Sources
Primary Research
- Web Analytics
- Survey Reports
- Research Institute
- Latest Research Reports
- Opinion Leaders
Secondary Research
- Annual Reports
- White Paper
- Latest Press Release
- Industry Association
- Paid Database
- Investor Presentations

Step 4 - Data Triangulation
Involves using different sources of information in order to increase the validity of a study
These sources are likely to be stakeholders in a program - participants, other researchers, program staff, other community members, and so on.
Then we put all data in single framework & apply various statistical tools to find out the dynamic on the market.
During the analysis stage, feedback from the stakeholder groups would be compared to determine areas of agreement as well as areas of divergence