

Key Insights
The global vaccine glass bottle market is projected for substantial expansion, propelled by escalating global vaccine demand and a marked preference for glass vials due to their inherent inertness and superior vaccine integrity preservation. The market size is estimated at $7.54 billion in the base year 2025, signifying consistent upward momentum. A Compound Annual Growth Rate (CAGR) of approximately 15.47% is anticipated between 2025 and 2033, indicating significant market development. This growth trajectory is underpinned by several critical drivers: increasing vaccination coverage for both routine and emerging infectious diseases, advancements in novel vaccine development (e.g., mRNA technology), and stringent regulatory mandates favoring glass containers for their biocompatibility. Enhanced focus on cold chain logistics and efficient, secure vaccine distribution further bolsters market demand.
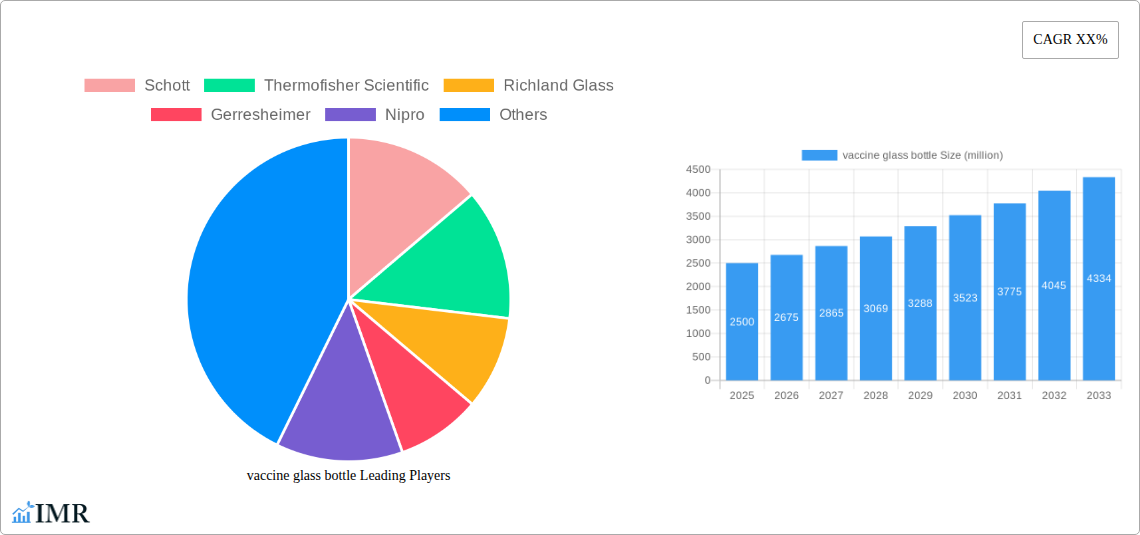
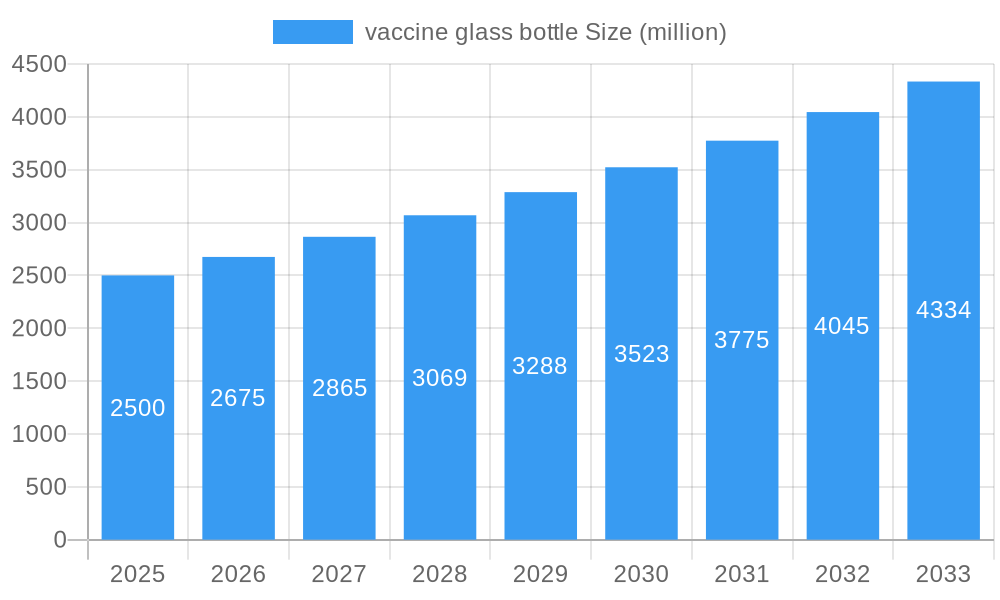
vaccine glass bottle Market Size (In Billion)
Leading industry participants, including Schott, Thermo Fisher Scientific, and Corning, command a significant market presence through their advanced manufacturing prowess and established distribution channels. The market also offers avenues for emerging players focusing on specialized applications or regional territories. Notwithstanding the positive outlook, the market faces challenges, such as potential volatility in raw material pricing (glass, packaging) affecting profitability. Intense competition from alternative packaging solutions, notably plastics, necessitates ongoing innovation in developing high-quality, cost-effective glass vials to sustain market share. Market segmentation by vial type (single-dose, multi-dose), capacity, and end-user (pharmaceutical companies, hospitals) offers granular insights into market dynamics and segment-specific growth prospects. Regional growth disparities are evident, with North America and Europe currently leading in market share, attributed to high vaccination rates and robust healthcare infrastructure. However, emerging economies in Asia-Pacific and Latin America are poised for accelerated growth in the foreseeable future.
vaccine glass bottle Company Market Share
Vaccine Glass Bottle Market Report: 2019-2033
This comprehensive report provides a detailed analysis of the global vaccine glass bottle market, offering invaluable insights for industry professionals, investors, and strategic decision-makers. The study period covers 2019-2033, with a base year of 2025 and a forecast period of 2025-2033. The report meticulously examines market dynamics, growth trends, regional dominance, product landscape, key players, and future outlook, providing a 360-degree view of this crucial sector within the pharmaceutical packaging industry. The total market size in 2025 is estimated at xx million units.
Vaccine Glass Bottle Market Dynamics & Structure
The vaccine glass bottle market is characterized by a moderately consolidated structure, with key players like Schott, Thermofisher Scientific, and Gerresheimer holding significant market share. Technological innovation, driven by the need for improved sterility, durability, and ease of handling, is a major growth driver. Stringent regulatory frameworks governing pharmaceutical packaging also influence market dynamics. While plastic alternatives exist, glass maintains dominance due to its inherent barrier properties and inertness, crucial for vaccine stability. The end-user demographic primarily comprises pharmaceutical companies and contract manufacturers. M&A activity in this space has been relatively moderate in recent years, with approximately xx million-unit capacity deals closed annually during the historical period (2019-2024).
- Market Concentration: Moderately consolidated, with the top 5 players holding approximately xx% market share in 2025.
- Technological Innovation: Focus on improved sterility assurance, lightweighting, and enhanced barrier properties.
- Regulatory Landscape: Stringent regulations from agencies like the FDA and EMA drive quality and safety standards.
- Competitive Substitutes: Plastic alternatives exist but glass retains dominance due to superior barrier properties.
- M&A Activity: xx million-unit capacity deals annually during 2019-2024, with an expected increase to xx million units annually during the forecast period.
- Innovation Barriers: High regulatory hurdles and stringent quality standards increase R&D costs and time-to-market.
Vaccine Glass Bottle Growth Trends & Insights
The global vaccine glass bottle market has witnessed consistent growth over the past few years, driven by increasing vaccination rates globally and the expanding pharmaceutical industry. The market size expanded from xx million units in 2019 to xx million units in 2024, exhibiting a CAGR of xx%. This positive trajectory is expected to continue, with the market projected to reach xx million units by 2033, driven by factors such as technological advancements in vaccine formulation and delivery, the emergence of new vaccines, and increasing government investment in immunization programs. The adoption rate of advanced glass types with improved barrier properties is also increasing, leading to a gradual shift in market share towards these premium products.
Dominant Regions, Countries, or Segments in Vaccine Glass Bottle
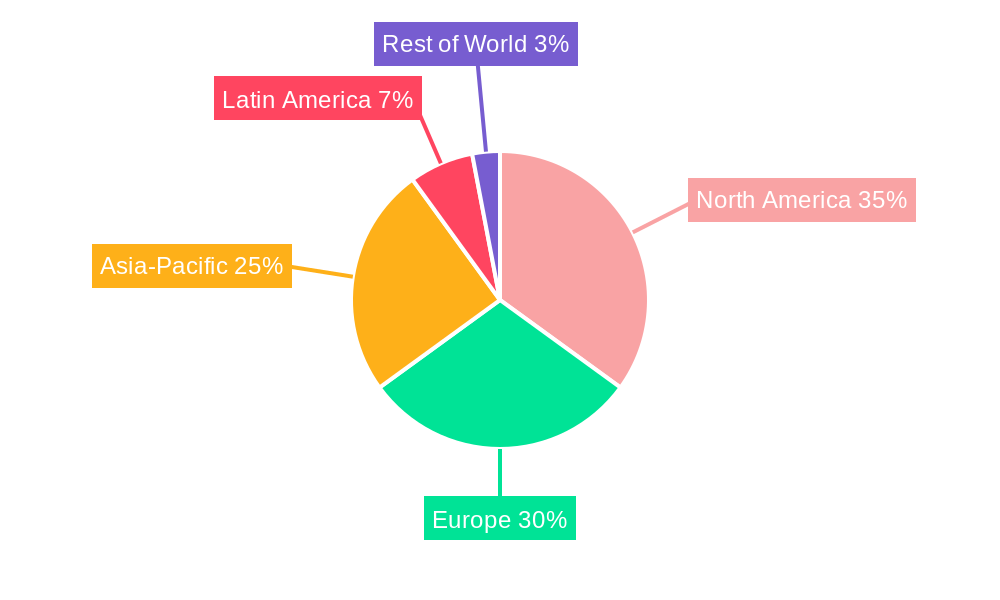
North America and Europe currently dominate the vaccine glass bottle market, driven by strong pharmaceutical industries, robust regulatory frameworks, and high vaccination rates. However, rapidly developing economies in Asia-Pacific are experiencing significant growth, fueled by rising disposable incomes, increased healthcare spending, and growing awareness of vaccine benefits. Within segments, pre-filled syringes and vials are the leading formats, accounting for xx% of the total market in 2025.
- North America: High per capita vaccine consumption, robust healthcare infrastructure, and strong regulatory support.
- Europe: Similar to North America, high vaccination rates and established pharmaceutical manufacturing capabilities.
- Asia-Pacific: Fastest-growing region, fueled by rising disposable incomes and increasing healthcare spending.
- Market Share: North America and Europe hold xx% of the market in 2025. Asia-Pacific is expected to grow at a CAGR of xx% during the forecast period.
Vaccine Glass Bottle Product Landscape
The vaccine glass bottle market offers a range of products, including vials, ampoules, and pre-filled syringes, each tailored to specific vaccine types and delivery methods. Recent innovations focus on improved barrier properties, reduced breakage rates, and enhanced compatibility with automated filling and packaging systems. Specific features include specialized coatings to enhance sterility and innovations in glass composition to improve durability and reduce weight. These advancements enhance vaccine stability, reduce waste, and improve overall efficiency in the manufacturing process.
Key Drivers, Barriers & Challenges in Vaccine Glass Bottle
Key Drivers: Increasing global vaccination rates, advancements in vaccine technology, stringent regulatory requirements demanding high-quality packaging, and growing demand for pre-filled syringes are driving the market.
Key Challenges: Fluctuations in raw material prices, intense competition from alternative packaging materials, stringent regulatory compliance requirements, and supply chain disruptions due to geopolitical factors pose significant challenges. The impact of these challenges is estimated to reduce the market growth by approximately xx million units annually during the forecast period.
Emerging Opportunities in Vaccine Glass Bottle
Emerging opportunities lie in developing innovative glass formulations with enhanced barrier properties, exploring sustainable packaging solutions, and expanding into emerging markets with growing vaccination needs. The development of specialized containers for mRNA and other novel vaccines presents a particularly lucrative opportunity. Furthermore, partnerships with pharmaceutical companies to co-develop customized packaging solutions are gaining traction.
Growth Accelerators in the Vaccine Glass Bottle Industry
Technological advancements, strategic partnerships, and market expansion into emerging economies are key growth accelerators. Advancements in glass manufacturing technologies are leading to the production of lighter, stronger, and more cost-effective containers. Strategic partnerships between packaging companies and pharmaceutical manufacturers facilitate the development of tailored solutions.
Key Players Shaping the Vaccine Glass Bottle Market
- Schott
- Thermofisher Scientific
- Richland Glass
- Gerresheimer
- Nipro
- Corning
- DWK Life Sciences
- Qorpak
- Pacific Vial Manufacturing
- Shandong Pharmaceutical Glass
- Anhui Huaxin Glass
- JOTOP Glass
- Origin Ltd
- Jinan Youlyy
- Stevanato
- Vetter Pharma
Notable Milestones in Vaccine Glass Bottle Sector
- 2020: Increased demand for vaccine glass bottles due to the COVID-19 pandemic.
- 2021: Several key players invested heavily in expanding their manufacturing capacity.
- 2022: Introduction of new glass formulations with improved barrier properties.
- 2023: Several M&A activities consolidate market share.
In-Depth Vaccine Glass Bottle Market Outlook
The future of the vaccine glass bottle market looks promising, driven by sustained growth in global vaccination rates, the emergence of new vaccines, and ongoing technological advancements. Strategic partnerships, focus on sustainability, and expansion into emerging markets will further accelerate market growth. The market is projected to experience robust growth, driven by increasing demand for high-quality, safe, and reliable packaging for vaccines globally.
vaccine glass bottle Segmentation
-
1. Application
- 1.1. Preventive Vaccine
- 1.2. Therapeutic Vaccine
-
2. Types
- 2.1. Single Dose
- 2.2. Multi-dose
vaccine glass bottle Segmentation By Geography
-
1. North America
- 1.1. United States
- 1.2. Canada
- 1.3. Mexico
-
2. South America
- 2.1. Brazil
- 2.2. Argentina
- 2.3. Rest of South America
-
3. Europe
- 3.1. United Kingdom
- 3.2. Germany
- 3.3. France
- 3.4. Italy
- 3.5. Spain
- 3.6. Russia
- 3.7. Benelux
- 3.8. Nordics
- 3.9. Rest of Europe
-
4. Middle East & Africa
- 4.1. Turkey
- 4.2. Israel
- 4.3. GCC
- 4.4. North Africa
- 4.5. South Africa
- 4.6. Rest of Middle East & Africa
-
5. Asia Pacific
- 5.1. China
- 5.2. India
- 5.3. Japan
- 5.4. South Korea
- 5.5. ASEAN
- 5.6. Oceania
- 5.7. Rest of Asia Pacific
vaccine glass bottle Regional Market Share
Geographic Coverage of vaccine glass bottle
vaccine glass bottle REPORT HIGHLIGHTS
| Aspects | Details |
|---|---|
| Study Period | 2020-2034 |
| Base Year | 2025 |
| Estimated Year | 2026 |
| Forecast Period | 2026-2034 |
| Historical Period | 2020-2025 |
| Growth Rate | CAGR of 15.47% from 2020-2034 |
| Segmentation |
|
Table of Contents
- 1. Introduction
- 1.1. Research Scope
- 1.2. Market Segmentation
- 1.3. Research Methodology
- 1.4. Definitions and Assumptions
- 2. Executive Summary
- 2.1. Introduction
- 3. Market Dynamics
- 3.1. Introduction
- 3.2. Market Drivers
- 3.3. Market Restrains
- 3.4. Market Trends
- 4. Market Factor Analysis
- 4.1. Porters Five Forces
- 4.2. Supply/Value Chain
- 4.3. PESTEL analysis
- 4.4. Market Entropy
- 4.5. Patent/Trademark Analysis
- 5. Global vaccine glass bottle Analysis, Insights and Forecast, 2020-2032
- 5.1. Market Analysis, Insights and Forecast - by Application
- 5.1.1. Preventive Vaccine
- 5.1.2. Therapeutic Vaccine
- 5.2. Market Analysis, Insights and Forecast - by Types
- 5.2.1. Single Dose
- 5.2.2. Multi-dose
- 5.3. Market Analysis, Insights and Forecast - by Region
- 5.3.1. North America
- 5.3.2. South America
- 5.3.3. Europe
- 5.3.4. Middle East & Africa
- 5.3.5. Asia Pacific
- 5.1. Market Analysis, Insights and Forecast - by Application
- 6. North America vaccine glass bottle Analysis, Insights and Forecast, 2020-2032
- 6.1. Market Analysis, Insights and Forecast - by Application
- 6.1.1. Preventive Vaccine
- 6.1.2. Therapeutic Vaccine
- 6.2. Market Analysis, Insights and Forecast - by Types
- 6.2.1. Single Dose
- 6.2.2. Multi-dose
- 6.1. Market Analysis, Insights and Forecast - by Application
- 7. South America vaccine glass bottle Analysis, Insights and Forecast, 2020-2032
- 7.1. Market Analysis, Insights and Forecast - by Application
- 7.1.1. Preventive Vaccine
- 7.1.2. Therapeutic Vaccine
- 7.2. Market Analysis, Insights and Forecast - by Types
- 7.2.1. Single Dose
- 7.2.2. Multi-dose
- 7.1. Market Analysis, Insights and Forecast - by Application
- 8. Europe vaccine glass bottle Analysis, Insights and Forecast, 2020-2032
- 8.1. Market Analysis, Insights and Forecast - by Application
- 8.1.1. Preventive Vaccine
- 8.1.2. Therapeutic Vaccine
- 8.2. Market Analysis, Insights and Forecast - by Types
- 8.2.1. Single Dose
- 8.2.2. Multi-dose
- 8.1. Market Analysis, Insights and Forecast - by Application
- 9. Middle East & Africa vaccine glass bottle Analysis, Insights and Forecast, 2020-2032
- 9.1. Market Analysis, Insights and Forecast - by Application
- 9.1.1. Preventive Vaccine
- 9.1.2. Therapeutic Vaccine
- 9.2. Market Analysis, Insights and Forecast - by Types
- 9.2.1. Single Dose
- 9.2.2. Multi-dose
- 9.1. Market Analysis, Insights and Forecast - by Application
- 10. Asia Pacific vaccine glass bottle Analysis, Insights and Forecast, 2020-2032
- 10.1. Market Analysis, Insights and Forecast - by Application
- 10.1.1. Preventive Vaccine
- 10.1.2. Therapeutic Vaccine
- 10.2. Market Analysis, Insights and Forecast - by Types
- 10.2.1. Single Dose
- 10.2.2. Multi-dose
- 10.1. Market Analysis, Insights and Forecast - by Application
- 11. Competitive Analysis
- 11.1. Global Market Share Analysis 2025
- 11.2. Company Profiles
- 11.2.1 Schott
- 11.2.1.1. Overview
- 11.2.1.2. Products
- 11.2.1.3. SWOT Analysis
- 11.2.1.4. Recent Developments
- 11.2.1.5. Financials (Based on Availability)
- 11.2.2 Thermofisher Scientific
- 11.2.2.1. Overview
- 11.2.2.2. Products
- 11.2.2.3. SWOT Analysis
- 11.2.2.4. Recent Developments
- 11.2.2.5. Financials (Based on Availability)
- 11.2.3 Richland Glass
- 11.2.3.1. Overview
- 11.2.3.2. Products
- 11.2.3.3. SWOT Analysis
- 11.2.3.4. Recent Developments
- 11.2.3.5. Financials (Based on Availability)
- 11.2.4 Gerresheimer
- 11.2.4.1. Overview
- 11.2.4.2. Products
- 11.2.4.3. SWOT Analysis
- 11.2.4.4. Recent Developments
- 11.2.4.5. Financials (Based on Availability)
- 11.2.5 Nipro
- 11.2.5.1. Overview
- 11.2.5.2. Products
- 11.2.5.3. SWOT Analysis
- 11.2.5.4. Recent Developments
- 11.2.5.5. Financials (Based on Availability)
- 11.2.6 Corning
- 11.2.6.1. Overview
- 11.2.6.2. Products
- 11.2.6.3. SWOT Analysis
- 11.2.6.4. Recent Developments
- 11.2.6.5. Financials (Based on Availability)
- 11.2.7 DWK Life Sciences
- 11.2.7.1. Overview
- 11.2.7.2. Products
- 11.2.7.3. SWOT Analysis
- 11.2.7.4. Recent Developments
- 11.2.7.5. Financials (Based on Availability)
- 11.2.8 Qorpak
- 11.2.8.1. Overview
- 11.2.8.2. Products
- 11.2.8.3. SWOT Analysis
- 11.2.8.4. Recent Developments
- 11.2.8.5. Financials (Based on Availability)
- 11.2.9 Pacific Vial Manufacturing
- 11.2.9.1. Overview
- 11.2.9.2. Products
- 11.2.9.3. SWOT Analysis
- 11.2.9.4. Recent Developments
- 11.2.9.5. Financials (Based on Availability)
- 11.2.10 Shandong Pharmaceutical Glass
- 11.2.10.1. Overview
- 11.2.10.2. Products
- 11.2.10.3. SWOT Analysis
- 11.2.10.4. Recent Developments
- 11.2.10.5. Financials (Based on Availability)
- 11.2.11 Anhui Huaxin Glass
- 11.2.11.1. Overview
- 11.2.11.2. Products
- 11.2.11.3. SWOT Analysis
- 11.2.11.4. Recent Developments
- 11.2.11.5. Financials (Based on Availability)
- 11.2.12 JOTOP Glass
- 11.2.12.1. Overview
- 11.2.12.2. Products
- 11.2.12.3. SWOT Analysis
- 11.2.12.4. Recent Developments
- 11.2.12.5. Financials (Based on Availability)
- 11.2.13 Origin Ltd
- 11.2.13.1. Overview
- 11.2.13.2. Products
- 11.2.13.3. SWOT Analysis
- 11.2.13.4. Recent Developments
- 11.2.13.5. Financials (Based on Availability)
- 11.2.14 Jinan Youlyy
- 11.2.14.1. Overview
- 11.2.14.2. Products
- 11.2.14.3. SWOT Analysis
- 11.2.14.4. Recent Developments
- 11.2.14.5. Financials (Based on Availability)
- 11.2.15 Stevanato
- 11.2.15.1. Overview
- 11.2.15.2. Products
- 11.2.15.3. SWOT Analysis
- 11.2.15.4. Recent Developments
- 11.2.15.5. Financials (Based on Availability)
- 11.2.16 Vetter Pharma
- 11.2.16.1. Overview
- 11.2.16.2. Products
- 11.2.16.3. SWOT Analysis
- 11.2.16.4. Recent Developments
- 11.2.16.5. Financials (Based on Availability)
- 11.2.1 Schott
List of Figures
- Figure 1: Global vaccine glass bottle Revenue Breakdown (billion, %) by Region 2025 & 2033
- Figure 2: Global vaccine glass bottle Volume Breakdown (K, %) by Region 2025 & 2033
- Figure 3: North America vaccine glass bottle Revenue (billion), by Application 2025 & 2033
- Figure 4: North America vaccine glass bottle Volume (K), by Application 2025 & 2033
- Figure 5: North America vaccine glass bottle Revenue Share (%), by Application 2025 & 2033
- Figure 6: North America vaccine glass bottle Volume Share (%), by Application 2025 & 2033
- Figure 7: North America vaccine glass bottle Revenue (billion), by Types 2025 & 2033
- Figure 8: North America vaccine glass bottle Volume (K), by Types 2025 & 2033
- Figure 9: North America vaccine glass bottle Revenue Share (%), by Types 2025 & 2033
- Figure 10: North America vaccine glass bottle Volume Share (%), by Types 2025 & 2033
- Figure 11: North America vaccine glass bottle Revenue (billion), by Country 2025 & 2033
- Figure 12: North America vaccine glass bottle Volume (K), by Country 2025 & 2033
- Figure 13: North America vaccine glass bottle Revenue Share (%), by Country 2025 & 2033
- Figure 14: North America vaccine glass bottle Volume Share (%), by Country 2025 & 2033
- Figure 15: South America vaccine glass bottle Revenue (billion), by Application 2025 & 2033
- Figure 16: South America vaccine glass bottle Volume (K), by Application 2025 & 2033
- Figure 17: South America vaccine glass bottle Revenue Share (%), by Application 2025 & 2033
- Figure 18: South America vaccine glass bottle Volume Share (%), by Application 2025 & 2033
- Figure 19: South America vaccine glass bottle Revenue (billion), by Types 2025 & 2033
- Figure 20: South America vaccine glass bottle Volume (K), by Types 2025 & 2033
- Figure 21: South America vaccine glass bottle Revenue Share (%), by Types 2025 & 2033
- Figure 22: South America vaccine glass bottle Volume Share (%), by Types 2025 & 2033
- Figure 23: South America vaccine glass bottle Revenue (billion), by Country 2025 & 2033
- Figure 24: South America vaccine glass bottle Volume (K), by Country 2025 & 2033
- Figure 25: South America vaccine glass bottle Revenue Share (%), by Country 2025 & 2033
- Figure 26: South America vaccine glass bottle Volume Share (%), by Country 2025 & 2033
- Figure 27: Europe vaccine glass bottle Revenue (billion), by Application 2025 & 2033
- Figure 28: Europe vaccine glass bottle Volume (K), by Application 2025 & 2033
- Figure 29: Europe vaccine glass bottle Revenue Share (%), by Application 2025 & 2033
- Figure 30: Europe vaccine glass bottle Volume Share (%), by Application 2025 & 2033
- Figure 31: Europe vaccine glass bottle Revenue (billion), by Types 2025 & 2033
- Figure 32: Europe vaccine glass bottle Volume (K), by Types 2025 & 2033
- Figure 33: Europe vaccine glass bottle Revenue Share (%), by Types 2025 & 2033
- Figure 34: Europe vaccine glass bottle Volume Share (%), by Types 2025 & 2033
- Figure 35: Europe vaccine glass bottle Revenue (billion), by Country 2025 & 2033
- Figure 36: Europe vaccine glass bottle Volume (K), by Country 2025 & 2033
- Figure 37: Europe vaccine glass bottle Revenue Share (%), by Country 2025 & 2033
- Figure 38: Europe vaccine glass bottle Volume Share (%), by Country 2025 & 2033
- Figure 39: Middle East & Africa vaccine glass bottle Revenue (billion), by Application 2025 & 2033
- Figure 40: Middle East & Africa vaccine glass bottle Volume (K), by Application 2025 & 2033
- Figure 41: Middle East & Africa vaccine glass bottle Revenue Share (%), by Application 2025 & 2033
- Figure 42: Middle East & Africa vaccine glass bottle Volume Share (%), by Application 2025 & 2033
- Figure 43: Middle East & Africa vaccine glass bottle Revenue (billion), by Types 2025 & 2033
- Figure 44: Middle East & Africa vaccine glass bottle Volume (K), by Types 2025 & 2033
- Figure 45: Middle East & Africa vaccine glass bottle Revenue Share (%), by Types 2025 & 2033
- Figure 46: Middle East & Africa vaccine glass bottle Volume Share (%), by Types 2025 & 2033
- Figure 47: Middle East & Africa vaccine glass bottle Revenue (billion), by Country 2025 & 2033
- Figure 48: Middle East & Africa vaccine glass bottle Volume (K), by Country 2025 & 2033
- Figure 49: Middle East & Africa vaccine glass bottle Revenue Share (%), by Country 2025 & 2033
- Figure 50: Middle East & Africa vaccine glass bottle Volume Share (%), by Country 2025 & 2033
- Figure 51: Asia Pacific vaccine glass bottle Revenue (billion), by Application 2025 & 2033
- Figure 52: Asia Pacific vaccine glass bottle Volume (K), by Application 2025 & 2033
- Figure 53: Asia Pacific vaccine glass bottle Revenue Share (%), by Application 2025 & 2033
- Figure 54: Asia Pacific vaccine glass bottle Volume Share (%), by Application 2025 & 2033
- Figure 55: Asia Pacific vaccine glass bottle Revenue (billion), by Types 2025 & 2033
- Figure 56: Asia Pacific vaccine glass bottle Volume (K), by Types 2025 & 2033
- Figure 57: Asia Pacific vaccine glass bottle Revenue Share (%), by Types 2025 & 2033
- Figure 58: Asia Pacific vaccine glass bottle Volume Share (%), by Types 2025 & 2033
- Figure 59: Asia Pacific vaccine glass bottle Revenue (billion), by Country 2025 & 2033
- Figure 60: Asia Pacific vaccine glass bottle Volume (K), by Country 2025 & 2033
- Figure 61: Asia Pacific vaccine glass bottle Revenue Share (%), by Country 2025 & 2033
- Figure 62: Asia Pacific vaccine glass bottle Volume Share (%), by Country 2025 & 2033
List of Tables
- Table 1: Global vaccine glass bottle Revenue billion Forecast, by Application 2020 & 2033
- Table 2: Global vaccine glass bottle Volume K Forecast, by Application 2020 & 2033
- Table 3: Global vaccine glass bottle Revenue billion Forecast, by Types 2020 & 2033
- Table 4: Global vaccine glass bottle Volume K Forecast, by Types 2020 & 2033
- Table 5: Global vaccine glass bottle Revenue billion Forecast, by Region 2020 & 2033
- Table 6: Global vaccine glass bottle Volume K Forecast, by Region 2020 & 2033
- Table 7: Global vaccine glass bottle Revenue billion Forecast, by Application 2020 & 2033
- Table 8: Global vaccine glass bottle Volume K Forecast, by Application 2020 & 2033
- Table 9: Global vaccine glass bottle Revenue billion Forecast, by Types 2020 & 2033
- Table 10: Global vaccine glass bottle Volume K Forecast, by Types 2020 & 2033
- Table 11: Global vaccine glass bottle Revenue billion Forecast, by Country 2020 & 2033
- Table 12: Global vaccine glass bottle Volume K Forecast, by Country 2020 & 2033
- Table 13: United States vaccine glass bottle Revenue (billion) Forecast, by Application 2020 & 2033
- Table 14: United States vaccine glass bottle Volume (K) Forecast, by Application 2020 & 2033
- Table 15: Canada vaccine glass bottle Revenue (billion) Forecast, by Application 2020 & 2033
- Table 16: Canada vaccine glass bottle Volume (K) Forecast, by Application 2020 & 2033
- Table 17: Mexico vaccine glass bottle Revenue (billion) Forecast, by Application 2020 & 2033
- Table 18: Mexico vaccine glass bottle Volume (K) Forecast, by Application 2020 & 2033
- Table 19: Global vaccine glass bottle Revenue billion Forecast, by Application 2020 & 2033
- Table 20: Global vaccine glass bottle Volume K Forecast, by Application 2020 & 2033
- Table 21: Global vaccine glass bottle Revenue billion Forecast, by Types 2020 & 2033
- Table 22: Global vaccine glass bottle Volume K Forecast, by Types 2020 & 2033
- Table 23: Global vaccine glass bottle Revenue billion Forecast, by Country 2020 & 2033
- Table 24: Global vaccine glass bottle Volume K Forecast, by Country 2020 & 2033
- Table 25: Brazil vaccine glass bottle Revenue (billion) Forecast, by Application 2020 & 2033
- Table 26: Brazil vaccine glass bottle Volume (K) Forecast, by Application 2020 & 2033
- Table 27: Argentina vaccine glass bottle Revenue (billion) Forecast, by Application 2020 & 2033
- Table 28: Argentina vaccine glass bottle Volume (K) Forecast, by Application 2020 & 2033
- Table 29: Rest of South America vaccine glass bottle Revenue (billion) Forecast, by Application 2020 & 2033
- Table 30: Rest of South America vaccine glass bottle Volume (K) Forecast, by Application 2020 & 2033
- Table 31: Global vaccine glass bottle Revenue billion Forecast, by Application 2020 & 2033
- Table 32: Global vaccine glass bottle Volume K Forecast, by Application 2020 & 2033
- Table 33: Global vaccine glass bottle Revenue billion Forecast, by Types 2020 & 2033
- Table 34: Global vaccine glass bottle Volume K Forecast, by Types 2020 & 2033
- Table 35: Global vaccine glass bottle Revenue billion Forecast, by Country 2020 & 2033
- Table 36: Global vaccine glass bottle Volume K Forecast, by Country 2020 & 2033
- Table 37: United Kingdom vaccine glass bottle Revenue (billion) Forecast, by Application 2020 & 2033
- Table 38: United Kingdom vaccine glass bottle Volume (K) Forecast, by Application 2020 & 2033
- Table 39: Germany vaccine glass bottle Revenue (billion) Forecast, by Application 2020 & 2033
- Table 40: Germany vaccine glass bottle Volume (K) Forecast, by Application 2020 & 2033
- Table 41: France vaccine glass bottle Revenue (billion) Forecast, by Application 2020 & 2033
- Table 42: France vaccine glass bottle Volume (K) Forecast, by Application 2020 & 2033
- Table 43: Italy vaccine glass bottle Revenue (billion) Forecast, by Application 2020 & 2033
- Table 44: Italy vaccine glass bottle Volume (K) Forecast, by Application 2020 & 2033
- Table 45: Spain vaccine glass bottle Revenue (billion) Forecast, by Application 2020 & 2033
- Table 46: Spain vaccine glass bottle Volume (K) Forecast, by Application 2020 & 2033
- Table 47: Russia vaccine glass bottle Revenue (billion) Forecast, by Application 2020 & 2033
- Table 48: Russia vaccine glass bottle Volume (K) Forecast, by Application 2020 & 2033
- Table 49: Benelux vaccine glass bottle Revenue (billion) Forecast, by Application 2020 & 2033
- Table 50: Benelux vaccine glass bottle Volume (K) Forecast, by Application 2020 & 2033
- Table 51: Nordics vaccine glass bottle Revenue (billion) Forecast, by Application 2020 & 2033
- Table 52: Nordics vaccine glass bottle Volume (K) Forecast, by Application 2020 & 2033
- Table 53: Rest of Europe vaccine glass bottle Revenue (billion) Forecast, by Application 2020 & 2033
- Table 54: Rest of Europe vaccine glass bottle Volume (K) Forecast, by Application 2020 & 2033
- Table 55: Global vaccine glass bottle Revenue billion Forecast, by Application 2020 & 2033
- Table 56: Global vaccine glass bottle Volume K Forecast, by Application 2020 & 2033
- Table 57: Global vaccine glass bottle Revenue billion Forecast, by Types 2020 & 2033
- Table 58: Global vaccine glass bottle Volume K Forecast, by Types 2020 & 2033
- Table 59: Global vaccine glass bottle Revenue billion Forecast, by Country 2020 & 2033
- Table 60: Global vaccine glass bottle Volume K Forecast, by Country 2020 & 2033
- Table 61: Turkey vaccine glass bottle Revenue (billion) Forecast, by Application 2020 & 2033
- Table 62: Turkey vaccine glass bottle Volume (K) Forecast, by Application 2020 & 2033
- Table 63: Israel vaccine glass bottle Revenue (billion) Forecast, by Application 2020 & 2033
- Table 64: Israel vaccine glass bottle Volume (K) Forecast, by Application 2020 & 2033
- Table 65: GCC vaccine glass bottle Revenue (billion) Forecast, by Application 2020 & 2033
- Table 66: GCC vaccine glass bottle Volume (K) Forecast, by Application 2020 & 2033
- Table 67: North Africa vaccine glass bottle Revenue (billion) Forecast, by Application 2020 & 2033
- Table 68: North Africa vaccine glass bottle Volume (K) Forecast, by Application 2020 & 2033
- Table 69: South Africa vaccine glass bottle Revenue (billion) Forecast, by Application 2020 & 2033
- Table 70: South Africa vaccine glass bottle Volume (K) Forecast, by Application 2020 & 2033
- Table 71: Rest of Middle East & Africa vaccine glass bottle Revenue (billion) Forecast, by Application 2020 & 2033
- Table 72: Rest of Middle East & Africa vaccine glass bottle Volume (K) Forecast, by Application 2020 & 2033
- Table 73: Global vaccine glass bottle Revenue billion Forecast, by Application 2020 & 2033
- Table 74: Global vaccine glass bottle Volume K Forecast, by Application 2020 & 2033
- Table 75: Global vaccine glass bottle Revenue billion Forecast, by Types 2020 & 2033
- Table 76: Global vaccine glass bottle Volume K Forecast, by Types 2020 & 2033
- Table 77: Global vaccine glass bottle Revenue billion Forecast, by Country 2020 & 2033
- Table 78: Global vaccine glass bottle Volume K Forecast, by Country 2020 & 2033
- Table 79: China vaccine glass bottle Revenue (billion) Forecast, by Application 2020 & 2033
- Table 80: China vaccine glass bottle Volume (K) Forecast, by Application 2020 & 2033
- Table 81: India vaccine glass bottle Revenue (billion) Forecast, by Application 2020 & 2033
- Table 82: India vaccine glass bottle Volume (K) Forecast, by Application 2020 & 2033
- Table 83: Japan vaccine glass bottle Revenue (billion) Forecast, by Application 2020 & 2033
- Table 84: Japan vaccine glass bottle Volume (K) Forecast, by Application 2020 & 2033
- Table 85: South Korea vaccine glass bottle Revenue (billion) Forecast, by Application 2020 & 2033
- Table 86: South Korea vaccine glass bottle Volume (K) Forecast, by Application 2020 & 2033
- Table 87: ASEAN vaccine glass bottle Revenue (billion) Forecast, by Application 2020 & 2033
- Table 88: ASEAN vaccine glass bottle Volume (K) Forecast, by Application 2020 & 2033
- Table 89: Oceania vaccine glass bottle Revenue (billion) Forecast, by Application 2020 & 2033
- Table 90: Oceania vaccine glass bottle Volume (K) Forecast, by Application 2020 & 2033
- Table 91: Rest of Asia Pacific vaccine glass bottle Revenue (billion) Forecast, by Application 2020 & 2033
- Table 92: Rest of Asia Pacific vaccine glass bottle Volume (K) Forecast, by Application 2020 & 2033
Frequently Asked Questions
1. What is the projected Compound Annual Growth Rate (CAGR) of the vaccine glass bottle?
The projected CAGR is approximately 15.47%.
2. Which companies are prominent players in the vaccine glass bottle?
Key companies in the market include Schott, Thermofisher Scientific, Richland Glass, Gerresheimer, Nipro, Corning, DWK Life Sciences, Qorpak, Pacific Vial Manufacturing, Shandong Pharmaceutical Glass, Anhui Huaxin Glass, JOTOP Glass, Origin Ltd, Jinan Youlyy, Stevanato, Vetter Pharma.
3. What are the main segments of the vaccine glass bottle?
The market segments include Application, Types.
4. Can you provide details about the market size?
The market size is estimated to be USD 7.54 billion as of 2022.
5. What are some drivers contributing to market growth?
N/A
6. What are the notable trends driving market growth?
N/A
7. Are there any restraints impacting market growth?
N/A
8. Can you provide examples of recent developments in the market?
N/A
9. What pricing options are available for accessing the report?
Pricing options include single-user, multi-user, and enterprise licenses priced at USD 4350.00, USD 6525.00, and USD 8700.00 respectively.
10. Is the market size provided in terms of value or volume?
The market size is provided in terms of value, measured in billion and volume, measured in K.
11. Are there any specific market keywords associated with the report?
Yes, the market keyword associated with the report is "vaccine glass bottle," which aids in identifying and referencing the specific market segment covered.
12. How do I determine which pricing option suits my needs best?
The pricing options vary based on user requirements and access needs. Individual users may opt for single-user licenses, while businesses requiring broader access may choose multi-user or enterprise licenses for cost-effective access to the report.
13. Are there any additional resources or data provided in the vaccine glass bottle report?
While the report offers comprehensive insights, it's advisable to review the specific contents or supplementary materials provided to ascertain if additional resources or data are available.
14. How can I stay updated on further developments or reports in the vaccine glass bottle?
To stay informed about further developments, trends, and reports in the vaccine glass bottle, consider subscribing to industry newsletters, following relevant companies and organizations, or regularly checking reputable industry news sources and publications.
Methodology
Step 1 - Identification of Relevant Samples Size from Population Database


Step 2 - Approaches for Defining Global Market Size (Value, Volume* & Price*)

Note*: In applicable scenarios
Step 3 - Data Sources
Primary Research
- Web Analytics
- Survey Reports
- Research Institute
- Latest Research Reports
- Opinion Leaders
Secondary Research
- Annual Reports
- White Paper
- Latest Press Release
- Industry Association
- Paid Database
- Investor Presentations

Step 4 - Data Triangulation
Involves using different sources of information in order to increase the validity of a study
These sources are likely to be stakeholders in a program - participants, other researchers, program staff, other community members, and so on.
Then we put all data in single framework & apply various statistical tools to find out the dynamic on the market.
During the analysis stage, feedback from the stakeholder groups would be compared to determine areas of agreement as well as areas of divergence