

Key Insights
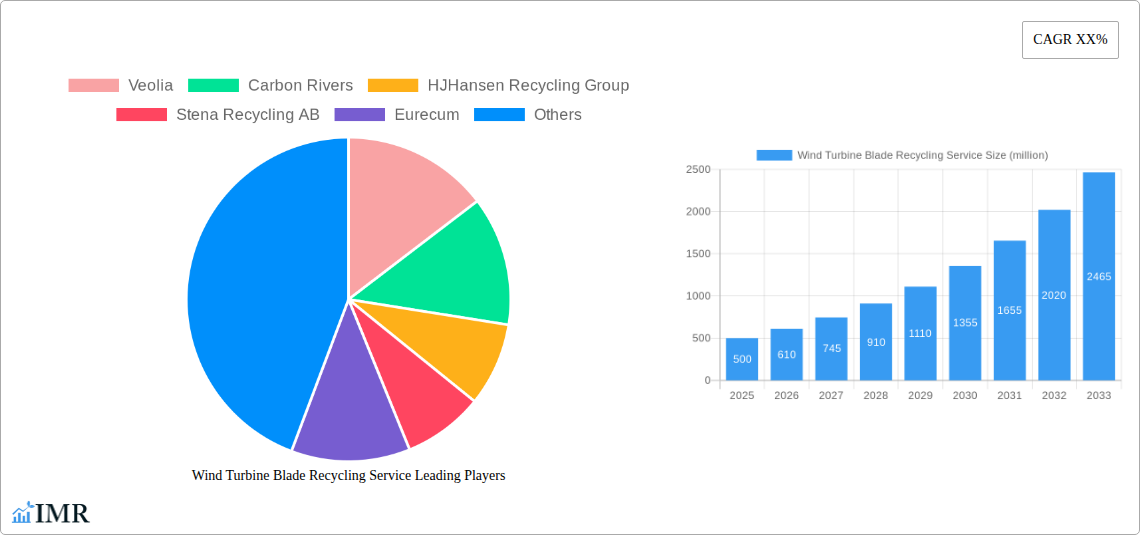
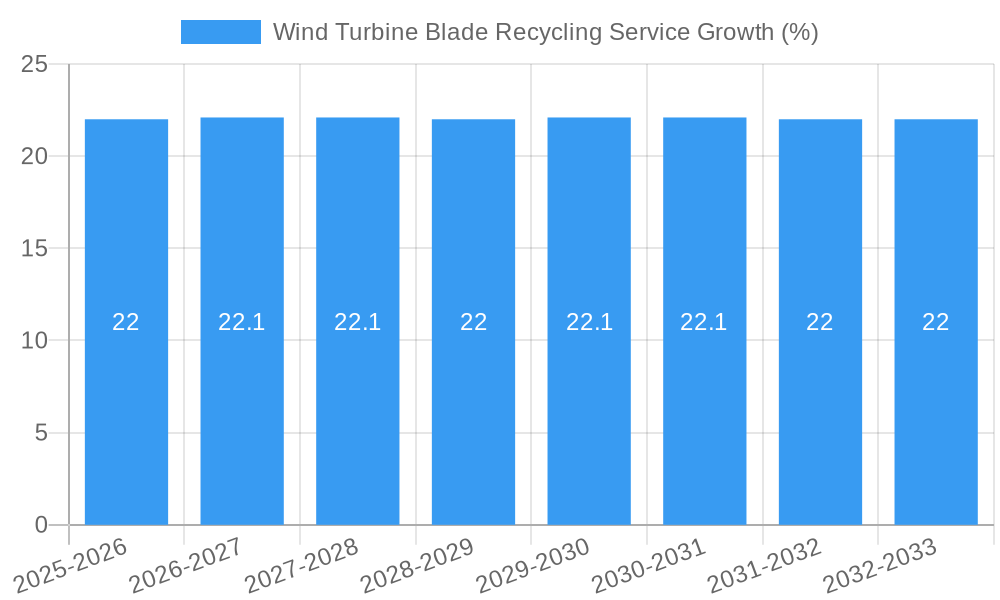
The Wind Turbine Blade Recycling Service market is poised for significant expansion, with an estimated market size of approximately $500 million in 2025, projected to grow at a Compound Annual Growth Rate (CAGR) of around 20% through 2033. This robust growth is fueled by the escalating global deployment of wind energy, leading to a rapidly increasing volume of decommissioned turbine blades reaching their end-of-life. Environmental regulations and corporate sustainability initiatives are also major drivers, compelling stakeholders to adopt responsible disposal and recycling solutions. The increasing awareness of the economic potential of recovered materials, such as carbon fiber and fiberglass, further incentivizes investment in advanced recycling technologies. The market is broadly segmented by application, with the Cement Industry and Packaging Industry emerging as key consumers of recycled blade materials due to their cost-effectiveness and growing demand for sustainable inputs. The Reuse segment also holds considerable promise, as innovative applications for whole or partial blades are explored.
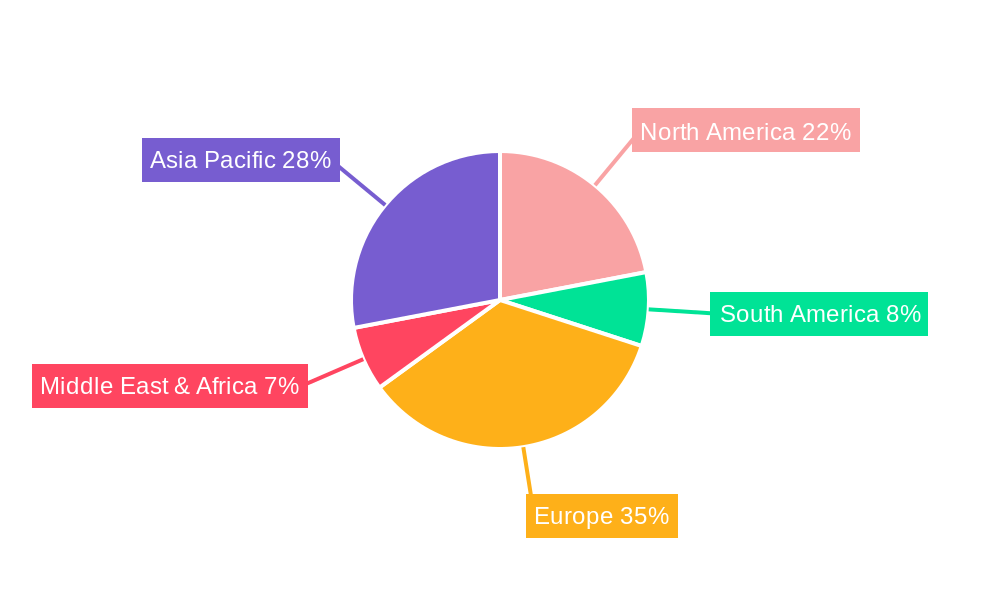
The prevailing recycling technologies, namely Mechanical Recycling and Pyrolysis Recycling, are expected to dominate the market in the near term, offering scalable and cost-efficient solutions. While Chemical Recycling is still in its nascent stages, it presents a promising avenue for higher-value material recovery and is anticipated to gain traction as technology matures. Geographically, Europe is currently a leading region in wind turbine blade recycling, driven by stringent environmental policies and a mature wind energy sector. Asia Pacific, particularly China and India, is expected to witness substantial growth, owing to aggressive wind energy installations and government support for circular economy initiatives. Key players like Veolia, Carbon Rivers, and Stena Recycling AB are actively investing in R&D and expanding their recycling capacities to cater to this burgeoning demand. Restraints include the high logistical costs associated with transporting bulky blades and the technical challenges associated with processing composite materials efficiently.
Wind Turbine Blade Recycling Service Market Dynamics & Structure
The global wind turbine blade recycling service market is characterized by a moderately concentrated structure, driven by the increasing need for sustainable disposal solutions for decommissioned wind turbine blades. Technological innovation is a key driver, with ongoing research and development focused on improving the efficiency and cost-effectiveness of various recycling methods. Regulatory frameworks are gradually tightening, compelling manufacturers and operators to adopt responsible end-of-life management practices. Competitive product substitutes include landfilling and incineration, though these are becoming less viable due to environmental concerns and regulatory pressures. End-user demographics are primarily wind farm operators and turbine manufacturers, with growing interest from the cement and packaging industries seeking recycled composite materials. Mergers and acquisitions (M&A) are emerging as a trend, with established waste management companies and specialized recycling firms seeking to expand their capabilities and market reach.
- Market Concentration: Moderately concentrated, with key players like Veolia and Carbon Rivers holding significant shares.
- Technological Innovation Drivers: Development of advanced pyrolysis and chemical recycling techniques to recover valuable materials like carbon fiber and resins.
- Regulatory Frameworks: Increasing government mandates for waste reduction and circular economy principles impacting blade disposal.
- Competitive Product Substitutes: Landfilling (declining due to environmental impact), incineration (limited material recovery).
- End-User Demographics: Wind farm operators, turbine manufacturers, cement industry, and packaging sector.
- M&A Trends: Consolidation to gain economies of scale and technological expertise.
Wind Turbine Blade Recycling Service Growth Trends & Insights
The wind turbine blade recycling service market is poised for substantial expansion, driven by the escalating volume of decommissioned blades and a global shift towards sustainable energy practices. The market size, valued at approximately $500 million in 2025, is projected to reach over $1,800 million by 2033, exhibiting a robust Compound Annual Growth Rate (CAGR) of around 15.5% during the forecast period of 2025–2033. Adoption rates of specialized recycling services are accelerating as awareness of the environmental impact of landfilling blades grows. Technological disruptions are a significant factor, with innovations in mechanical, pyrolysis, and chemical recycling methods unlocking new avenues for material recovery and valorization. Consumer behavior shifts, influenced by corporate sustainability goals and public demand for eco-friendly solutions, are further propelling the market. The increasing lifespan of wind turbines, coupled with the rapid deployment of new wind farms, creates a continuous pipeline of end-of-life blades, ensuring sustained demand for recycling services. Early adoption of these services by leading wind energy companies is setting a precedent, encouraging laggards to invest in compliant and sustainable disposal strategies. The development of regional recycling hubs is also a key trend, reducing transportation costs and environmental footprints.
Dominant Regions, Countries, or Segments in Wind Turbine Blade Recycling Service
The Cement Industry segment is currently the dominant application driving growth in the wind turbine blade recycling service market. This dominance stems from the inherent properties of recycled wind turbine blade materials, particularly the composite fibers and resins, which can be effectively utilized as alternative fuel and raw material (AFR) in cement kilns. The high energy content of resins and the mineral content of fiberglass make them an attractive substitute for traditional fossil fuels and raw materials used in cement production, leading to significant cost savings and a reduced carbon footprint for cement manufacturers. Europe, with its mature wind energy sector and stringent environmental regulations, is a leading region, with countries like Germany, Denmark, and the UK pioneering the adoption of blade recycling solutions for the cement industry. The market share of the cement industry in the overall blade recycling market is estimated to be over 40% in 2025, with strong growth potential expected to continue.
- Application Dominance: Cement Industry - Over 40% market share in 2025, projected to grow significantly.
- Key Drivers in Cement Industry:
- Cost savings from substituting traditional fuels and raw materials.
- Reduced carbon footprint and enhanced sustainability credentials.
- Availability of suitable processing technologies for waste integration.
- Regional Leadership: Europe leads due to early adoption and regulatory push, with Germany and Denmark at the forefront.
- Growth Potential: Increasing demand for AFR in cement production globally.
- Other Contributing Segments: While the Cement Industry leads, Reuse and Other applications are also showing nascent growth.
Wind Turbine Blade Recycling Service Product Landscape
The product landscape for wind turbine blade recycling services is evolving rapidly, with innovations focused on efficient material recovery and the development of high-value end products. Mechanical recycling methods, while established, are being enhanced to process shredded materials into viable feedstock for new composite manufacturing or construction aggregates. Pyrolysis recycling is emerging as a key technology, capable of breaking down composite materials at high temperatures in the absence of oxygen, yielding oils, gases, and char that can be repurposed. Chemical recycling, though more complex, promises higher purity recovery of constituent materials like carbon fiber and resin monomers, enabling their reintegration into high-performance applications. The performance metrics are increasingly centered on recovery rates, material quality, and cost-effectiveness, with emerging applications in the automotive, aerospace, and construction sectors beyond the cement industry.
Key Drivers, Barriers & Challenges in Wind Turbine Blade Recycling Service
Key Drivers:
- Growing Volume of Decommissioned Blades: The sheer number of end-of-life blades necessitates sustainable disposal solutions, acting as a primary market driver.
- Environmental Regulations: Increasing governmental mandates and corporate sustainability goals push for responsible waste management, driving adoption of recycling services.
- Circular Economy Initiatives: The global push towards a circular economy encourages the recovery and reuse of valuable materials from waste streams.
- Technological Advancements: Innovations in recycling processes are making them more efficient and cost-effective, expanding their viability.
Barriers & Challenges:
- High Processing Costs: The complex composite nature of turbine blades makes recycling inherently more expensive than traditional waste disposal.
- Logistical Complexities: Transporting large, bulky blades to recycling facilities can be costly and logistically challenging.
- Lack of Standardized Recycling Processes: The absence of universally adopted and scalable recycling technologies hinders widespread adoption.
- Market Acceptance of Recycled Materials: Ensuring consistent quality and performance of recycled materials to meet industry standards remains a challenge.
- Supply Chain Volatility: The intermittent nature of blade decommissioning can lead to fluctuations in feedstock availability for recyclers.
Emerging Opportunities in Wind Turbine Blade Recycling Service
Emerging opportunities in the wind turbine blade recycling service sector lie in the development of advanced chemical recycling processes that yield high-purity materials like carbon fiber, opening doors for applications in high-value sectors such as aerospace and advanced manufacturing. The expansion of reuse applications, where blades are repurposed for infrastructure projects like bridges or sound barriers, presents another promising avenue. Furthermore, the development of localized recycling hubs within proximity to major wind farms can significantly reduce logistical costs and environmental impact. Increased collaboration between turbine manufacturers, wind farm operators, and recycling companies to design for recyclability is also a critical emerging opportunity, fostering a more circular and sustainable lifecycle for wind energy infrastructure.
Growth Accelerators in the Wind Turbine Blade Recycling Service Industry
Growth accelerators in the wind turbine blade recycling service industry are multi-faceted. Key among them is the continuous innovation in recycling technologies, particularly in chemical and advanced mechanical processes that enhance material recovery rates and quality. Strategic partnerships between turbine manufacturers and specialized recycling firms are crucial for establishing reliable feedstock supply chains and developing integrated end-of-life solutions. Market expansion into developing regions with growing wind energy installations, coupled with the establishment of supportive regulatory frameworks, will also significantly fuel growth. The increasing focus on the circular economy by global corporations and governments will continue to drive demand for sustainable waste management solutions, positioning blade recycling as a vital component of the renewable energy ecosystem.
Key Players Shaping the Wind Turbine Blade Recycling Service Market
- Veolia
- Carbon Rivers
- HJHansen Recycling Group
- Stena Recycling AB
- Eurecum
- ANMET
- Longjin
- Zaisheng
- Fengnuo
- Chengde Yanshen
- Enva
- LM Wind Power
- Iberdrola
Notable Milestones in Wind Turbine Blade Recycling Service Sector
- 2019: First commercial-scale mechanical recycling plant for wind turbine blades established in Europe.
- 2020: LM Wind Power announces a commitment to designing blades for recyclability.
- 2021: Carbon Rivers secures significant funding to scale up its pyrolysis recycling technology.
- 2022: Veolia expands its wind turbine blade recycling capabilities across multiple European countries.
- 2023: Iberdrola partners with a leading recycler to manage end-of-life blades from its global fleet.
- 2024: Development of advanced chemical recycling processes begins to yield high-purity carbon fiber.
In-Depth Wind Turbine Blade Recycling Service Market Outlook
The outlook for the wind turbine blade recycling service market is exceptionally positive, driven by the inevitable increase in decommissioned blades and a global imperative for sustainable industrial practices. Growth accelerators such as ongoing technological breakthroughs in material recovery, coupled with strategic alliances between key industry stakeholders, will solidify the market's expansion trajectory. The increasing global focus on the circular economy and stringent environmental regulations further bolster demand for responsible end-of-life management solutions. As the wind energy sector matures, investing in efficient and scalable blade recycling will not only address environmental concerns but also unlock economic value by transforming waste into valuable resources for diverse industrial applications, ensuring a sustainable future for renewable energy.
Wind Turbine Blade Recycling Service Segmentation
-
1. Application
- 1.1. Cement Industry
- 1.2. Packaging Industry
- 1.3. Reuse
- 1.4. Other
-
2. Types
- 2.1. Mechanical Recycling
- 2.2. Pyrolysis Recycling
- 2.3. Chemical Recycling
Wind Turbine Blade Recycling Service Segmentation By Geography
-
1. North America
- 1.1. United States
- 1.2. Canada
- 1.3. Mexico
-
2. South America
- 2.1. Brazil
- 2.2. Argentina
- 2.3. Rest of South America
-
3. Europe
- 3.1. United Kingdom
- 3.2. Germany
- 3.3. France
- 3.4. Italy
- 3.5. Spain
- 3.6. Russia
- 3.7. Benelux
- 3.8. Nordics
- 3.9. Rest of Europe
-
4. Middle East & Africa
- 4.1. Turkey
- 4.2. Israel
- 4.3. GCC
- 4.4. North Africa
- 4.5. South Africa
- 4.6. Rest of Middle East & Africa
-
5. Asia Pacific
- 5.1. China
- 5.2. India
- 5.3. Japan
- 5.4. South Korea
- 5.5. ASEAN
- 5.6. Oceania
- 5.7. Rest of Asia Pacific
Wind Turbine Blade Recycling Service REPORT HIGHLIGHTS
| Aspects | Details |
|---|---|
| Study Period | 2019-2033 |
| Base Year | 2024 |
| Estimated Year | 2025 |
| Forecast Period | 2025-2033 |
| Historical Period | 2019-2024 |
| Growth Rate | CAGR of XX% from 2019-2033 |
| Segmentation |
|
Table of Contents
- 1. Introduction
- 1.1. Research Scope
- 1.2. Market Segmentation
- 1.3. Research Methodology
- 1.4. Definitions and Assumptions
- 2. Executive Summary
- 2.1. Introduction
- 3. Market Dynamics
- 3.1. Introduction
- 3.2. Market Drivers
- 3.3. Market Restrains
- 3.4. Market Trends
- 4. Market Factor Analysis
- 4.1. Porters Five Forces
- 4.2. Supply/Value Chain
- 4.3. PESTEL analysis
- 4.4. Market Entropy
- 4.5. Patent/Trademark Analysis
- 5. Global Wind Turbine Blade Recycling Service Analysis, Insights and Forecast, 2019-2031
- 5.1. Market Analysis, Insights and Forecast - by Application
- 5.1.1. Cement Industry
- 5.1.2. Packaging Industry
- 5.1.3. Reuse
- 5.1.4. Other
- 5.2. Market Analysis, Insights and Forecast - by Types
- 5.2.1. Mechanical Recycling
- 5.2.2. Pyrolysis Recycling
- 5.2.3. Chemical Recycling
- 5.3. Market Analysis, Insights and Forecast - by Region
- 5.3.1. North America
- 5.3.2. South America
- 5.3.3. Europe
- 5.3.4. Middle East & Africa
- 5.3.5. Asia Pacific
- 5.1. Market Analysis, Insights and Forecast - by Application
- 6. North America Wind Turbine Blade Recycling Service Analysis, Insights and Forecast, 2019-2031
- 6.1. Market Analysis, Insights and Forecast - by Application
- 6.1.1. Cement Industry
- 6.1.2. Packaging Industry
- 6.1.3. Reuse
- 6.1.4. Other
- 6.2. Market Analysis, Insights and Forecast - by Types
- 6.2.1. Mechanical Recycling
- 6.2.2. Pyrolysis Recycling
- 6.2.3. Chemical Recycling
- 6.1. Market Analysis, Insights and Forecast - by Application
- 7. South America Wind Turbine Blade Recycling Service Analysis, Insights and Forecast, 2019-2031
- 7.1. Market Analysis, Insights and Forecast - by Application
- 7.1.1. Cement Industry
- 7.1.2. Packaging Industry
- 7.1.3. Reuse
- 7.1.4. Other
- 7.2. Market Analysis, Insights and Forecast - by Types
- 7.2.1. Mechanical Recycling
- 7.2.2. Pyrolysis Recycling
- 7.2.3. Chemical Recycling
- 7.1. Market Analysis, Insights and Forecast - by Application
- 8. Europe Wind Turbine Blade Recycling Service Analysis, Insights and Forecast, 2019-2031
- 8.1. Market Analysis, Insights and Forecast - by Application
- 8.1.1. Cement Industry
- 8.1.2. Packaging Industry
- 8.1.3. Reuse
- 8.1.4. Other
- 8.2. Market Analysis, Insights and Forecast - by Types
- 8.2.1. Mechanical Recycling
- 8.2.2. Pyrolysis Recycling
- 8.2.3. Chemical Recycling
- 8.1. Market Analysis, Insights and Forecast - by Application
- 9. Middle East & Africa Wind Turbine Blade Recycling Service Analysis, Insights and Forecast, 2019-2031
- 9.1. Market Analysis, Insights and Forecast - by Application
- 9.1.1. Cement Industry
- 9.1.2. Packaging Industry
- 9.1.3. Reuse
- 9.1.4. Other
- 9.2. Market Analysis, Insights and Forecast - by Types
- 9.2.1. Mechanical Recycling
- 9.2.2. Pyrolysis Recycling
- 9.2.3. Chemical Recycling
- 9.1. Market Analysis, Insights and Forecast - by Application
- 10. Asia Pacific Wind Turbine Blade Recycling Service Analysis, Insights and Forecast, 2019-2031
- 10.1. Market Analysis, Insights and Forecast - by Application
- 10.1.1. Cement Industry
- 10.1.2. Packaging Industry
- 10.1.3. Reuse
- 10.1.4. Other
- 10.2. Market Analysis, Insights and Forecast - by Types
- 10.2.1. Mechanical Recycling
- 10.2.2. Pyrolysis Recycling
- 10.2.3. Chemical Recycling
- 10.1. Market Analysis, Insights and Forecast - by Application
- 11. Competitive Analysis
- 11.1. Global Market Share Analysis 2024
- 11.2. Company Profiles
- 11.2.1 Veolia
- 11.2.1.1. Overview
- 11.2.1.2. Products
- 11.2.1.3. SWOT Analysis
- 11.2.1.4. Recent Developments
- 11.2.1.5. Financials (Based on Availability)
- 11.2.2 Carbon Rivers
- 11.2.2.1. Overview
- 11.2.2.2. Products
- 11.2.2.3. SWOT Analysis
- 11.2.2.4. Recent Developments
- 11.2.2.5. Financials (Based on Availability)
- 11.2.3 HJHansen Recycling Group
- 11.2.3.1. Overview
- 11.2.3.2. Products
- 11.2.3.3. SWOT Analysis
- 11.2.3.4. Recent Developments
- 11.2.3.5. Financials (Based on Availability)
- 11.2.4 Stena Recycling AB
- 11.2.4.1. Overview
- 11.2.4.2. Products
- 11.2.4.3. SWOT Analysis
- 11.2.4.4. Recent Developments
- 11.2.4.5. Financials (Based on Availability)
- 11.2.5 Eurecum
- 11.2.5.1. Overview
- 11.2.5.2. Products
- 11.2.5.3. SWOT Analysis
- 11.2.5.4. Recent Developments
- 11.2.5.5. Financials (Based on Availability)
- 11.2.6 ANMET
- 11.2.6.1. Overview
- 11.2.6.2. Products
- 11.2.6.3. SWOT Analysis
- 11.2.6.4. Recent Developments
- 11.2.6.5. Financials (Based on Availability)
- 11.2.7 Longjin
- 11.2.7.1. Overview
- 11.2.7.2. Products
- 11.2.7.3. SWOT Analysis
- 11.2.7.4. Recent Developments
- 11.2.7.5. Financials (Based on Availability)
- 11.2.8 Zaisheng
- 11.2.8.1. Overview
- 11.2.8.2. Products
- 11.2.8.3. SWOT Analysis
- 11.2.8.4. Recent Developments
- 11.2.8.5. Financials (Based on Availability)
- 11.2.9 Fengnuo
- 11.2.9.1. Overview
- 11.2.9.2. Products
- 11.2.9.3. SWOT Analysis
- 11.2.9.4. Recent Developments
- 11.2.9.5. Financials (Based on Availability)
- 11.2.10 Chengde Yanshen
- 11.2.10.1. Overview
- 11.2.10.2. Products
- 11.2.10.3. SWOT Analysis
- 11.2.10.4. Recent Developments
- 11.2.10.5. Financials (Based on Availability)
- 11.2.11 Enva
- 11.2.11.1. Overview
- 11.2.11.2. Products
- 11.2.11.3. SWOT Analysis
- 11.2.11.4. Recent Developments
- 11.2.11.5. Financials (Based on Availability)
- 11.2.12 LM Wind Power
- 11.2.12.1. Overview
- 11.2.12.2. Products
- 11.2.12.3. SWOT Analysis
- 11.2.12.4. Recent Developments
- 11.2.12.5. Financials (Based on Availability)
- 11.2.13 Iberdrola
- 11.2.13.1. Overview
- 11.2.13.2. Products
- 11.2.13.3. SWOT Analysis
- 11.2.13.4. Recent Developments
- 11.2.13.5. Financials (Based on Availability)
- 11.2.1 Veolia
List of Figures
- Figure 1: Global Wind Turbine Blade Recycling Service Revenue Breakdown (million, %) by Region 2024 & 2032
- Figure 2: North America Wind Turbine Blade Recycling Service Revenue (million), by Application 2024 & 2032
- Figure 3: North America Wind Turbine Blade Recycling Service Revenue Share (%), by Application 2024 & 2032
- Figure 4: North America Wind Turbine Blade Recycling Service Revenue (million), by Types 2024 & 2032
- Figure 5: North America Wind Turbine Blade Recycling Service Revenue Share (%), by Types 2024 & 2032
- Figure 6: North America Wind Turbine Blade Recycling Service Revenue (million), by Country 2024 & 2032
- Figure 7: North America Wind Turbine Blade Recycling Service Revenue Share (%), by Country 2024 & 2032
- Figure 8: South America Wind Turbine Blade Recycling Service Revenue (million), by Application 2024 & 2032
- Figure 9: South America Wind Turbine Blade Recycling Service Revenue Share (%), by Application 2024 & 2032
- Figure 10: South America Wind Turbine Blade Recycling Service Revenue (million), by Types 2024 & 2032
- Figure 11: South America Wind Turbine Blade Recycling Service Revenue Share (%), by Types 2024 & 2032
- Figure 12: South America Wind Turbine Blade Recycling Service Revenue (million), by Country 2024 & 2032
- Figure 13: South America Wind Turbine Blade Recycling Service Revenue Share (%), by Country 2024 & 2032
- Figure 14: Europe Wind Turbine Blade Recycling Service Revenue (million), by Application 2024 & 2032
- Figure 15: Europe Wind Turbine Blade Recycling Service Revenue Share (%), by Application 2024 & 2032
- Figure 16: Europe Wind Turbine Blade Recycling Service Revenue (million), by Types 2024 & 2032
- Figure 17: Europe Wind Turbine Blade Recycling Service Revenue Share (%), by Types 2024 & 2032
- Figure 18: Europe Wind Turbine Blade Recycling Service Revenue (million), by Country 2024 & 2032
- Figure 19: Europe Wind Turbine Blade Recycling Service Revenue Share (%), by Country 2024 & 2032
- Figure 20: Middle East & Africa Wind Turbine Blade Recycling Service Revenue (million), by Application 2024 & 2032
- Figure 21: Middle East & Africa Wind Turbine Blade Recycling Service Revenue Share (%), by Application 2024 & 2032
- Figure 22: Middle East & Africa Wind Turbine Blade Recycling Service Revenue (million), by Types 2024 & 2032
- Figure 23: Middle East & Africa Wind Turbine Blade Recycling Service Revenue Share (%), by Types 2024 & 2032
- Figure 24: Middle East & Africa Wind Turbine Blade Recycling Service Revenue (million), by Country 2024 & 2032
- Figure 25: Middle East & Africa Wind Turbine Blade Recycling Service Revenue Share (%), by Country 2024 & 2032
- Figure 26: Asia Pacific Wind Turbine Blade Recycling Service Revenue (million), by Application 2024 & 2032
- Figure 27: Asia Pacific Wind Turbine Blade Recycling Service Revenue Share (%), by Application 2024 & 2032
- Figure 28: Asia Pacific Wind Turbine Blade Recycling Service Revenue (million), by Types 2024 & 2032
- Figure 29: Asia Pacific Wind Turbine Blade Recycling Service Revenue Share (%), by Types 2024 & 2032
- Figure 30: Asia Pacific Wind Turbine Blade Recycling Service Revenue (million), by Country 2024 & 2032
- Figure 31: Asia Pacific Wind Turbine Blade Recycling Service Revenue Share (%), by Country 2024 & 2032
List of Tables
- Table 1: Global Wind Turbine Blade Recycling Service Revenue million Forecast, by Region 2019 & 2032
- Table 2: Global Wind Turbine Blade Recycling Service Revenue million Forecast, by Application 2019 & 2032
- Table 3: Global Wind Turbine Blade Recycling Service Revenue million Forecast, by Types 2019 & 2032
- Table 4: Global Wind Turbine Blade Recycling Service Revenue million Forecast, by Region 2019 & 2032
- Table 5: Global Wind Turbine Blade Recycling Service Revenue million Forecast, by Application 2019 & 2032
- Table 6: Global Wind Turbine Blade Recycling Service Revenue million Forecast, by Types 2019 & 2032
- Table 7: Global Wind Turbine Blade Recycling Service Revenue million Forecast, by Country 2019 & 2032
- Table 8: United States Wind Turbine Blade Recycling Service Revenue (million) Forecast, by Application 2019 & 2032
- Table 9: Canada Wind Turbine Blade Recycling Service Revenue (million) Forecast, by Application 2019 & 2032
- Table 10: Mexico Wind Turbine Blade Recycling Service Revenue (million) Forecast, by Application 2019 & 2032
- Table 11: Global Wind Turbine Blade Recycling Service Revenue million Forecast, by Application 2019 & 2032
- Table 12: Global Wind Turbine Blade Recycling Service Revenue million Forecast, by Types 2019 & 2032
- Table 13: Global Wind Turbine Blade Recycling Service Revenue million Forecast, by Country 2019 & 2032
- Table 14: Brazil Wind Turbine Blade Recycling Service Revenue (million) Forecast, by Application 2019 & 2032
- Table 15: Argentina Wind Turbine Blade Recycling Service Revenue (million) Forecast, by Application 2019 & 2032
- Table 16: Rest of South America Wind Turbine Blade Recycling Service Revenue (million) Forecast, by Application 2019 & 2032
- Table 17: Global Wind Turbine Blade Recycling Service Revenue million Forecast, by Application 2019 & 2032
- Table 18: Global Wind Turbine Blade Recycling Service Revenue million Forecast, by Types 2019 & 2032
- Table 19: Global Wind Turbine Blade Recycling Service Revenue million Forecast, by Country 2019 & 2032
- Table 20: United Kingdom Wind Turbine Blade Recycling Service Revenue (million) Forecast, by Application 2019 & 2032
- Table 21: Germany Wind Turbine Blade Recycling Service Revenue (million) Forecast, by Application 2019 & 2032
- Table 22: France Wind Turbine Blade Recycling Service Revenue (million) Forecast, by Application 2019 & 2032
- Table 23: Italy Wind Turbine Blade Recycling Service Revenue (million) Forecast, by Application 2019 & 2032
- Table 24: Spain Wind Turbine Blade Recycling Service Revenue (million) Forecast, by Application 2019 & 2032
- Table 25: Russia Wind Turbine Blade Recycling Service Revenue (million) Forecast, by Application 2019 & 2032
- Table 26: Benelux Wind Turbine Blade Recycling Service Revenue (million) Forecast, by Application 2019 & 2032
- Table 27: Nordics Wind Turbine Blade Recycling Service Revenue (million) Forecast, by Application 2019 & 2032
- Table 28: Rest of Europe Wind Turbine Blade Recycling Service Revenue (million) Forecast, by Application 2019 & 2032
- Table 29: Global Wind Turbine Blade Recycling Service Revenue million Forecast, by Application 2019 & 2032
- Table 30: Global Wind Turbine Blade Recycling Service Revenue million Forecast, by Types 2019 & 2032
- Table 31: Global Wind Turbine Blade Recycling Service Revenue million Forecast, by Country 2019 & 2032
- Table 32: Turkey Wind Turbine Blade Recycling Service Revenue (million) Forecast, by Application 2019 & 2032
- Table 33: Israel Wind Turbine Blade Recycling Service Revenue (million) Forecast, by Application 2019 & 2032
- Table 34: GCC Wind Turbine Blade Recycling Service Revenue (million) Forecast, by Application 2019 & 2032
- Table 35: North Africa Wind Turbine Blade Recycling Service Revenue (million) Forecast, by Application 2019 & 2032
- Table 36: South Africa Wind Turbine Blade Recycling Service Revenue (million) Forecast, by Application 2019 & 2032
- Table 37: Rest of Middle East & Africa Wind Turbine Blade Recycling Service Revenue (million) Forecast, by Application 2019 & 2032
- Table 38: Global Wind Turbine Blade Recycling Service Revenue million Forecast, by Application 2019 & 2032
- Table 39: Global Wind Turbine Blade Recycling Service Revenue million Forecast, by Types 2019 & 2032
- Table 40: Global Wind Turbine Blade Recycling Service Revenue million Forecast, by Country 2019 & 2032
- Table 41: China Wind Turbine Blade Recycling Service Revenue (million) Forecast, by Application 2019 & 2032
- Table 42: India Wind Turbine Blade Recycling Service Revenue (million) Forecast, by Application 2019 & 2032
- Table 43: Japan Wind Turbine Blade Recycling Service Revenue (million) Forecast, by Application 2019 & 2032
- Table 44: South Korea Wind Turbine Blade Recycling Service Revenue (million) Forecast, by Application 2019 & 2032
- Table 45: ASEAN Wind Turbine Blade Recycling Service Revenue (million) Forecast, by Application 2019 & 2032
- Table 46: Oceania Wind Turbine Blade Recycling Service Revenue (million) Forecast, by Application 2019 & 2032
- Table 47: Rest of Asia Pacific Wind Turbine Blade Recycling Service Revenue (million) Forecast, by Application 2019 & 2032
Frequently Asked Questions
1. What is the projected Compound Annual Growth Rate (CAGR) of the Wind Turbine Blade Recycling Service?
The projected CAGR is approximately XX%.
2. Which companies are prominent players in the Wind Turbine Blade Recycling Service?
Key companies in the market include Veolia, Carbon Rivers, HJHansen Recycling Group, Stena Recycling AB, Eurecum, ANMET, Longjin, Zaisheng, Fengnuo, Chengde Yanshen, Enva, LM Wind Power, Iberdrola.
3. What are the main segments of the Wind Turbine Blade Recycling Service?
The market segments include Application, Types.
4. Can you provide details about the market size?
The market size is estimated to be USD XXX million as of 2022.
5. What are some drivers contributing to market growth?
N/A
6. What are the notable trends driving market growth?
N/A
7. Are there any restraints impacting market growth?
N/A
8. Can you provide examples of recent developments in the market?
N/A
9. What pricing options are available for accessing the report?
Pricing options include single-user, multi-user, and enterprise licenses priced at USD 4350.00, USD 6525.00, and USD 8700.00 respectively.
10. Is the market size provided in terms of value or volume?
The market size is provided in terms of value, measured in million.
11. Are there any specific market keywords associated with the report?
Yes, the market keyword associated with the report is "Wind Turbine Blade Recycling Service," which aids in identifying and referencing the specific market segment covered.
12. How do I determine which pricing option suits my needs best?
The pricing options vary based on user requirements and access needs. Individual users may opt for single-user licenses, while businesses requiring broader access may choose multi-user or enterprise licenses for cost-effective access to the report.
13. Are there any additional resources or data provided in the Wind Turbine Blade Recycling Service report?
While the report offers comprehensive insights, it's advisable to review the specific contents or supplementary materials provided to ascertain if additional resources or data are available.
14. How can I stay updated on further developments or reports in the Wind Turbine Blade Recycling Service?
To stay informed about further developments, trends, and reports in the Wind Turbine Blade Recycling Service, consider subscribing to industry newsletters, following relevant companies and organizations, or regularly checking reputable industry news sources and publications.
Methodology
Step 1 - Identification of Relevant Samples Size from Population Database


Step 2 - Approaches for Defining Global Market Size (Value, Volume* & Price*)

Note*: In applicable scenarios
Step 3 - Data Sources
Primary Research
- Web Analytics
- Survey Reports
- Research Institute
- Latest Research Reports
- Opinion Leaders
Secondary Research
- Annual Reports
- White Paper
- Latest Press Release
- Industry Association
- Paid Database
- Investor Presentations

Step 4 - Data Triangulation
Involves using different sources of information in order to increase the validity of a study
These sources are likely to be stakeholders in a program - participants, other researchers, program staff, other community members, and so on.
Then we put all data in single framework & apply various statistical tools to find out the dynamic on the market.
During the analysis stage, feedback from the stakeholder groups would be compared to determine areas of agreement as well as areas of divergence
