

Key Insights
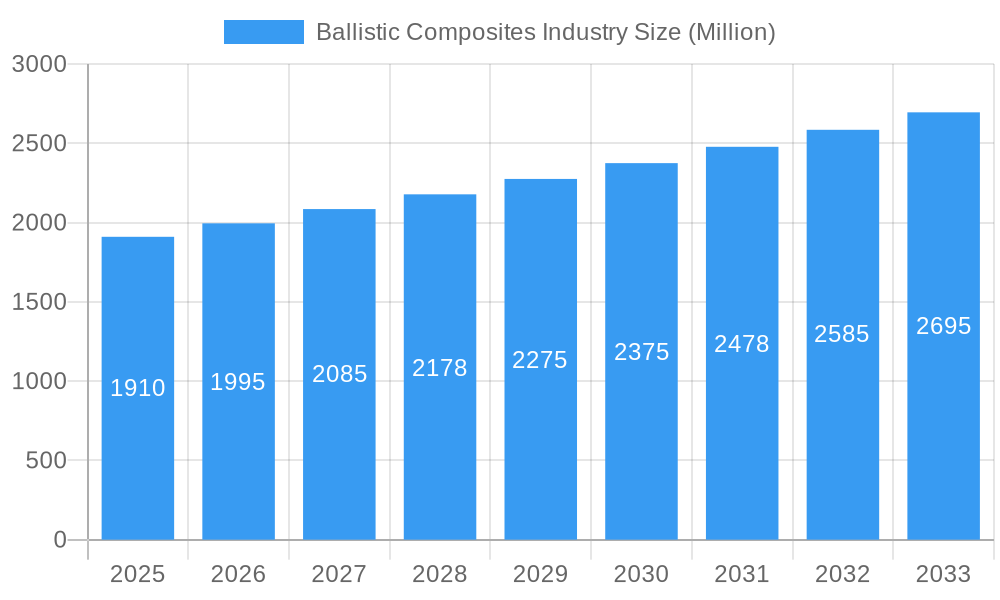
The global Ballistic Composites industry is poised for significant expansion, projected to reach approximately $1.91 billion in market size, with a Compound Annual Growth Rate (CAGR) exceeding 4.00% through the forecast period of 2025-2033. This robust growth is primarily fueled by the escalating demand for advanced protection solutions across defense, law enforcement, and civilian sectors. The increasing geopolitical tensions and the continuous threat of terrorism worldwide are compelling governments and private entities to invest heavily in superior ballistic materials for vehicle armor, body armor, and protective headgear. Furthermore, advancements in material science, leading to the development of lighter, stronger, and more cost-effective composite materials like Aramids and Ultra-high-molecular-weight Polyethylene (UHMWPE), are key drivers. These materials offer enhanced performance over traditional armor, enabling greater mobility and survivability for end-users. The market is also seeing a surge in innovation within matrix types, with polymer-ceramic and metal matrix composites gaining traction for their improved impact resistance and thermal stability.
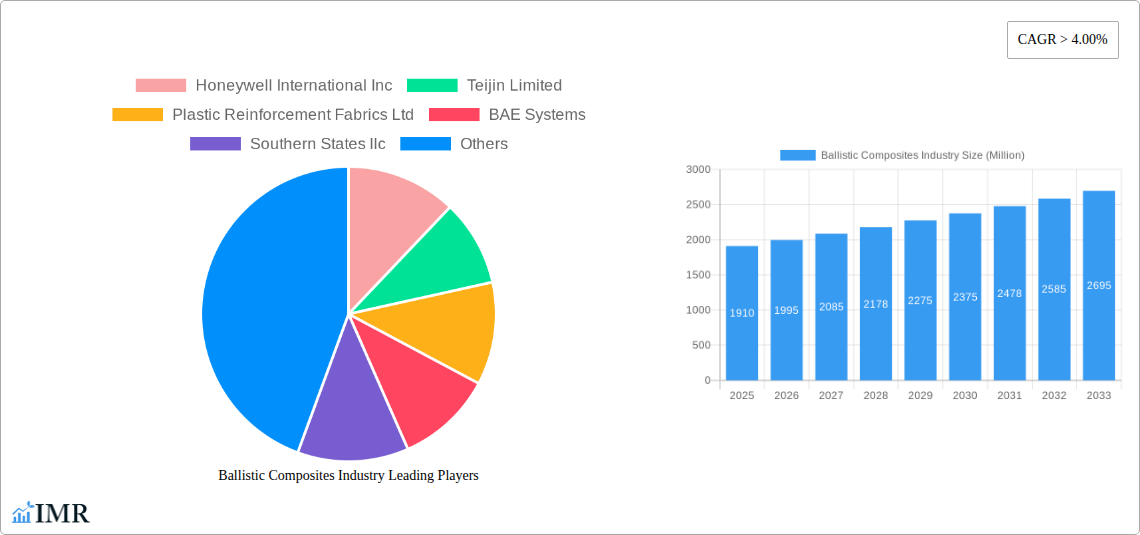
Ballistic Composites Industry Market Size (In Billion)
The market's trajectory is further shaped by emerging trends such as the integration of nanotechnology into ballistic composites for enhanced strength and reduced weight, and the growing adoption of these materials in commercial aviation and automotive industries for improved safety features. However, the industry faces certain restraints, including the high cost of raw materials and the complex manufacturing processes involved in producing high-performance ballistic composites. Regulatory compliance and the need for stringent testing and certification also present hurdles. Despite these challenges, the increasing focus on personal safety and the ongoing modernization of military and security forces globally are expected to sustain strong market growth. Key players like Honeywell International Inc., Teijin Limited, and DuPont are at the forefront of this evolution, investing in research and development to offer cutting-edge ballistic composite solutions that meet the evolving security needs of a dynamic world.
Ballistic Composites Industry Company Market Share
Unveiling the Ballistic Composites Industry: A Comprehensive Market Analysis 2024-2033
This in-depth report provides an exhaustive examination of the global Ballistic Composites market, offering critical insights into market dynamics, growth trajectories, and key players. Designed for industry professionals, defense strategists, material scientists, and investors, this report leverages high-traffic keywords and analyzes parent and child markets to deliver unparalleled market intelligence. The study period spans from 2019 to 2033, with a base year of 2025 and a forecast period extending from 2025 to 2033, covering the historical period of 2019-2024. All quantitative values are presented in Million Units.
Ballistic Composites Industry Market Dynamics & Structure
The ballistic composites market is characterized by a moderately concentrated structure, with key players like Honeywell International Inc., Teijin Limited, and BAE Systems holding significant market shares. Technological innovation is a primary driver, fueled by ongoing R&D in advanced fiber technologies and matrix materials aimed at enhancing ballistic protection while reducing weight. Regulatory frameworks, particularly stringent standards for defense and law enforcement applications, shape product development and market entry. Competitive product substitutes, such as traditional metal armors, are being increasingly displaced by the superior strength-to-weight ratio of composites. End-user demographics are shifting towards greater demand for lightweight, flexible, and custom-fit solutions in both military and civilian applications. Mergers and acquisitions (M&A) are a notable trend, with companies consolidating to expand their product portfolios and geographical reach. For instance, the acquisition of smaller specialized composite manufacturers by larger defense contractors is a recurring theme, aiming to secure critical supply chains and proprietary technologies. Innovation barriers include the high cost of raw materials, lengthy qualification processes for defense applications, and the need for specialized manufacturing expertise.
Ballistic Composites Industry Growth Trends & Insights
The ballistic composites market is poised for robust growth, driven by escalating global security concerns and the continuous need for advanced protection solutions. The market size is projected to witness a Compound Annual Growth Rate (CAGR) of approximately 7.2% from 2025 to 2033. This growth is underpinned by increasing adoption rates in vehicle armor, body armor, and helmet and face protection segments. Technological disruptions, such as the development of novel composite architectures and advanced ceramic integration, are creating lighter, more effective armor systems. Consumer behavior shifts are evident, with a growing preference for integrated solutions that offer enhanced mobility and comfort without compromising protection. The increasing demand for lightweight ballistic solutions in the automotive sector for passenger safety, and in the aerospace industry for structural integrity, also contributes significantly to market expansion. The proliferation of asymmetric threats and the rise of non-state actors necessitate sophisticated and adaptable protective gear, further accelerating the adoption of ballistic composites. Market penetration in emerging economies, driven by defense modernization programs and internal security needs, presents a substantial growth avenue. The integration of smart technologies within ballistic composites, enabling real-time threat detection and performance monitoring, represents a future frontier in market evolution.
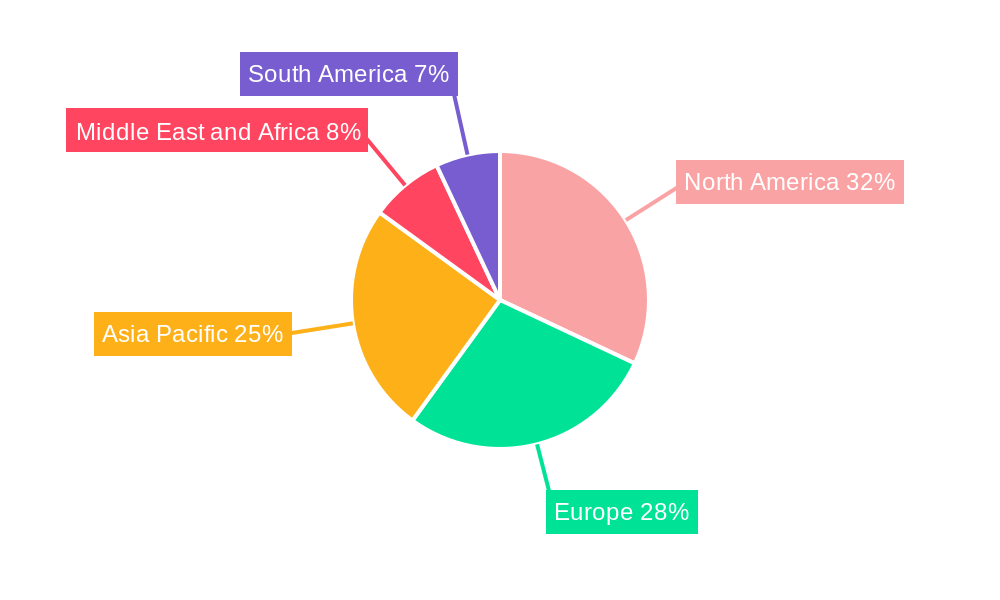
Dominant Regions, Countries, or Segments in Ballistic Composites Industry
The North America region is currently the dominant force in the global ballistic composites market, driven by substantial government investments in defense and homeland security, robust research and development infrastructure, and the presence of leading manufacturers. Within North America, the United States spearheads this dominance, accounting for a significant portion of the market share, estimated at 45% in 2025. The continuous deployment of advanced materials in military vehicles and personal protective equipment for its armed forces and law enforcement agencies fuels this leadership.
Key Drivers of Dominance in North America:
- Government Spending: Significant and consistent defense budgets allocated by the U.S. government for advanced combat systems and soldier protection.
- Technological Advancements: The presence of world-leading research institutions and private companies dedicated to developing cutting-edge ballistic composite materials and manufacturing processes.
- Demand for Personal Protective Equipment (PPE): High demand from law enforcement agencies, emergency responders, and security personnel for advanced body armor and helmet solutions.
- Vehicle Armor Applications: Extensive use of ballistic composites in military vehicles, including armored personnel carriers, tanks, and tactical trucks, to enhance survivability.
From the Fiber Type perspective, Ultra-high-molecular Weight Polyethylene (UHMWPE) is a leading segment, projected to hold an estimated market share of 38% in 2025. Its exceptional strength-to-weight ratio, flexibility, and resistance to abrasion make it ideal for a wide array of ballistic applications, particularly in body armor and vehicle protection.
Key Drivers for UHMWPE Dominance:
- Lightweight Protection: Offers superior ballistic performance compared to traditional materials at a significantly lower weight, crucial for mobility and reducing soldier fatigue.
- Flexibility and Comfort: Enables the creation of more comfortable and less restrictive body armor systems.
- Durability and Resistance: Exhibits excellent resistance to chemicals, moisture, and UV radiation, ensuring long-term performance.
- Versatility: Applicable in various forms, including woven fabrics, unidirectional tapes, and non-woven structures, catering to diverse application needs.
The Application segment of Body Armor is also a major growth driver, estimated to capture 35% of the market in 2025. The ongoing global need for enhanced soldier and law enforcement protection against an evolving threat landscape directly translates to a sustained demand for advanced ballistic vests and related protective gear.
Key Drivers for Body Armor Dominance:
- Persistent Security Threats: The rise of terrorism, civil unrest, and asymmetric warfare necessitates constant upgrades and widespread distribution of advanced body armor.
- Law Enforcement Modernization: Police forces worldwide are increasingly equipping officers with advanced ballistic protection to mitigate risks in high-threat situations.
- Technological Integration: The incorporation of advanced composite materials and design innovations to achieve superior protection with reduced bulk and increased comfort.
- Cost-Effectiveness: While initial costs can be high, the long-term benefits of reduced injury and mortality contribute to the perceived value and adoption of these solutions.
Ballistic Composites Industry Product Landscape
The ballistic composites industry is defined by a relentless pursuit of lighter, stronger, and more versatile protective solutions. Innovations are centered on enhancing material performance through advanced fiber technologies like aramids and UHMWPE, often integrated with novel polymer and polymer-ceramic matrix systems to achieve superior ballistic impact absorption and spall containment. Applications span critical defense and security sectors, including advanced vehicle armor systems offering enhanced blast resistance and protection against high-caliber threats, and next-generation body armor that prioritizes wearer mobility and comfort without compromising safety. Helmet and face protection also benefit from these advancements, providing enhanced cranial and facial safeguarding. Key product differentiators include multi-hit capabilities, resistance to environmental degradation, and customizable protection levels tailored to specific mission requirements.
Key Drivers, Barriers & Challenges in Ballistic Composites Industry
The primary forces propelling the ballistic composites market include the escalating global threat landscape, demanding enhanced personal and vehicular protection. Technological advancements in material science, particularly in fiber strength and matrix resilience, are crucial drivers. Government procurement policies and defense modernization programs in key regions significantly boost demand.
Key Drivers:
- Increasing geopolitical instability and terrorism threats.
- Advancements in UHMWPE and aramid fiber production.
- Demand for lightweight and high-performance armor solutions.
- Defense budget allocations for advanced protective equipment.
Key Challenges & Restraints:
- High Raw Material Costs: The expensive nature of advanced fibers and resins impacts the overall cost of ballistic composite products.
- Stringent Certification and Testing Standards: The rigorous qualification processes for defense and law enforcement applications can be time-consuming and costly, acting as a barrier to entry for new players.
- Supply Chain Vulnerabilities: Reliance on specific raw material suppliers and potential disruptions in global supply chains can impact production timelines and costs.
- Competition from Traditional Materials: While diminishing, some applications may still favor traditional materials due to cost or specific performance characteristics.
Emerging Opportunities in Ballistic Composites Industry
Emerging opportunities lie in the development of adaptive and smart ballistic composites that can dynamically respond to threats, integrating sensors and responsive materials. The expansion of the market into civilian applications, such as personal security for VIPs and high-risk professions, presents untapped potential. Further innovation in hybrid composite structures, combining different fiber types and matrix materials to optimize performance and cost, is also a promising avenue. The increasing focus on sustainability in material sourcing and end-of-life management for composite structures will also drive new opportunities in eco-friendly ballistic solutions.
Growth Accelerators in the Ballistic Composites Industry Industry
Long-term growth in the ballistic composites industry will be significantly accelerated by continuous investment in research and development, leading to breakthrough material properties and manufacturing efficiencies. Strategic partnerships between material manufacturers, armor system integrators, and end-users (military and law enforcement agencies) will foster collaborative innovation and expedite product deployment. Market expansion into emerging economies, driven by their growing defense modernization efforts and internal security needs, will unlock substantial new demand. The development of standardized testing protocols and certifications will also streamline market entry and adoption.
Key Players Shaping the Ballistic Composites Industry Market
- Honeywell International Inc.
- Teijin Limited
- Plastic Reinforcement Fabrics Ltd
- BAE Systems
- Southern States llc
- Roihu Inc
- Barrday Inc
- TenCate Protective Fabrics
- MKU LIMITED
- Coherent Corp
- Integris
- Morgan Advanced Materials
- DSM
- DuPont
- Gaffco Ballistics
- Gurit Holding AG
- ArmorCore
Notable Milestones in Ballistic Composites Industry Sector
- November 2023: Integris Composites developed a new system of ballistic vest gear for law enforcement and military units, launching the company’s new Rapid Don/Doff body armor vests. This innovation dramatically reduces the time for donning and doffing one’s body armor rig by 50% or more.
- November 2023: Integris Composites launched customizable ballistic shields and vests, "Stand 5 F009", at Milipol Paris, showcasing a "make your own shield" concept.
In-Depth Ballistic Composites Industry Market Outlook
The future of the ballistic composites market is exceptionally promising, driven by sustained demand for advanced protection solutions and continuous technological innovation. Key growth accelerators include the development of lighter, more flexible, and multi-functional armor systems, catering to the evolving needs of defense and security forces. Strategic collaborations between industry leaders and research institutions will pave the way for next-generation materials and manufacturing techniques. The increasing emphasis on soldier survivability and force protection, coupled with modernization efforts in numerous countries, ensures a robust and expanding market for ballistic composites, presenting significant opportunities for both established players and innovative newcomers.
Ballistic Composites Industry Segmentation
-
1. Fiber Type
- 1.1. Aramids
- 1.2. Ultra-high-molecular Weight Polyethylene (UHMWPE)
- 1.3. S-glass
- 1.4. Others F
-
2. Matrix Type
- 2.1. Polymer
- 2.2. Polymer-ceramic
- 2.3. Metal
-
3. Application
- 3.1. Vehicle Armor
- 3.2. Body Armor
- 3.3. Helmet and Face Protection
- 3.4. Other Ap
Ballistic Composites Industry Segmentation By Geography
-
1. Asia Pacific
- 1.1. China
- 1.2. India
- 1.3. Japan
- 1.4. South Korea
- 1.5. Rest of Asia Pacific
-
2. North America
- 2.1. United States
- 2.2. Canada
- 2.3. Mexico
-
3. Europe
- 3.1. Germany
- 3.2. United Kingdom
- 3.3. Italy
- 3.4. France
- 3.5. Spain
- 3.6. Rest of Europe
-
4. South America
- 4.1. Brazil
- 4.2. Argentina
- 4.3. Rest of South America
-
5. Middle East and Africa
- 5.1. Saudi Arabia
- 5.2. South Africa
- 5.3. Rest of Middle East and Africa
Ballistic Composites Industry Regional Market Share
Geographic Coverage of Ballistic Composites Industry
Ballistic Composites Industry REPORT HIGHLIGHTS
| Aspects | Details |
|---|---|
| Study Period | 2020-2034 |
| Base Year | 2025 |
| Estimated Year | 2026 |
| Forecast Period | 2026-2034 |
| Historical Period | 2020-2025 |
| Growth Rate | CAGR of > 4.00% from 2020-2034 |
| Segmentation |
|
Table of Contents
- 1. Introduction
- 1.1. Research Scope
- 1.2. Market Segmentation
- 1.3. Research Objective
- 1.4. Definitions and Assumptions
- 2. Executive Summary
- 2.1. Market Snapshot
- 3. Market Dynamics
- 3.1. Market Drivers
- 3.2. Market Restrains
- 3.3. Market Trends
- 3.4. Market Opportunities
- 4. Market Factor Analysis
- 4.1. Porters Five Forces
- 4.1.1. Bargaining Power of Suppliers
- 4.1.2. Bargaining Power of Buyers
- 4.1.3. Threat of New Entrants
- 4.1.4. Threat of Substitutes
- 4.1.5. Competitive Rivalry
- 4.2. PESTEL analysis
- 4.3. BCG Analysis
- 4.3.1. Stars (High Growth, High Market Share)
- 4.3.2. Cash Cows (Low Growth, High Market Share)
- 4.3.3. Question Mark (High Growth, Low Market Share)
- 4.3.4. Dogs (Low Growth, Low Market Share)
- 4.4. Ansoff Matrix Analysis
- 4.5. Supply Chain Analysis
- 4.6. Regulatory Landscape
- 4.7. Current Market Potential and Opportunity Assessment (TAM–SAM–SOM Framework)
- 4.8. IMR Analyst Note
- 4.1. Porters Five Forces
- 5. Market Analysis, Insights and Forecast 2021-2033
- 5.1. Market Analysis, Insights and Forecast - by Fiber Type
- 5.1.1. Aramids
- 5.1.2. Ultra-high-molecular Weight Polyethylene (UHMWPE)
- 5.1.3. S-glass
- 5.1.4. Others F
- 5.2. Market Analysis, Insights and Forecast - by Matrix Type
- 5.2.1. Polymer
- 5.2.2. Polymer-ceramic
- 5.2.3. Metal
- 5.3. Market Analysis, Insights and Forecast - by Application
- 5.3.1. Vehicle Armor
- 5.3.2. Body Armor
- 5.3.3. Helmet and Face Protection
- 5.3.4. Other Ap
- 5.4. Market Analysis, Insights and Forecast - by Region
- 5.4.1. Asia Pacific
- 5.4.2. North America
- 5.4.3. Europe
- 5.4.4. South America
- 5.4.5. Middle East and Africa
- 5.1. Market Analysis, Insights and Forecast - by Fiber Type
- 6. Global Ballistic Composites Industry Analysis, Insights and Forecast, 2021-2033
- 6.1. Market Analysis, Insights and Forecast - by Fiber Type
- 6.1.1. Aramids
- 6.1.2. Ultra-high-molecular Weight Polyethylene (UHMWPE)
- 6.1.3. S-glass
- 6.1.4. Others F
- 6.2. Market Analysis, Insights and Forecast - by Matrix Type
- 6.2.1. Polymer
- 6.2.2. Polymer-ceramic
- 6.2.3. Metal
- 6.3. Market Analysis, Insights and Forecast - by Application
- 6.3.1. Vehicle Armor
- 6.3.2. Body Armor
- 6.3.3. Helmet and Face Protection
- 6.3.4. Other Ap
- 6.1. Market Analysis, Insights and Forecast - by Fiber Type
- 7. Asia Pacific Ballistic Composites Industry Analysis, Insights and Forecast, 2020-2032
- 7.1. Market Analysis, Insights and Forecast - by Fiber Type
- 7.1.1. Aramids
- 7.1.2. Ultra-high-molecular Weight Polyethylene (UHMWPE)
- 7.1.3. S-glass
- 7.1.4. Others F
- 7.2. Market Analysis, Insights and Forecast - by Matrix Type
- 7.2.1. Polymer
- 7.2.2. Polymer-ceramic
- 7.2.3. Metal
- 7.3. Market Analysis, Insights and Forecast - by Application
- 7.3.1. Vehicle Armor
- 7.3.2. Body Armor
- 7.3.3. Helmet and Face Protection
- 7.3.4. Other Ap
- 7.1. Market Analysis, Insights and Forecast - by Fiber Type
- 8. North America Ballistic Composites Industry Analysis, Insights and Forecast, 2020-2032
- 8.1. Market Analysis, Insights and Forecast - by Fiber Type
- 8.1.1. Aramids
- 8.1.2. Ultra-high-molecular Weight Polyethylene (UHMWPE)
- 8.1.3. S-glass
- 8.1.4. Others F
- 8.2. Market Analysis, Insights and Forecast - by Matrix Type
- 8.2.1. Polymer
- 8.2.2. Polymer-ceramic
- 8.2.3. Metal
- 8.3. Market Analysis, Insights and Forecast - by Application
- 8.3.1. Vehicle Armor
- 8.3.2. Body Armor
- 8.3.3. Helmet and Face Protection
- 8.3.4. Other Ap
- 8.1. Market Analysis, Insights and Forecast - by Fiber Type
- 9. Europe Ballistic Composites Industry Analysis, Insights and Forecast, 2020-2032
- 9.1. Market Analysis, Insights and Forecast - by Fiber Type
- 9.1.1. Aramids
- 9.1.2. Ultra-high-molecular Weight Polyethylene (UHMWPE)
- 9.1.3. S-glass
- 9.1.4. Others F
- 9.2. Market Analysis, Insights and Forecast - by Matrix Type
- 9.2.1. Polymer
- 9.2.2. Polymer-ceramic
- 9.2.3. Metal
- 9.3. Market Analysis, Insights and Forecast - by Application
- 9.3.1. Vehicle Armor
- 9.3.2. Body Armor
- 9.3.3. Helmet and Face Protection
- 9.3.4. Other Ap
- 9.1. Market Analysis, Insights and Forecast - by Fiber Type
- 10. South America Ballistic Composites Industry Analysis, Insights and Forecast, 2020-2032
- 10.1. Market Analysis, Insights and Forecast - by Fiber Type
- 10.1.1. Aramids
- 10.1.2. Ultra-high-molecular Weight Polyethylene (UHMWPE)
- 10.1.3. S-glass
- 10.1.4. Others F
- 10.2. Market Analysis, Insights and Forecast - by Matrix Type
- 10.2.1. Polymer
- 10.2.2. Polymer-ceramic
- 10.2.3. Metal
- 10.3. Market Analysis, Insights and Forecast - by Application
- 10.3.1. Vehicle Armor
- 10.3.2. Body Armor
- 10.3.3. Helmet and Face Protection
- 10.3.4. Other Ap
- 10.1. Market Analysis, Insights and Forecast - by Fiber Type
- 11. Middle East and Africa Ballistic Composites Industry Analysis, Insights and Forecast, 2020-2032
- 11.1. Market Analysis, Insights and Forecast - by Fiber Type
- 11.1.1. Aramids
- 11.1.2. Ultra-high-molecular Weight Polyethylene (UHMWPE)
- 11.1.3. S-glass
- 11.1.4. Others F
- 11.2. Market Analysis, Insights and Forecast - by Matrix Type
- 11.2.1. Polymer
- 11.2.2. Polymer-ceramic
- 11.2.3. Metal
- 11.3. Market Analysis, Insights and Forecast - by Application
- 11.3.1. Vehicle Armor
- 11.3.2. Body Armor
- 11.3.3. Helmet and Face Protection
- 11.3.4. Other Ap
- 11.1. Market Analysis, Insights and Forecast - by Fiber Type
- 12. Competitive Analysis
- 12.1. Company Profiles
- 12.1.1 Honeywell International Inc
- 12.1.1.1. Company Overview
- 12.1.1.2. Products
- 12.1.1.3. Company Financials
- 12.1.1.4. SWOT Analysis
- 12.1.2 Teijin Limited
- 12.1.2.1. Company Overview
- 12.1.2.2. Products
- 12.1.2.3. Company Financials
- 12.1.2.4. SWOT Analysis
- 12.1.3 Plastic Reinforcement Fabrics Ltd
- 12.1.3.1. Company Overview
- 12.1.3.2. Products
- 12.1.3.3. Company Financials
- 12.1.3.4. SWOT Analysis
- 12.1.4 BAE Systems
- 12.1.4.1. Company Overview
- 12.1.4.2. Products
- 12.1.4.3. Company Financials
- 12.1.4.4. SWOT Analysis
- 12.1.5 Southern States llc
- 12.1.5.1. Company Overview
- 12.1.5.2. Products
- 12.1.5.3. Company Financials
- 12.1.5.4. SWOT Analysis
- 12.1.6 Roihu Inc
- 12.1.6.1. Company Overview
- 12.1.6.2. Products
- 12.1.6.3. Company Financials
- 12.1.6.4. SWOT Analysis
- 12.1.7 Barrday Inc
- 12.1.7.1. Company Overview
- 12.1.7.2. Products
- 12.1.7.3. Company Financials
- 12.1.7.4. SWOT Analysis
- 12.1.8 TenCate Protective Fabrics
- 12.1.8.1. Company Overview
- 12.1.8.2. Products
- 12.1.8.3. Company Financials
- 12.1.8.4. SWOT Analysis
- 12.1.9 MKU LIMITED
- 12.1.9.1. Company Overview
- 12.1.9.2. Products
- 12.1.9.3. Company Financials
- 12.1.9.4. SWOT Analysis
- 12.1.10 Coherent Corp
- 12.1.10.1. Company Overview
- 12.1.10.2. Products
- 12.1.10.3. Company Financials
- 12.1.10.4. SWOT Analysis
- 12.1.11 Integris
- 12.1.11.1. Company Overview
- 12.1.11.2. Products
- 12.1.11.3. Company Financials
- 12.1.11.4. SWOT Analysis
- 12.1.12 Morgan Advanced Materials
- 12.1.12.1. Company Overview
- 12.1.12.2. Products
- 12.1.12.3. Company Financials
- 12.1.12.4. SWOT Analysis
- 12.1.13 DSM
- 12.1.13.1. Company Overview
- 12.1.13.2. Products
- 12.1.13.3. Company Financials
- 12.1.13.4. SWOT Analysis
- 12.1.14 DuPont
- 12.1.14.1. Company Overview
- 12.1.14.2. Products
- 12.1.14.3. Company Financials
- 12.1.14.4. SWOT Analysis
- 12.1.15 Gaffco Ballistics
- 12.1.15.1. Company Overview
- 12.1.15.2. Products
- 12.1.15.3. Company Financials
- 12.1.15.4. SWOT Analysis
- 12.1.16 Gurit Holding AG
- 12.1.16.1. Company Overview
- 12.1.16.2. Products
- 12.1.16.3. Company Financials
- 12.1.16.4. SWOT Analysis
- 12.1.17 ArmorCore
- 12.1.17.1. Company Overview
- 12.1.17.2. Products
- 12.1.17.3. Company Financials
- 12.1.17.4. SWOT Analysis
- 12.1.1 Honeywell International Inc
- 12.2. Market Entropy
- 12.2.1 Company's Key Areas Served
- 12.2.2 Recent Developments
- 12.3. Company Market Share Analysis 2025
- 12.3.1 Top 5 Companies Market Share Analysis
- 12.3.2 Top 3 Companies Market Share Analysis
- 12.4. List of Potential Customers
- 13. Research Methodology
List of Figures
- Figure 1: Global Ballistic Composites Industry Revenue Breakdown (Million, %) by Region 2025 & 2033
- Figure 2: Global Ballistic Composites Industry Volume Breakdown (K Tons, %) by Region 2025 & 2033
- Figure 3: Asia Pacific Ballistic Composites Industry Revenue (Million), by Fiber Type 2025 & 2033
- Figure 4: Asia Pacific Ballistic Composites Industry Volume (K Tons), by Fiber Type 2025 & 2033
- Figure 5: Asia Pacific Ballistic Composites Industry Revenue Share (%), by Fiber Type 2025 & 2033
- Figure 6: Asia Pacific Ballistic Composites Industry Volume Share (%), by Fiber Type 2025 & 2033
- Figure 7: Asia Pacific Ballistic Composites Industry Revenue (Million), by Matrix Type 2025 & 2033
- Figure 8: Asia Pacific Ballistic Composites Industry Volume (K Tons), by Matrix Type 2025 & 2033
- Figure 9: Asia Pacific Ballistic Composites Industry Revenue Share (%), by Matrix Type 2025 & 2033
- Figure 10: Asia Pacific Ballistic Composites Industry Volume Share (%), by Matrix Type 2025 & 2033
- Figure 11: Asia Pacific Ballistic Composites Industry Revenue (Million), by Application 2025 & 2033
- Figure 12: Asia Pacific Ballistic Composites Industry Volume (K Tons), by Application 2025 & 2033
- Figure 13: Asia Pacific Ballistic Composites Industry Revenue Share (%), by Application 2025 & 2033
- Figure 14: Asia Pacific Ballistic Composites Industry Volume Share (%), by Application 2025 & 2033
- Figure 15: Asia Pacific Ballistic Composites Industry Revenue (Million), by Country 2025 & 2033
- Figure 16: Asia Pacific Ballistic Composites Industry Volume (K Tons), by Country 2025 & 2033
- Figure 17: Asia Pacific Ballistic Composites Industry Revenue Share (%), by Country 2025 & 2033
- Figure 18: Asia Pacific Ballistic Composites Industry Volume Share (%), by Country 2025 & 2033
- Figure 19: North America Ballistic Composites Industry Revenue (Million), by Fiber Type 2025 & 2033
- Figure 20: North America Ballistic Composites Industry Volume (K Tons), by Fiber Type 2025 & 2033
- Figure 21: North America Ballistic Composites Industry Revenue Share (%), by Fiber Type 2025 & 2033
- Figure 22: North America Ballistic Composites Industry Volume Share (%), by Fiber Type 2025 & 2033
- Figure 23: North America Ballistic Composites Industry Revenue (Million), by Matrix Type 2025 & 2033
- Figure 24: North America Ballistic Composites Industry Volume (K Tons), by Matrix Type 2025 & 2033
- Figure 25: North America Ballistic Composites Industry Revenue Share (%), by Matrix Type 2025 & 2033
- Figure 26: North America Ballistic Composites Industry Volume Share (%), by Matrix Type 2025 & 2033
- Figure 27: North America Ballistic Composites Industry Revenue (Million), by Application 2025 & 2033
- Figure 28: North America Ballistic Composites Industry Volume (K Tons), by Application 2025 & 2033
- Figure 29: North America Ballistic Composites Industry Revenue Share (%), by Application 2025 & 2033
- Figure 30: North America Ballistic Composites Industry Volume Share (%), by Application 2025 & 2033
- Figure 31: North America Ballistic Composites Industry Revenue (Million), by Country 2025 & 2033
- Figure 32: North America Ballistic Composites Industry Volume (K Tons), by Country 2025 & 2033
- Figure 33: North America Ballistic Composites Industry Revenue Share (%), by Country 2025 & 2033
- Figure 34: North America Ballistic Composites Industry Volume Share (%), by Country 2025 & 2033
- Figure 35: Europe Ballistic Composites Industry Revenue (Million), by Fiber Type 2025 & 2033
- Figure 36: Europe Ballistic Composites Industry Volume (K Tons), by Fiber Type 2025 & 2033
- Figure 37: Europe Ballistic Composites Industry Revenue Share (%), by Fiber Type 2025 & 2033
- Figure 38: Europe Ballistic Composites Industry Volume Share (%), by Fiber Type 2025 & 2033
- Figure 39: Europe Ballistic Composites Industry Revenue (Million), by Matrix Type 2025 & 2033
- Figure 40: Europe Ballistic Composites Industry Volume (K Tons), by Matrix Type 2025 & 2033
- Figure 41: Europe Ballistic Composites Industry Revenue Share (%), by Matrix Type 2025 & 2033
- Figure 42: Europe Ballistic Composites Industry Volume Share (%), by Matrix Type 2025 & 2033
- Figure 43: Europe Ballistic Composites Industry Revenue (Million), by Application 2025 & 2033
- Figure 44: Europe Ballistic Composites Industry Volume (K Tons), by Application 2025 & 2033
- Figure 45: Europe Ballistic Composites Industry Revenue Share (%), by Application 2025 & 2033
- Figure 46: Europe Ballistic Composites Industry Volume Share (%), by Application 2025 & 2033
- Figure 47: Europe Ballistic Composites Industry Revenue (Million), by Country 2025 & 2033
- Figure 48: Europe Ballistic Composites Industry Volume (K Tons), by Country 2025 & 2033
- Figure 49: Europe Ballistic Composites Industry Revenue Share (%), by Country 2025 & 2033
- Figure 50: Europe Ballistic Composites Industry Volume Share (%), by Country 2025 & 2033
- Figure 51: South America Ballistic Composites Industry Revenue (Million), by Fiber Type 2025 & 2033
- Figure 52: South America Ballistic Composites Industry Volume (K Tons), by Fiber Type 2025 & 2033
- Figure 53: South America Ballistic Composites Industry Revenue Share (%), by Fiber Type 2025 & 2033
- Figure 54: South America Ballistic Composites Industry Volume Share (%), by Fiber Type 2025 & 2033
- Figure 55: South America Ballistic Composites Industry Revenue (Million), by Matrix Type 2025 & 2033
- Figure 56: South America Ballistic Composites Industry Volume (K Tons), by Matrix Type 2025 & 2033
- Figure 57: South America Ballistic Composites Industry Revenue Share (%), by Matrix Type 2025 & 2033
- Figure 58: South America Ballistic Composites Industry Volume Share (%), by Matrix Type 2025 & 2033
- Figure 59: South America Ballistic Composites Industry Revenue (Million), by Application 2025 & 2033
- Figure 60: South America Ballistic Composites Industry Volume (K Tons), by Application 2025 & 2033
- Figure 61: South America Ballistic Composites Industry Revenue Share (%), by Application 2025 & 2033
- Figure 62: South America Ballistic Composites Industry Volume Share (%), by Application 2025 & 2033
- Figure 63: South America Ballistic Composites Industry Revenue (Million), by Country 2025 & 2033
- Figure 64: South America Ballistic Composites Industry Volume (K Tons), by Country 2025 & 2033
- Figure 65: South America Ballistic Composites Industry Revenue Share (%), by Country 2025 & 2033
- Figure 66: South America Ballistic Composites Industry Volume Share (%), by Country 2025 & 2033
- Figure 67: Middle East and Africa Ballistic Composites Industry Revenue (Million), by Fiber Type 2025 & 2033
- Figure 68: Middle East and Africa Ballistic Composites Industry Volume (K Tons), by Fiber Type 2025 & 2033
- Figure 69: Middle East and Africa Ballistic Composites Industry Revenue Share (%), by Fiber Type 2025 & 2033
- Figure 70: Middle East and Africa Ballistic Composites Industry Volume Share (%), by Fiber Type 2025 & 2033
- Figure 71: Middle East and Africa Ballistic Composites Industry Revenue (Million), by Matrix Type 2025 & 2033
- Figure 72: Middle East and Africa Ballistic Composites Industry Volume (K Tons), by Matrix Type 2025 & 2033
- Figure 73: Middle East and Africa Ballistic Composites Industry Revenue Share (%), by Matrix Type 2025 & 2033
- Figure 74: Middle East and Africa Ballistic Composites Industry Volume Share (%), by Matrix Type 2025 & 2033
- Figure 75: Middle East and Africa Ballistic Composites Industry Revenue (Million), by Application 2025 & 2033
- Figure 76: Middle East and Africa Ballistic Composites Industry Volume (K Tons), by Application 2025 & 2033
- Figure 77: Middle East and Africa Ballistic Composites Industry Revenue Share (%), by Application 2025 & 2033
- Figure 78: Middle East and Africa Ballistic Composites Industry Volume Share (%), by Application 2025 & 2033
- Figure 79: Middle East and Africa Ballistic Composites Industry Revenue (Million), by Country 2025 & 2033
- Figure 80: Middle East and Africa Ballistic Composites Industry Volume (K Tons), by Country 2025 & 2033
- Figure 81: Middle East and Africa Ballistic Composites Industry Revenue Share (%), by Country 2025 & 2033
- Figure 82: Middle East and Africa Ballistic Composites Industry Volume Share (%), by Country 2025 & 2033
List of Tables
- Table 1: Global Ballistic Composites Industry Revenue Million Forecast, by Fiber Type 2020 & 2033
- Table 2: Global Ballistic Composites Industry Volume K Tons Forecast, by Fiber Type 2020 & 2033
- Table 3: Global Ballistic Composites Industry Revenue Million Forecast, by Matrix Type 2020 & 2033
- Table 4: Global Ballistic Composites Industry Volume K Tons Forecast, by Matrix Type 2020 & 2033
- Table 5: Global Ballistic Composites Industry Revenue Million Forecast, by Application 2020 & 2033
- Table 6: Global Ballistic Composites Industry Volume K Tons Forecast, by Application 2020 & 2033
- Table 7: Global Ballistic Composites Industry Revenue Million Forecast, by Region 2020 & 2033
- Table 8: Global Ballistic Composites Industry Volume K Tons Forecast, by Region 2020 & 2033
- Table 9: Global Ballistic Composites Industry Revenue Million Forecast, by Fiber Type 2020 & 2033
- Table 10: Global Ballistic Composites Industry Volume K Tons Forecast, by Fiber Type 2020 & 2033
- Table 11: Global Ballistic Composites Industry Revenue Million Forecast, by Matrix Type 2020 & 2033
- Table 12: Global Ballistic Composites Industry Volume K Tons Forecast, by Matrix Type 2020 & 2033
- Table 13: Global Ballistic Composites Industry Revenue Million Forecast, by Application 2020 & 2033
- Table 14: Global Ballistic Composites Industry Volume K Tons Forecast, by Application 2020 & 2033
- Table 15: Global Ballistic Composites Industry Revenue Million Forecast, by Country 2020 & 2033
- Table 16: Global Ballistic Composites Industry Volume K Tons Forecast, by Country 2020 & 2033
- Table 17: China Ballistic Composites Industry Revenue (Million) Forecast, by Application 2020 & 2033
- Table 18: China Ballistic Composites Industry Volume (K Tons) Forecast, by Application 2020 & 2033
- Table 19: India Ballistic Composites Industry Revenue (Million) Forecast, by Application 2020 & 2033
- Table 20: India Ballistic Composites Industry Volume (K Tons) Forecast, by Application 2020 & 2033
- Table 21: Japan Ballistic Composites Industry Revenue (Million) Forecast, by Application 2020 & 2033
- Table 22: Japan Ballistic Composites Industry Volume (K Tons) Forecast, by Application 2020 & 2033
- Table 23: South Korea Ballistic Composites Industry Revenue (Million) Forecast, by Application 2020 & 2033
- Table 24: South Korea Ballistic Composites Industry Volume (K Tons) Forecast, by Application 2020 & 2033
- Table 25: Rest of Asia Pacific Ballistic Composites Industry Revenue (Million) Forecast, by Application 2020 & 2033
- Table 26: Rest of Asia Pacific Ballistic Composites Industry Volume (K Tons) Forecast, by Application 2020 & 2033
- Table 27: Global Ballistic Composites Industry Revenue Million Forecast, by Fiber Type 2020 & 2033
- Table 28: Global Ballistic Composites Industry Volume K Tons Forecast, by Fiber Type 2020 & 2033
- Table 29: Global Ballistic Composites Industry Revenue Million Forecast, by Matrix Type 2020 & 2033
- Table 30: Global Ballistic Composites Industry Volume K Tons Forecast, by Matrix Type 2020 & 2033
- Table 31: Global Ballistic Composites Industry Revenue Million Forecast, by Application 2020 & 2033
- Table 32: Global Ballistic Composites Industry Volume K Tons Forecast, by Application 2020 & 2033
- Table 33: Global Ballistic Composites Industry Revenue Million Forecast, by Country 2020 & 2033
- Table 34: Global Ballistic Composites Industry Volume K Tons Forecast, by Country 2020 & 2033
- Table 35: United States Ballistic Composites Industry Revenue (Million) Forecast, by Application 2020 & 2033
- Table 36: United States Ballistic Composites Industry Volume (K Tons) Forecast, by Application 2020 & 2033
- Table 37: Canada Ballistic Composites Industry Revenue (Million) Forecast, by Application 2020 & 2033
- Table 38: Canada Ballistic Composites Industry Volume (K Tons) Forecast, by Application 2020 & 2033
- Table 39: Mexico Ballistic Composites Industry Revenue (Million) Forecast, by Application 2020 & 2033
- Table 40: Mexico Ballistic Composites Industry Volume (K Tons) Forecast, by Application 2020 & 2033
- Table 41: Global Ballistic Composites Industry Revenue Million Forecast, by Fiber Type 2020 & 2033
- Table 42: Global Ballistic Composites Industry Volume K Tons Forecast, by Fiber Type 2020 & 2033
- Table 43: Global Ballistic Composites Industry Revenue Million Forecast, by Matrix Type 2020 & 2033
- Table 44: Global Ballistic Composites Industry Volume K Tons Forecast, by Matrix Type 2020 & 2033
- Table 45: Global Ballistic Composites Industry Revenue Million Forecast, by Application 2020 & 2033
- Table 46: Global Ballistic Composites Industry Volume K Tons Forecast, by Application 2020 & 2033
- Table 47: Global Ballistic Composites Industry Revenue Million Forecast, by Country 2020 & 2033
- Table 48: Global Ballistic Composites Industry Volume K Tons Forecast, by Country 2020 & 2033
- Table 49: Germany Ballistic Composites Industry Revenue (Million) Forecast, by Application 2020 & 2033
- Table 50: Germany Ballistic Composites Industry Volume (K Tons) Forecast, by Application 2020 & 2033
- Table 51: United Kingdom Ballistic Composites Industry Revenue (Million) Forecast, by Application 2020 & 2033
- Table 52: United Kingdom Ballistic Composites Industry Volume (K Tons) Forecast, by Application 2020 & 2033
- Table 53: Italy Ballistic Composites Industry Revenue (Million) Forecast, by Application 2020 & 2033
- Table 54: Italy Ballistic Composites Industry Volume (K Tons) Forecast, by Application 2020 & 2033
- Table 55: France Ballistic Composites Industry Revenue (Million) Forecast, by Application 2020 & 2033
- Table 56: France Ballistic Composites Industry Volume (K Tons) Forecast, by Application 2020 & 2033
- Table 57: Spain Ballistic Composites Industry Revenue (Million) Forecast, by Application 2020 & 2033
- Table 58: Spain Ballistic Composites Industry Volume (K Tons) Forecast, by Application 2020 & 2033
- Table 59: Rest of Europe Ballistic Composites Industry Revenue (Million) Forecast, by Application 2020 & 2033
- Table 60: Rest of Europe Ballistic Composites Industry Volume (K Tons) Forecast, by Application 2020 & 2033
- Table 61: Global Ballistic Composites Industry Revenue Million Forecast, by Fiber Type 2020 & 2033
- Table 62: Global Ballistic Composites Industry Volume K Tons Forecast, by Fiber Type 2020 & 2033
- Table 63: Global Ballistic Composites Industry Revenue Million Forecast, by Matrix Type 2020 & 2033
- Table 64: Global Ballistic Composites Industry Volume K Tons Forecast, by Matrix Type 2020 & 2033
- Table 65: Global Ballistic Composites Industry Revenue Million Forecast, by Application 2020 & 2033
- Table 66: Global Ballistic Composites Industry Volume K Tons Forecast, by Application 2020 & 2033
- Table 67: Global Ballistic Composites Industry Revenue Million Forecast, by Country 2020 & 2033
- Table 68: Global Ballistic Composites Industry Volume K Tons Forecast, by Country 2020 & 2033
- Table 69: Brazil Ballistic Composites Industry Revenue (Million) Forecast, by Application 2020 & 2033
- Table 70: Brazil Ballistic Composites Industry Volume (K Tons) Forecast, by Application 2020 & 2033
- Table 71: Argentina Ballistic Composites Industry Revenue (Million) Forecast, by Application 2020 & 2033
- Table 72: Argentina Ballistic Composites Industry Volume (K Tons) Forecast, by Application 2020 & 2033
- Table 73: Rest of South America Ballistic Composites Industry Revenue (Million) Forecast, by Application 2020 & 2033
- Table 74: Rest of South America Ballistic Composites Industry Volume (K Tons) Forecast, by Application 2020 & 2033
- Table 75: Global Ballistic Composites Industry Revenue Million Forecast, by Fiber Type 2020 & 2033
- Table 76: Global Ballistic Composites Industry Volume K Tons Forecast, by Fiber Type 2020 & 2033
- Table 77: Global Ballistic Composites Industry Revenue Million Forecast, by Matrix Type 2020 & 2033
- Table 78: Global Ballistic Composites Industry Volume K Tons Forecast, by Matrix Type 2020 & 2033
- Table 79: Global Ballistic Composites Industry Revenue Million Forecast, by Application 2020 & 2033
- Table 80: Global Ballistic Composites Industry Volume K Tons Forecast, by Application 2020 & 2033
- Table 81: Global Ballistic Composites Industry Revenue Million Forecast, by Country 2020 & 2033
- Table 82: Global Ballistic Composites Industry Volume K Tons Forecast, by Country 2020 & 2033
- Table 83: Saudi Arabia Ballistic Composites Industry Revenue (Million) Forecast, by Application 2020 & 2033
- Table 84: Saudi Arabia Ballistic Composites Industry Volume (K Tons) Forecast, by Application 2020 & 2033
- Table 85: South Africa Ballistic Composites Industry Revenue (Million) Forecast, by Application 2020 & 2033
- Table 86: South Africa Ballistic Composites Industry Volume (K Tons) Forecast, by Application 2020 & 2033
- Table 87: Rest of Middle East and Africa Ballistic Composites Industry Revenue (Million) Forecast, by Application 2020 & 2033
- Table 88: Rest of Middle East and Africa Ballistic Composites Industry Volume (K Tons) Forecast, by Application 2020 & 2033
Frequently Asked Questions
1. What is the projected Compound Annual Growth Rate (CAGR) of the Ballistic Composites Industry?
The projected CAGR is approximately > 4.00%.
2. Which companies are prominent players in the Ballistic Composites Industry?
Key companies in the market include Honeywell International Inc, Teijin Limited, Plastic Reinforcement Fabrics Ltd, BAE Systems, Southern States llc, Roihu Inc, Barrday Inc, TenCate Protective Fabrics, MKU LIMITED, Coherent Corp, Integris, Morgan Advanced Materials, DSM, DuPont, Gaffco Ballistics, Gurit Holding AG, ArmorCore.
3. What are the main segments of the Ballistic Composites Industry?
The market segments include Fiber Type, Matrix Type, Application.
4. Can you provide details about the market size?
The market size is estimated to be USD 1.91 Million as of 2022.
5. What are some drivers contributing to market growth?
Rise in Defense Expenditure; Increasing Demand for Lightweight Materials in the Aerospace and Defense Industry; Other Drivers.
6. What are the notable trends driving market growth?
Increasing Demand for Vehicle Armors.
7. Are there any restraints impacting market growth?
High Processing and Manufacturing Costs; Volatile Raw Material Supply.
8. Can you provide examples of recent developments in the market?
November 2023: Integris Composites developed a new system of ballistic vest gear for law enforcement and military units and launched the company’s new Rapid Don/Doff body armor vests. It is an equipment that dramatically reduces the time for donning and doffing one’s body armor rig—by 50% or more.
9. What pricing options are available for accessing the report?
Pricing options include single-user, multi-user, and enterprise licenses priced at USD 4750, USD 5250, and USD 8750 respectively.
10. Is the market size provided in terms of value or volume?
The market size is provided in terms of value, measured in Million and volume, measured in K Tons.
11. Are there any specific market keywords associated with the report?
Yes, the market keyword associated with the report is "Ballistic Composites Industry," which aids in identifying and referencing the specific market segment covered.
12. How do I determine which pricing option suits my needs best?
The pricing options vary based on user requirements and access needs. Individual users may opt for single-user licenses, while businesses requiring broader access may choose multi-user or enterprise licenses for cost-effective access to the report.
13. Are there any additional resources or data provided in the Ballistic Composites Industry report?
While the report offers comprehensive insights, it's advisable to review the specific contents or supplementary materials provided to ascertain if additional resources or data are available.
14. How can I stay updated on further developments or reports in the Ballistic Composites Industry?
To stay informed about further developments, trends, and reports in the Ballistic Composites Industry, consider subscribing to industry newsletters, following relevant companies and organizations, or regularly checking reputable industry news sources and publications.
Methodology
Step 1 - Identification of Relevant Samples Size from Population Database


Step 2 - Approaches for Defining Global Market Size (Value, Volume* & Price*)

Note*: In applicable scenarios
Step 3 - Data Sources
Primary Research
- Web Analytics
- Survey Reports
- Research Institute
- Latest Research Reports
- Opinion Leaders
Secondary Research
- Annual Reports
- White Paper
- Latest Press Release
- Industry Association
- Paid Database
- Investor Presentations

Step 4 - Data Triangulation
Involves using different sources of information in order to increase the validity of a study
These sources are likely to be stakeholders in a program - participants, other researchers, program staff, other community members, and so on.
Then we put all data in single framework & apply various statistical tools to find out the dynamic on the market.
During the analysis stage, feedback from the stakeholder groups would be compared to determine areas of agreement as well as areas of divergence