

Key Insights
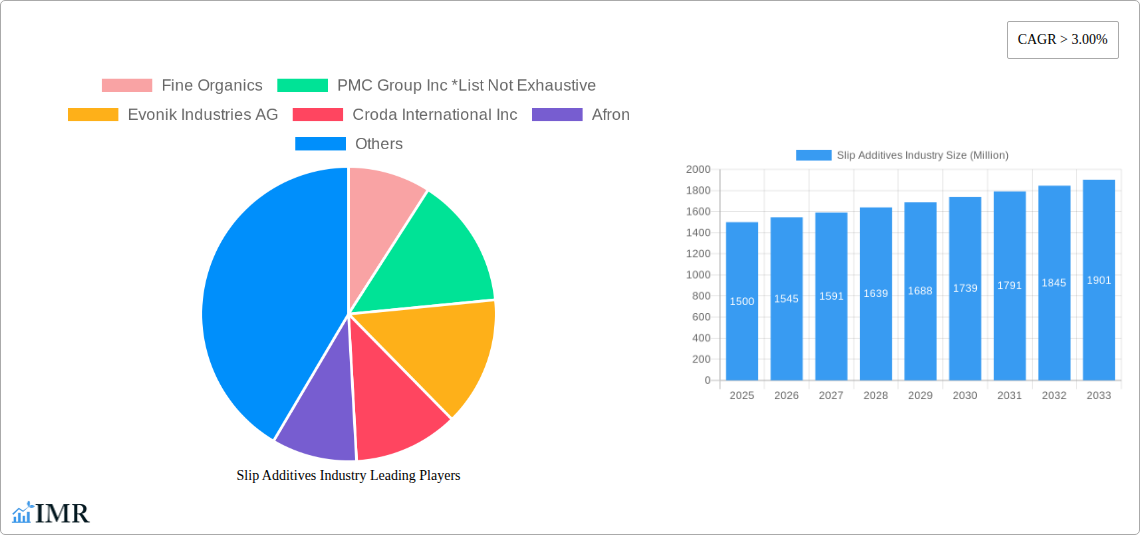
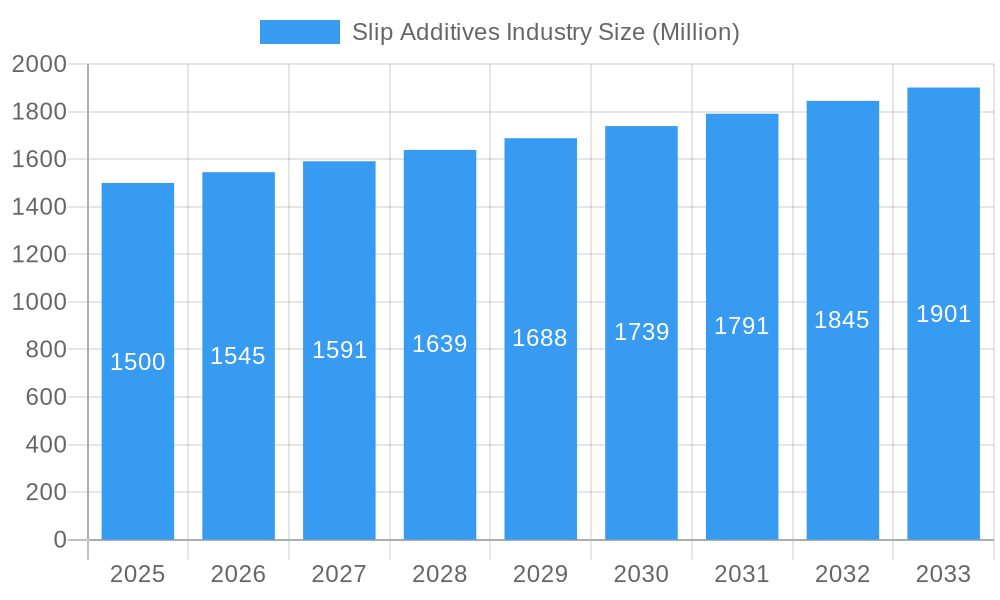
The global Slip Additives market is poised for robust growth, projected to exceed $1.5 billion by 2025 with a Compound Annual Growth Rate (CAGR) of over 3.00% through 2033. This expansion is primarily driven by the escalating demand for high-performance plastics and polymers across diverse end-use industries, notably packaging and automotive. The packaging sector, in particular, is a significant contributor, fueled by the increasing consumption of convenience foods, beverages, and healthcare products that rely heavily on plastic films and containers for protection and shelf-life extension. Slip additives are crucial in these applications, reducing friction between plastic surfaces, thereby enabling smoother processing, preventing blocking, and enhancing the overall functionality of plastic products. The growing emphasis on lightweighting in the automotive industry also contributes to the demand for specialized polymers and, consequently, slip additives for their improved handling and performance.
Slip Additives Industry Market Size (In Billion)
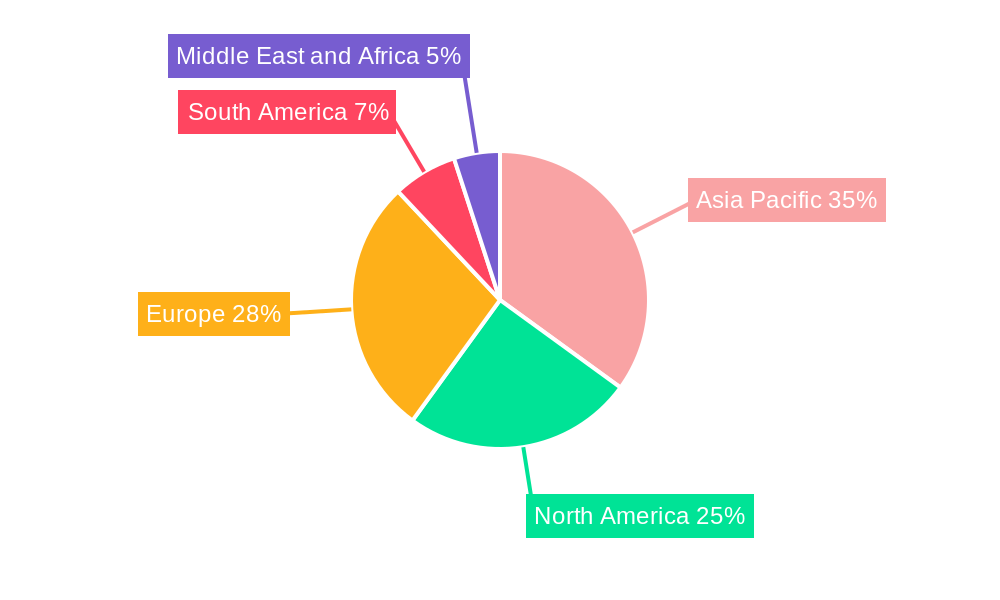
The market is characterized by a dynamic landscape of evolving polymer technologies and stricter regulatory requirements for food contact materials. Fatty amides, waxes, and polysiloxanes represent the dominant types of slip additives, with continuous innovation focused on developing more effective and sustainable solutions. Polyethylene and polypropylene continue to be the leading carrier resins, reflecting their widespread use in plastic manufacturing. Geographically, the Asia Pacific region is emerging as a key growth engine, driven by rapid industrialization, burgeoning middle-class populations, and substantial investments in manufacturing infrastructure in countries like China and India. However, factors such as fluctuating raw material prices and the development of alternative packaging materials could present challenges to sustained growth. Leading companies are actively engaged in research and development to introduce novel slip additive formulations and expand their global manufacturing capabilities to cater to this expanding market.
Slip Additives Industry Company Market Share
Report Description: Slip Additives Industry – Global Market Analysis & Forecast (2019-2033)
This comprehensive report provides an in-depth analysis of the global Slip Additives Industry, offering critical insights into market dynamics, growth trends, regional dominance, and future outlook. Covering the period from 2019 to 2033, with a base year of 2025, this study is an essential resource for stakeholders seeking to understand and capitalize on opportunities within this vital sector. Our analysis delves into parent and child markets, segmenting the industry by carrier resin (Polyethylene, Polypropylene, Other Ca), type (Fatty Amides, Waxes and Polysiloxanes, Other Types - Esters, Salts, etc.), and application (Packaging - Food and Beverage, Consumer Goods, Healthcare, Non-Packaging). The report quantifies market evolution with values presented in Million units, ensuring actionable data for strategic decision-making.
Slip Additives Industry Market Dynamics & Structure
The Slip Additives Industry is characterized by a moderately consolidated market, with leading players continuously investing in research and development to enhance product performance and sustainability. Technological innovation is a primary driver, focused on developing additives with improved slip properties, reduced migration, and enhanced compatibility with various polymer types. Regulatory frameworks, particularly concerning food contact applications and environmental impact, significantly influence product development and market entry. Competitive product substitutes, such as advanced surface treatments and alternative polymer formulations, present a dynamic competitive landscape. End-user demographics are increasingly sophisticated, demanding higher performance, cost-effectiveness, and eco-friendly solutions. Mergers and acquisitions (M&A) are a notable trend, as companies seek to expand their product portfolios, gain market share, and strengthen their technological capabilities. For instance, the market has witnessed approximately 5-10 significant M&A deals annually over the past five years, with deal values ranging from tens to hundreds of Million units, indicative of strategic consolidation. Barriers to innovation include stringent testing and certification requirements for specialized applications and the high cost of developing novel additive chemistries.
- Market Concentration: Moderate, with a few key global players dominating the market.
- Technological Innovation Drivers: Enhanced slip performance, reduced migration, biodegradability, and bio-based feedstocks.
- Regulatory Frameworks: Strict regulations for food contact materials (FDA, EFSA) and REACH compliance are crucial.
- Competitive Product Substitutes: Advanced polymer coatings, specialized surface modifications, and alternative packaging materials.
- End-User Demographics: Growing demand for high-performance, sustainable, and compliant additives across diverse applications.
- M&A Trends: Active consolidation to achieve economies of scale, expand geographical reach, and acquire innovative technologies.
Slip Additives Industry Growth Trends & Insights
The global Slip Additives Industry is poised for robust growth, driven by expanding applications in the packaging sector and increasing demand for high-performance polymers. Over the historical period (2019-2024), the market demonstrated a steady Compound Annual Growth Rate (CAGR) of approximately 4.5%, reaching an estimated market size of $1,850 Million units in 2024. Projections for the forecast period (2025-2033) indicate a sustained CAGR of around 5.2%, with the market size expected to reach $3,100 Million units by 2033. This growth is largely attributed to the increasing consumption of flexible packaging for food and beverages, consumer goods, and healthcare products, where slip additives are critical for smooth processing and product handling. Technological disruptions, such as the development of novel bio-based slip additives and advanced polysiloxane formulations, are gaining traction, catering to the growing demand for sustainable solutions. Consumer behavior shifts, particularly the heightened awareness regarding food safety and environmental sustainability, are compelling manufacturers to adopt additives with lower migration potential and improved eco-profiles. The adoption rates for high-performance slip additives are steadily increasing as manufacturers strive to optimize production efficiency and enhance product appeal. For instance, the penetration of advanced fatty amide slip additives in high-barrier packaging applications is projected to grow by nearly 15% over the next five years.
Dominant Regions, Countries, or Segments in Slip Additives Industry
The Asia-Pacific region stands as the most dominant force in the global Slip Additives Industry, driven by its burgeoning manufacturing sector, increasing disposable incomes, and rapid industrialization. Within the Asia-Pacific, China and India are key growth engines, contributing significantly to both demand and production. The Packaging application segment, particularly Food and Beverage Packaging, is the leading segment driving market growth. This dominance is propelled by the region's massive population, rising demand for packaged food, and the expanding e-commerce sector that necessitates efficient and protective packaging solutions. The Polyethylene carrier resin segment also holds a substantial market share, owing to its widespread use in flexible packaging films, a primary application for slip additives.
Key drivers for Asia-Pacific's dominance include:
- Economic Policies: Favorable government policies promoting manufacturing and trade have attracted significant foreign investment.
- Infrastructure Development: Extensive investments in logistics and infrastructure facilitate efficient supply chains and market access.
- Growing Middle Class: An expanding middle class translates to higher consumption of packaged goods, thus boosting demand for packaging materials and additives.
The Fatty Amides type segment is a major contributor within the industry due to its excellent slip properties, cost-effectiveness, and wide applicability, especially in polyolefin-based films. The market share for fatty amides in the overall slip additives market is estimated to be around 40-45%. The projected market growth within this segment is further bolstered by ongoing innovations in producing more efficient and sustainable fatty amide-based additives.
- Dominant Region: Asia-Pacific (contributing over 35% of the global market share).
- Leading Country: China (estimated market share of over 15% of the global market).
- Dominant Carrier Resin: Polyethylene (holding approximately 50-55% of the market share).
- Dominant Type: Fatty Amides (estimated market share of 40-45%).
- Dominant Application: Packaging (specifically Food and Beverage Packaging, estimated to command over 60% of the application market share).
Slip Additives Industry Product Landscape
The Slip Additives Industry product landscape is characterized by continuous innovation focused on enhancing product performance and sustainability. Leading manufacturers are developing advanced formulations of fatty amides and waxes that offer superior slip characteristics, reduced haze, and improved heat stability for high-speed processing lines. Polysiloxane-based slip additives are gaining prominence due to their exceptional durability and resistance to temperature fluctuations. Unique selling propositions include additives that meet stringent regulatory requirements for food contact applications, such as low migration levels and compliance with FDA and EFSA standards. Technological advancements are also geared towards bio-based and biodegradable slip additives, catering to the growing demand for environmentally friendly solutions. These products demonstrate comparable or even superior performance to conventional additives, offering a compelling value proposition for sustainability-conscious manufacturers.
Key Drivers, Barriers & Challenges in Slip Additives Industry
The Slip Additives Industry is propelled by several key drivers including the escalating demand for flexible packaging across food, beverage, and consumer goods sectors, driven by convenience and extended shelf life. Advancements in polymer processing technologies necessitate high-performance additives for smoother operations. The growing emphasis on sustainability and the development of eco-friendly alternatives are also significant drivers.
Key drivers include:
- Rising Packaging Demand: Global expansion of packaged goods market.
- Technological Advancements: Enhanced polymer processing efficiency.
- Sustainability Trends: Preference for bio-based and eco-friendly additives.
However, the industry faces several challenges and restraints. Fluctuations in raw material prices, particularly those derived from natural oils and petrochemicals, can impact production costs and profit margins. Stringent regulatory hurdles, especially for food-grade applications requiring extensive testing and certification, can delay product launches and increase R&D expenses. Intense competition among established players and emerging manufacturers can lead to price pressures, affecting profitability. Supply chain disruptions, as witnessed in recent global events, can affect the availability and cost of key raw materials.
Challenges and restraints include:
- Raw Material Price Volatility: Impacts production costs.
- Stringent Regulations: High cost and time for compliance.
- Intense Competition: Price wars and market saturation.
- Supply Chain Vulnerabilities: Risk of material shortages and cost increases.
Emerging Opportunities in Slip Additives Industry
Emerging opportunities in the Slip Additives Industry lie in the development of novel, high-performance bio-based slip additives derived from renewable resources, addressing the growing consumer and regulatory demand for sustainable materials. The expansion of the healthcare packaging sector, with its increasing need for specialized, low-migration additives, presents a significant growth avenue. Furthermore, advancements in additive manufacturing and 3D printing technologies could open new application areas for slip additives, particularly in creating smoother surfaces and reducing friction in printed components. Untapped markets in developing economies, with their rapidly growing consumer bases and expanding manufacturing sectors, offer substantial potential for market penetration.
Growth Accelerators in the Slip Additives Industry Industry
Growth accelerators in the Slip Additives Industry are primarily fueled by continuous technological breakthroughs in additive chemistry, leading to products with superior performance attributes such as enhanced slip, reduced blooming, and better temperature resistance. Strategic partnerships between additive manufacturers and polymer producers are crucial for co-developing customized solutions that meet specific application needs. Market expansion strategies, particularly focusing on emerging economies and niche applications like medical devices and specialty films, will also contribute significantly to long-term growth. The increasing adoption of advanced manufacturing techniques that optimize additive incorporation and dispersion will further enhance efficiency and product quality, thereby accelerating market expansion.
Key Players Shaping the Slip Additives Industry Market
- Fine Organics
- PMC Group Inc
- Evonik Industries AG
- Croda International Inc
- Afron
- Emery Oleochemicals
- ALTANA
- BASF SE
- Honeywell International
- The Lubrizol Corporation
- Lonza
Notable Milestones in Slip Additives Industry Sector
- 2023: Fine Organics launched a new range of bio-based slip additives, enhancing its sustainable product portfolio.
- 2022: Evonik Industries AG acquired a specialty additive manufacturer to expand its product offerings in polysiloxane-based slip additives.
- 2021: Croda International Inc. introduced a novel slip additive with ultra-low migration properties for sensitive food packaging applications.
- 2020: BASF SE announced significant investment in R&D for next-generation slip additives focusing on circular economy principles.
- 2019: The Lubrizol Corporation expanded its production capacity for fatty amide slip additives to meet growing global demand.
In-Depth Slip Additives Industry Market Outlook
The future outlook for the Slip Additives Industry remains exceptionally positive, driven by ongoing innovation and expanding application horizons. Growth accelerators are firmly rooted in the persistent demand for enhanced performance and sustainability in polymer applications. The industry is projected to witness continued expansion in the packaging sector, with a notable shift towards high-barrier, specialized films for food, beverage, and healthcare. Investments in bio-based and biodegradable additives are set to accelerate, aligning with global environmental mandates and consumer preferences. Strategic partnerships and technological advancements in additive dispersion and incorporation will further optimize production efficiencies for end-users. The market is ripe with opportunities for companies that can deliver innovative, cost-effective, and sustainable slip additive solutions to meet the evolving needs of a dynamic global marketplace.
Slip Additives Industry Segmentation
-
1. Carrier Resin
- 1.1. Polyethylene
- 1.2. Polypropylene
- 1.3. Other Ca
-
2. Type
- 2.1. Fatty Amides
- 2.2. Waxes and Polysiloxanes
- 2.3. Other Types (Esters, Salts, etc.)
-
3. Application
-
3.1. Packaging
- 3.1.1. Food and Beverage
- 3.1.2. Consumer Goods
- 3.1.3. Healthcare
- 3.2. Non-Packaging
-
3.1. Packaging
Slip Additives Industry Segmentation By Geography
-
1. Asia Pacific
- 1.1. China
- 1.2. India
- 1.3. Japan
- 1.4. South Korea
- 1.5. Rest of Asia Pacific
-
2. North America
- 2.1. United States
- 2.2. Canada
- 2.3. Mexico
-
3. Europe
- 3.1. Germany
- 3.2. United Kingdom
- 3.3. Italy
- 3.4. France
- 3.5. Rest of Europe
-
4. South America
- 4.1. Brazil
- 4.2. Argentina
- 4.3. Rest of South America
-
5. Middle East and Africa
- 5.1. Saudi Arabia
- 5.2. South Africa
- 5.3. Rest of Middle East and Africa
Slip Additives Industry Regional Market Share
Geographic Coverage of Slip Additives Industry
Slip Additives Industry REPORT HIGHLIGHTS
| Aspects | Details |
|---|---|
| Study Period | 2020-2034 |
| Base Year | 2025 |
| Estimated Year | 2026 |
| Forecast Period | 2026-2034 |
| Historical Period | 2020-2025 |
| Growth Rate | CAGR of 5.04% from 2020-2034 |
| Segmentation |
|
Table of Contents
- 1. Introduction
- 1.1. Research Scope
- 1.2. Market Segmentation
- 1.3. Research Objective
- 1.4. Definitions and Assumptions
- 2. Executive Summary
- 2.1. Market Snapshot
- 3. Market Dynamics
- 3.1. Market Drivers
- 3.2. Market Restrains
- 3.3. Market Trends
- 3.4. Market Opportunities
- 4. Market Factor Analysis
- 4.1. Porters Five Forces
- 4.1.1. Bargaining Power of Suppliers
- 4.1.2. Bargaining Power of Buyers
- 4.1.3. Threat of New Entrants
- 4.1.4. Threat of Substitutes
- 4.1.5. Competitive Rivalry
- 4.2. PESTEL analysis
- 4.3. BCG Analysis
- 4.3.1. Stars (High Growth, High Market Share)
- 4.3.2. Cash Cows (Low Growth, High Market Share)
- 4.3.3. Question Mark (High Growth, Low Market Share)
- 4.3.4. Dogs (Low Growth, Low Market Share)
- 4.4. Ansoff Matrix Analysis
- 4.5. Supply Chain Analysis
- 4.6. Regulatory Landscape
- 4.7. Current Market Potential and Opportunity Assessment (TAM–SAM–SOM Framework)
- 4.8. IMR Analyst Note
- 4.1. Porters Five Forces
- 5. Market Analysis, Insights and Forecast 2021-2033
- 5.1. Market Analysis, Insights and Forecast - by Carrier Resin
- 5.1.1. Polyethylene
- 5.1.2. Polypropylene
- 5.1.3. Other Ca
- 5.2. Market Analysis, Insights and Forecast - by Type
- 5.2.1. Fatty Amides
- 5.2.2. Waxes and Polysiloxanes
- 5.2.3. Other Types (Esters, Salts, etc.)
- 5.3. Market Analysis, Insights and Forecast - by Application
- 5.3.1. Packaging
- 5.3.1.1. Food and Beverage
- 5.3.1.2. Consumer Goods
- 5.3.1.3. Healthcare
- 5.3.2. Non-Packaging
- 5.3.1. Packaging
- 5.4. Market Analysis, Insights and Forecast - by Region
- 5.4.1. Asia Pacific
- 5.4.2. North America
- 5.4.3. Europe
- 5.4.4. South America
- 5.4.5. Middle East and Africa
- 5.1. Market Analysis, Insights and Forecast - by Carrier Resin
- 6. Global Slip Additives Industry Analysis, Insights and Forecast, 2021-2033
- 6.1. Market Analysis, Insights and Forecast - by Carrier Resin
- 6.1.1. Polyethylene
- 6.1.2. Polypropylene
- 6.1.3. Other Ca
- 6.2. Market Analysis, Insights and Forecast - by Type
- 6.2.1. Fatty Amides
- 6.2.2. Waxes and Polysiloxanes
- 6.2.3. Other Types (Esters, Salts, etc.)
- 6.3. Market Analysis, Insights and Forecast - by Application
- 6.3.1. Packaging
- 6.3.1.1. Food and Beverage
- 6.3.1.2. Consumer Goods
- 6.3.1.3. Healthcare
- 6.3.2. Non-Packaging
- 6.3.1. Packaging
- 6.1. Market Analysis, Insights and Forecast - by Carrier Resin
- 7. Asia Pacific Slip Additives Industry Analysis, Insights and Forecast, 2020-2032
- 7.1. Market Analysis, Insights and Forecast - by Carrier Resin
- 7.1.1. Polyethylene
- 7.1.2. Polypropylene
- 7.1.3. Other Ca
- 7.2. Market Analysis, Insights and Forecast - by Type
- 7.2.1. Fatty Amides
- 7.2.2. Waxes and Polysiloxanes
- 7.2.3. Other Types (Esters, Salts, etc.)
- 7.3. Market Analysis, Insights and Forecast - by Application
- 7.3.1. Packaging
- 7.3.1.1. Food and Beverage
- 7.3.1.2. Consumer Goods
- 7.3.1.3. Healthcare
- 7.3.2. Non-Packaging
- 7.3.1. Packaging
- 7.1. Market Analysis, Insights and Forecast - by Carrier Resin
- 8. North America Slip Additives Industry Analysis, Insights and Forecast, 2020-2032
- 8.1. Market Analysis, Insights and Forecast - by Carrier Resin
- 8.1.1. Polyethylene
- 8.1.2. Polypropylene
- 8.1.3. Other Ca
- 8.2. Market Analysis, Insights and Forecast - by Type
- 8.2.1. Fatty Amides
- 8.2.2. Waxes and Polysiloxanes
- 8.2.3. Other Types (Esters, Salts, etc.)
- 8.3. Market Analysis, Insights and Forecast - by Application
- 8.3.1. Packaging
- 8.3.1.1. Food and Beverage
- 8.3.1.2. Consumer Goods
- 8.3.1.3. Healthcare
- 8.3.2. Non-Packaging
- 8.3.1. Packaging
- 8.1. Market Analysis, Insights and Forecast - by Carrier Resin
- 9. Europe Slip Additives Industry Analysis, Insights and Forecast, 2020-2032
- 9.1. Market Analysis, Insights and Forecast - by Carrier Resin
- 9.1.1. Polyethylene
- 9.1.2. Polypropylene
- 9.1.3. Other Ca
- 9.2. Market Analysis, Insights and Forecast - by Type
- 9.2.1. Fatty Amides
- 9.2.2. Waxes and Polysiloxanes
- 9.2.3. Other Types (Esters, Salts, etc.)
- 9.3. Market Analysis, Insights and Forecast - by Application
- 9.3.1. Packaging
- 9.3.1.1. Food and Beverage
- 9.3.1.2. Consumer Goods
- 9.3.1.3. Healthcare
- 9.3.2. Non-Packaging
- 9.3.1. Packaging
- 9.1. Market Analysis, Insights and Forecast - by Carrier Resin
- 10. South America Slip Additives Industry Analysis, Insights and Forecast, 2020-2032
- 10.1. Market Analysis, Insights and Forecast - by Carrier Resin
- 10.1.1. Polyethylene
- 10.1.2. Polypropylene
- 10.1.3. Other Ca
- 10.2. Market Analysis, Insights and Forecast - by Type
- 10.2.1. Fatty Amides
- 10.2.2. Waxes and Polysiloxanes
- 10.2.3. Other Types (Esters, Salts, etc.)
- 10.3. Market Analysis, Insights and Forecast - by Application
- 10.3.1. Packaging
- 10.3.1.1. Food and Beverage
- 10.3.1.2. Consumer Goods
- 10.3.1.3. Healthcare
- 10.3.2. Non-Packaging
- 10.3.1. Packaging
- 10.1. Market Analysis, Insights and Forecast - by Carrier Resin
- 11. Middle East and Africa Slip Additives Industry Analysis, Insights and Forecast, 2020-2032
- 11.1. Market Analysis, Insights and Forecast - by Carrier Resin
- 11.1.1. Polyethylene
- 11.1.2. Polypropylene
- 11.1.3. Other Ca
- 11.2. Market Analysis, Insights and Forecast - by Type
- 11.2.1. Fatty Amides
- 11.2.2. Waxes and Polysiloxanes
- 11.2.3. Other Types (Esters, Salts, etc.)
- 11.3. Market Analysis, Insights and Forecast - by Application
- 11.3.1. Packaging
- 11.3.1.1. Food and Beverage
- 11.3.1.2. Consumer Goods
- 11.3.1.3. Healthcare
- 11.3.2. Non-Packaging
- 11.3.1. Packaging
- 11.1. Market Analysis, Insights and Forecast - by Carrier Resin
- 12. Competitive Analysis
- 12.1. Company Profiles
- 12.1.1 Fine Organics
- 12.1.1.1. Company Overview
- 12.1.1.2. Products
- 12.1.1.3. Company Financials
- 12.1.1.4. SWOT Analysis
- 12.1.2 PMC Group Inc *List Not Exhaustive
- 12.1.2.1. Company Overview
- 12.1.2.2. Products
- 12.1.2.3. Company Financials
- 12.1.2.4. SWOT Analysis
- 12.1.3 Evonik Industries AG
- 12.1.3.1. Company Overview
- 12.1.3.2. Products
- 12.1.3.3. Company Financials
- 12.1.3.4. SWOT Analysis
- 12.1.4 Croda International Inc
- 12.1.4.1. Company Overview
- 12.1.4.2. Products
- 12.1.4.3. Company Financials
- 12.1.4.4. SWOT Analysis
- 12.1.5 Afron
- 12.1.5.1. Company Overview
- 12.1.5.2. Products
- 12.1.5.3. Company Financials
- 12.1.5.4. SWOT Analysis
- 12.1.6 Emery Oleochemicals
- 12.1.6.1. Company Overview
- 12.1.6.2. Products
- 12.1.6.3. Company Financials
- 12.1.6.4. SWOT Analysis
- 12.1.7 ALTANA
- 12.1.7.1. Company Overview
- 12.1.7.2. Products
- 12.1.7.3. Company Financials
- 12.1.7.4. SWOT Analysis
- 12.1.8 BASF SE
- 12.1.8.1. Company Overview
- 12.1.8.2. Products
- 12.1.8.3. Company Financials
- 12.1.8.4. SWOT Analysis
- 12.1.9 Honeywell International
- 12.1.9.1. Company Overview
- 12.1.9.2. Products
- 12.1.9.3. Company Financials
- 12.1.9.4. SWOT Analysis
- 12.1.10 The Lubrizol Corporation
- 12.1.10.1. Company Overview
- 12.1.10.2. Products
- 12.1.10.3. Company Financials
- 12.1.10.4. SWOT Analysis
- 12.1.11 Lonza
- 12.1.11.1. Company Overview
- 12.1.11.2. Products
- 12.1.11.3. Company Financials
- 12.1.11.4. SWOT Analysis
- 12.1.1 Fine Organics
- 12.2. Market Entropy
- 12.2.1 Company's Key Areas Served
- 12.2.2 Recent Developments
- 12.3. Company Market Share Analysis 2025
- 12.3.1 Top 5 Companies Market Share Analysis
- 12.3.2 Top 3 Companies Market Share Analysis
- 12.4. List of Potential Customers
- 13. Research Methodology
List of Figures
- Figure 1: Global Slip Additives Industry Revenue Breakdown (million, %) by Region 2025 & 2033
- Figure 2: Global Slip Additives Industry Volume Breakdown (kilotons, %) by Region 2025 & 2033
- Figure 3: Asia Pacific Slip Additives Industry Revenue (million), by Carrier Resin 2025 & 2033
- Figure 4: Asia Pacific Slip Additives Industry Volume (kilotons), by Carrier Resin 2025 & 2033
- Figure 5: Asia Pacific Slip Additives Industry Revenue Share (%), by Carrier Resin 2025 & 2033
- Figure 6: Asia Pacific Slip Additives Industry Volume Share (%), by Carrier Resin 2025 & 2033
- Figure 7: Asia Pacific Slip Additives Industry Revenue (million), by Type 2025 & 2033
- Figure 8: Asia Pacific Slip Additives Industry Volume (kilotons), by Type 2025 & 2033
- Figure 9: Asia Pacific Slip Additives Industry Revenue Share (%), by Type 2025 & 2033
- Figure 10: Asia Pacific Slip Additives Industry Volume Share (%), by Type 2025 & 2033
- Figure 11: Asia Pacific Slip Additives Industry Revenue (million), by Application 2025 & 2033
- Figure 12: Asia Pacific Slip Additives Industry Volume (kilotons), by Application 2025 & 2033
- Figure 13: Asia Pacific Slip Additives Industry Revenue Share (%), by Application 2025 & 2033
- Figure 14: Asia Pacific Slip Additives Industry Volume Share (%), by Application 2025 & 2033
- Figure 15: Asia Pacific Slip Additives Industry Revenue (million), by Country 2025 & 2033
- Figure 16: Asia Pacific Slip Additives Industry Volume (kilotons), by Country 2025 & 2033
- Figure 17: Asia Pacific Slip Additives Industry Revenue Share (%), by Country 2025 & 2033
- Figure 18: Asia Pacific Slip Additives Industry Volume Share (%), by Country 2025 & 2033
- Figure 19: North America Slip Additives Industry Revenue (million), by Carrier Resin 2025 & 2033
- Figure 20: North America Slip Additives Industry Volume (kilotons), by Carrier Resin 2025 & 2033
- Figure 21: North America Slip Additives Industry Revenue Share (%), by Carrier Resin 2025 & 2033
- Figure 22: North America Slip Additives Industry Volume Share (%), by Carrier Resin 2025 & 2033
- Figure 23: North America Slip Additives Industry Revenue (million), by Type 2025 & 2033
- Figure 24: North America Slip Additives Industry Volume (kilotons), by Type 2025 & 2033
- Figure 25: North America Slip Additives Industry Revenue Share (%), by Type 2025 & 2033
- Figure 26: North America Slip Additives Industry Volume Share (%), by Type 2025 & 2033
- Figure 27: North America Slip Additives Industry Revenue (million), by Application 2025 & 2033
- Figure 28: North America Slip Additives Industry Volume (kilotons), by Application 2025 & 2033
- Figure 29: North America Slip Additives Industry Revenue Share (%), by Application 2025 & 2033
- Figure 30: North America Slip Additives Industry Volume Share (%), by Application 2025 & 2033
- Figure 31: North America Slip Additives Industry Revenue (million), by Country 2025 & 2033
- Figure 32: North America Slip Additives Industry Volume (kilotons), by Country 2025 & 2033
- Figure 33: North America Slip Additives Industry Revenue Share (%), by Country 2025 & 2033
- Figure 34: North America Slip Additives Industry Volume Share (%), by Country 2025 & 2033
- Figure 35: Europe Slip Additives Industry Revenue (million), by Carrier Resin 2025 & 2033
- Figure 36: Europe Slip Additives Industry Volume (kilotons), by Carrier Resin 2025 & 2033
- Figure 37: Europe Slip Additives Industry Revenue Share (%), by Carrier Resin 2025 & 2033
- Figure 38: Europe Slip Additives Industry Volume Share (%), by Carrier Resin 2025 & 2033
- Figure 39: Europe Slip Additives Industry Revenue (million), by Type 2025 & 2033
- Figure 40: Europe Slip Additives Industry Volume (kilotons), by Type 2025 & 2033
- Figure 41: Europe Slip Additives Industry Revenue Share (%), by Type 2025 & 2033
- Figure 42: Europe Slip Additives Industry Volume Share (%), by Type 2025 & 2033
- Figure 43: Europe Slip Additives Industry Revenue (million), by Application 2025 & 2033
- Figure 44: Europe Slip Additives Industry Volume (kilotons), by Application 2025 & 2033
- Figure 45: Europe Slip Additives Industry Revenue Share (%), by Application 2025 & 2033
- Figure 46: Europe Slip Additives Industry Volume Share (%), by Application 2025 & 2033
- Figure 47: Europe Slip Additives Industry Revenue (million), by Country 2025 & 2033
- Figure 48: Europe Slip Additives Industry Volume (kilotons), by Country 2025 & 2033
- Figure 49: Europe Slip Additives Industry Revenue Share (%), by Country 2025 & 2033
- Figure 50: Europe Slip Additives Industry Volume Share (%), by Country 2025 & 2033
- Figure 51: South America Slip Additives Industry Revenue (million), by Carrier Resin 2025 & 2033
- Figure 52: South America Slip Additives Industry Volume (kilotons), by Carrier Resin 2025 & 2033
- Figure 53: South America Slip Additives Industry Revenue Share (%), by Carrier Resin 2025 & 2033
- Figure 54: South America Slip Additives Industry Volume Share (%), by Carrier Resin 2025 & 2033
- Figure 55: South America Slip Additives Industry Revenue (million), by Type 2025 & 2033
- Figure 56: South America Slip Additives Industry Volume (kilotons), by Type 2025 & 2033
- Figure 57: South America Slip Additives Industry Revenue Share (%), by Type 2025 & 2033
- Figure 58: South America Slip Additives Industry Volume Share (%), by Type 2025 & 2033
- Figure 59: South America Slip Additives Industry Revenue (million), by Application 2025 & 2033
- Figure 60: South America Slip Additives Industry Volume (kilotons), by Application 2025 & 2033
- Figure 61: South America Slip Additives Industry Revenue Share (%), by Application 2025 & 2033
- Figure 62: South America Slip Additives Industry Volume Share (%), by Application 2025 & 2033
- Figure 63: South America Slip Additives Industry Revenue (million), by Country 2025 & 2033
- Figure 64: South America Slip Additives Industry Volume (kilotons), by Country 2025 & 2033
- Figure 65: South America Slip Additives Industry Revenue Share (%), by Country 2025 & 2033
- Figure 66: South America Slip Additives Industry Volume Share (%), by Country 2025 & 2033
- Figure 67: Middle East and Africa Slip Additives Industry Revenue (million), by Carrier Resin 2025 & 2033
- Figure 68: Middle East and Africa Slip Additives Industry Volume (kilotons), by Carrier Resin 2025 & 2033
- Figure 69: Middle East and Africa Slip Additives Industry Revenue Share (%), by Carrier Resin 2025 & 2033
- Figure 70: Middle East and Africa Slip Additives Industry Volume Share (%), by Carrier Resin 2025 & 2033
- Figure 71: Middle East and Africa Slip Additives Industry Revenue (million), by Type 2025 & 2033
- Figure 72: Middle East and Africa Slip Additives Industry Volume (kilotons), by Type 2025 & 2033
- Figure 73: Middle East and Africa Slip Additives Industry Revenue Share (%), by Type 2025 & 2033
- Figure 74: Middle East and Africa Slip Additives Industry Volume Share (%), by Type 2025 & 2033
- Figure 75: Middle East and Africa Slip Additives Industry Revenue (million), by Application 2025 & 2033
- Figure 76: Middle East and Africa Slip Additives Industry Volume (kilotons), by Application 2025 & 2033
- Figure 77: Middle East and Africa Slip Additives Industry Revenue Share (%), by Application 2025 & 2033
- Figure 78: Middle East and Africa Slip Additives Industry Volume Share (%), by Application 2025 & 2033
- Figure 79: Middle East and Africa Slip Additives Industry Revenue (million), by Country 2025 & 2033
- Figure 80: Middle East and Africa Slip Additives Industry Volume (kilotons), by Country 2025 & 2033
- Figure 81: Middle East and Africa Slip Additives Industry Revenue Share (%), by Country 2025 & 2033
- Figure 82: Middle East and Africa Slip Additives Industry Volume Share (%), by Country 2025 & 2033
List of Tables
- Table 1: Global Slip Additives Industry Revenue million Forecast, by Carrier Resin 2020 & 2033
- Table 2: Global Slip Additives Industry Volume kilotons Forecast, by Carrier Resin 2020 & 2033
- Table 3: Global Slip Additives Industry Revenue million Forecast, by Type 2020 & 2033
- Table 4: Global Slip Additives Industry Volume kilotons Forecast, by Type 2020 & 2033
- Table 5: Global Slip Additives Industry Revenue million Forecast, by Application 2020 & 2033
- Table 6: Global Slip Additives Industry Volume kilotons Forecast, by Application 2020 & 2033
- Table 7: Global Slip Additives Industry Revenue million Forecast, by Region 2020 & 2033
- Table 8: Global Slip Additives Industry Volume kilotons Forecast, by Region 2020 & 2033
- Table 9: Global Slip Additives Industry Revenue million Forecast, by Carrier Resin 2020 & 2033
- Table 10: Global Slip Additives Industry Volume kilotons Forecast, by Carrier Resin 2020 & 2033
- Table 11: Global Slip Additives Industry Revenue million Forecast, by Type 2020 & 2033
- Table 12: Global Slip Additives Industry Volume kilotons Forecast, by Type 2020 & 2033
- Table 13: Global Slip Additives Industry Revenue million Forecast, by Application 2020 & 2033
- Table 14: Global Slip Additives Industry Volume kilotons Forecast, by Application 2020 & 2033
- Table 15: Global Slip Additives Industry Revenue million Forecast, by Country 2020 & 2033
- Table 16: Global Slip Additives Industry Volume kilotons Forecast, by Country 2020 & 2033
- Table 17: China Slip Additives Industry Revenue (million) Forecast, by Application 2020 & 2033
- Table 18: China Slip Additives Industry Volume (kilotons) Forecast, by Application 2020 & 2033
- Table 19: India Slip Additives Industry Revenue (million) Forecast, by Application 2020 & 2033
- Table 20: India Slip Additives Industry Volume (kilotons) Forecast, by Application 2020 & 2033
- Table 21: Japan Slip Additives Industry Revenue (million) Forecast, by Application 2020 & 2033
- Table 22: Japan Slip Additives Industry Volume (kilotons) Forecast, by Application 2020 & 2033
- Table 23: South Korea Slip Additives Industry Revenue (million) Forecast, by Application 2020 & 2033
- Table 24: South Korea Slip Additives Industry Volume (kilotons) Forecast, by Application 2020 & 2033
- Table 25: Rest of Asia Pacific Slip Additives Industry Revenue (million) Forecast, by Application 2020 & 2033
- Table 26: Rest of Asia Pacific Slip Additives Industry Volume (kilotons) Forecast, by Application 2020 & 2033
- Table 27: Global Slip Additives Industry Revenue million Forecast, by Carrier Resin 2020 & 2033
- Table 28: Global Slip Additives Industry Volume kilotons Forecast, by Carrier Resin 2020 & 2033
- Table 29: Global Slip Additives Industry Revenue million Forecast, by Type 2020 & 2033
- Table 30: Global Slip Additives Industry Volume kilotons Forecast, by Type 2020 & 2033
- Table 31: Global Slip Additives Industry Revenue million Forecast, by Application 2020 & 2033
- Table 32: Global Slip Additives Industry Volume kilotons Forecast, by Application 2020 & 2033
- Table 33: Global Slip Additives Industry Revenue million Forecast, by Country 2020 & 2033
- Table 34: Global Slip Additives Industry Volume kilotons Forecast, by Country 2020 & 2033
- Table 35: United States Slip Additives Industry Revenue (million) Forecast, by Application 2020 & 2033
- Table 36: United States Slip Additives Industry Volume (kilotons) Forecast, by Application 2020 & 2033
- Table 37: Canada Slip Additives Industry Revenue (million) Forecast, by Application 2020 & 2033
- Table 38: Canada Slip Additives Industry Volume (kilotons) Forecast, by Application 2020 & 2033
- Table 39: Mexico Slip Additives Industry Revenue (million) Forecast, by Application 2020 & 2033
- Table 40: Mexico Slip Additives Industry Volume (kilotons) Forecast, by Application 2020 & 2033
- Table 41: Global Slip Additives Industry Revenue million Forecast, by Carrier Resin 2020 & 2033
- Table 42: Global Slip Additives Industry Volume kilotons Forecast, by Carrier Resin 2020 & 2033
- Table 43: Global Slip Additives Industry Revenue million Forecast, by Type 2020 & 2033
- Table 44: Global Slip Additives Industry Volume kilotons Forecast, by Type 2020 & 2033
- Table 45: Global Slip Additives Industry Revenue million Forecast, by Application 2020 & 2033
- Table 46: Global Slip Additives Industry Volume kilotons Forecast, by Application 2020 & 2033
- Table 47: Global Slip Additives Industry Revenue million Forecast, by Country 2020 & 2033
- Table 48: Global Slip Additives Industry Volume kilotons Forecast, by Country 2020 & 2033
- Table 49: Germany Slip Additives Industry Revenue (million) Forecast, by Application 2020 & 2033
- Table 50: Germany Slip Additives Industry Volume (kilotons) Forecast, by Application 2020 & 2033
- Table 51: United Kingdom Slip Additives Industry Revenue (million) Forecast, by Application 2020 & 2033
- Table 52: United Kingdom Slip Additives Industry Volume (kilotons) Forecast, by Application 2020 & 2033
- Table 53: Italy Slip Additives Industry Revenue (million) Forecast, by Application 2020 & 2033
- Table 54: Italy Slip Additives Industry Volume (kilotons) Forecast, by Application 2020 & 2033
- Table 55: France Slip Additives Industry Revenue (million) Forecast, by Application 2020 & 2033
- Table 56: France Slip Additives Industry Volume (kilotons) Forecast, by Application 2020 & 2033
- Table 57: Rest of Europe Slip Additives Industry Revenue (million) Forecast, by Application 2020 & 2033
- Table 58: Rest of Europe Slip Additives Industry Volume (kilotons) Forecast, by Application 2020 & 2033
- Table 59: Global Slip Additives Industry Revenue million Forecast, by Carrier Resin 2020 & 2033
- Table 60: Global Slip Additives Industry Volume kilotons Forecast, by Carrier Resin 2020 & 2033
- Table 61: Global Slip Additives Industry Revenue million Forecast, by Type 2020 & 2033
- Table 62: Global Slip Additives Industry Volume kilotons Forecast, by Type 2020 & 2033
- Table 63: Global Slip Additives Industry Revenue million Forecast, by Application 2020 & 2033
- Table 64: Global Slip Additives Industry Volume kilotons Forecast, by Application 2020 & 2033
- Table 65: Global Slip Additives Industry Revenue million Forecast, by Country 2020 & 2033
- Table 66: Global Slip Additives Industry Volume kilotons Forecast, by Country 2020 & 2033
- Table 67: Brazil Slip Additives Industry Revenue (million) Forecast, by Application 2020 & 2033
- Table 68: Brazil Slip Additives Industry Volume (kilotons) Forecast, by Application 2020 & 2033
- Table 69: Argentina Slip Additives Industry Revenue (million) Forecast, by Application 2020 & 2033
- Table 70: Argentina Slip Additives Industry Volume (kilotons) Forecast, by Application 2020 & 2033
- Table 71: Rest of South America Slip Additives Industry Revenue (million) Forecast, by Application 2020 & 2033
- Table 72: Rest of South America Slip Additives Industry Volume (kilotons) Forecast, by Application 2020 & 2033
- Table 73: Global Slip Additives Industry Revenue million Forecast, by Carrier Resin 2020 & 2033
- Table 74: Global Slip Additives Industry Volume kilotons Forecast, by Carrier Resin 2020 & 2033
- Table 75: Global Slip Additives Industry Revenue million Forecast, by Type 2020 & 2033
- Table 76: Global Slip Additives Industry Volume kilotons Forecast, by Type 2020 & 2033
- Table 77: Global Slip Additives Industry Revenue million Forecast, by Application 2020 & 2033
- Table 78: Global Slip Additives Industry Volume kilotons Forecast, by Application 2020 & 2033
- Table 79: Global Slip Additives Industry Revenue million Forecast, by Country 2020 & 2033
- Table 80: Global Slip Additives Industry Volume kilotons Forecast, by Country 2020 & 2033
- Table 81: Saudi Arabia Slip Additives Industry Revenue (million) Forecast, by Application 2020 & 2033
- Table 82: Saudi Arabia Slip Additives Industry Volume (kilotons) Forecast, by Application 2020 & 2033
- Table 83: South Africa Slip Additives Industry Revenue (million) Forecast, by Application 2020 & 2033
- Table 84: South Africa Slip Additives Industry Volume (kilotons) Forecast, by Application 2020 & 2033
- Table 85: Rest of Middle East and Africa Slip Additives Industry Revenue (million) Forecast, by Application 2020 & 2033
- Table 86: Rest of Middle East and Africa Slip Additives Industry Volume (kilotons) Forecast, by Application 2020 & 2033
Frequently Asked Questions
1. What is the projected Compound Annual Growth Rate (CAGR) of the Slip Additives Industry?
The projected CAGR is approximately 5.04%.
2. Which companies are prominent players in the Slip Additives Industry?
Key companies in the market include Fine Organics, PMC Group Inc *List Not Exhaustive, Evonik Industries AG, Croda International Inc, Afron, Emery Oleochemicals, ALTANA, BASF SE, Honeywell International, The Lubrizol Corporation, Lonza.
3. What are the main segments of the Slip Additives Industry?
The market segments include Carrier Resin, Type, Application.
4. Can you provide details about the market size?
The market size is estimated to be USD 280.54 million as of 2022.
5. What are some drivers contributing to market growth?
Increasing Demand from Food & Beverage Packaging Industry; Availability at Low Price Compared to Substitutes; Other Drivers.
6. What are the notable trends driving market growth?
Packaging Application to Dominate the Market.
7. Are there any restraints impacting market growth?
Stringent Environmental Regulations on The Use of Plastics; Other Restraints.
8. Can you provide examples of recent developments in the market?
The recent developments pertaining to the major players in the market are being covered in the complete study.
9. What pricing options are available for accessing the report?
Pricing options include single-user, multi-user, and enterprise licenses priced at USD 4750, USD 5250, and USD 8750 respectively.
10. Is the market size provided in terms of value or volume?
The market size is provided in terms of value, measured in million and volume, measured in kilotons.
11. Are there any specific market keywords associated with the report?
Yes, the market keyword associated with the report is "Slip Additives Industry," which aids in identifying and referencing the specific market segment covered.
12. How do I determine which pricing option suits my needs best?
The pricing options vary based on user requirements and access needs. Individual users may opt for single-user licenses, while businesses requiring broader access may choose multi-user or enterprise licenses for cost-effective access to the report.
13. Are there any additional resources or data provided in the Slip Additives Industry report?
While the report offers comprehensive insights, it's advisable to review the specific contents or supplementary materials provided to ascertain if additional resources or data are available.
14. How can I stay updated on further developments or reports in the Slip Additives Industry?
To stay informed about further developments, trends, and reports in the Slip Additives Industry, consider subscribing to industry newsletters, following relevant companies and organizations, or regularly checking reputable industry news sources and publications.
Methodology
Step 1 - Identification of Relevant Samples Size from Population Database


Step 2 - Approaches for Defining Global Market Size (Value, Volume* & Price*)

Note*: In applicable scenarios
Step 3 - Data Sources
Primary Research
- Web Analytics
- Survey Reports
- Research Institute
- Latest Research Reports
- Opinion Leaders
Secondary Research
- Annual Reports
- White Paper
- Latest Press Release
- Industry Association
- Paid Database
- Investor Presentations

Step 4 - Data Triangulation
Involves using different sources of information in order to increase the validity of a study
These sources are likely to be stakeholders in a program - participants, other researchers, program staff, other community members, and so on.
Then we put all data in single framework & apply various statistical tools to find out the dynamic on the market.
During the analysis stage, feedback from the stakeholder groups would be compared to determine areas of agreement as well as areas of divergence