

Key Insights
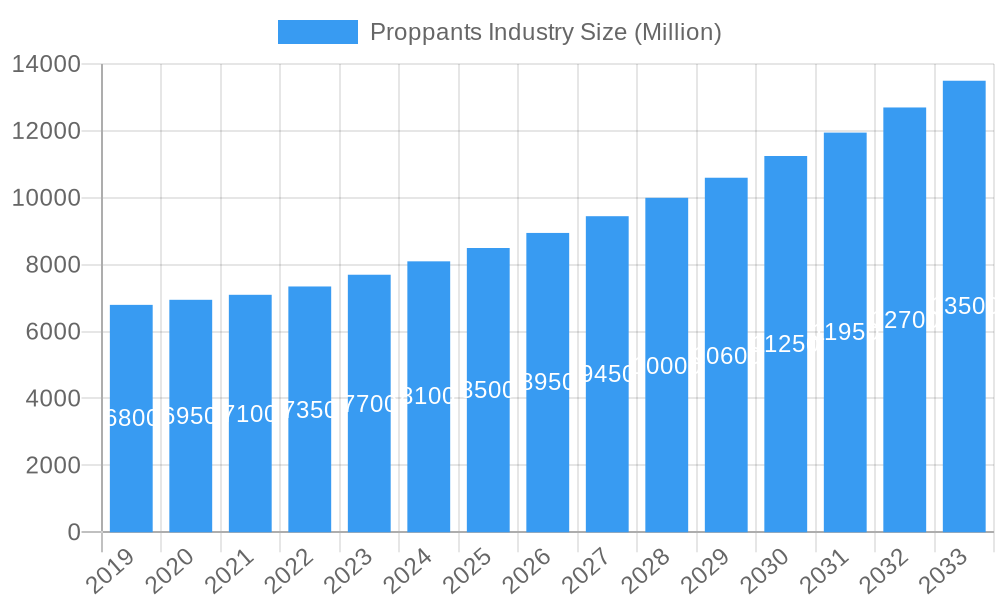
The global Proppants market is projected for substantial expansion, reaching an estimated market size of $8.902 billion by 2025. This growth is driven by a robust Compound Annual Growth Rate (CAGR) of 9.97% from the base year 2025 through 2033. Proppants are essential for hydraulic fracturing in oil and gas extraction, with demand intensifying due to the need for enhanced oil recovery and exploration of unconventional reserves. Advancements in proppant manufacturing, yielding more efficient and sustainable options, are key market dynamics. Increasing global energy demands and the optimization of existing well production further propel the proppant industry. Steady growth from 2019 to 2024 provides a strong foundation for future expansion.
Proppants Industry Market Size (In Billion)
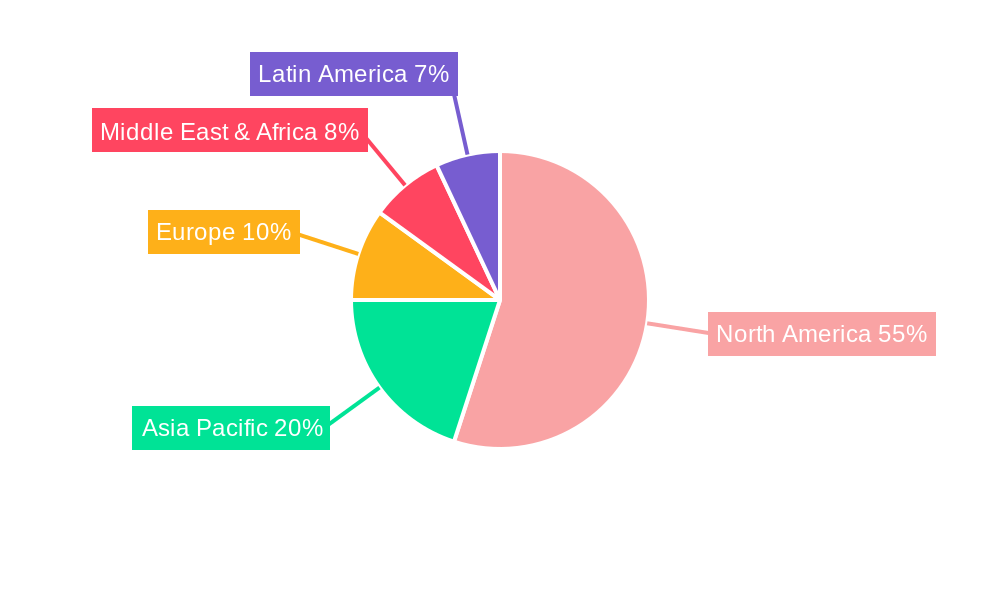
Regional dynamics and sustainability are shaping the proppant market's evolution. While North America leads due to extensive shale gas operations, Asia-Pacific and the Middle East exhibit significant growth potential driven by increased exploration and production investments. The industry is shifting towards high-strength ceramic proppants for improved fracture conductivity and hydrocarbon recovery. Environmental regulations and sustainability awareness are fostering eco-friendlier proppant solutions, with innovations in resin-coated proppants gaining traction for flowback mitigation and reduced environmental impact. Consistent demand from the oil and gas sector ensures a resilient and growing proppant market.
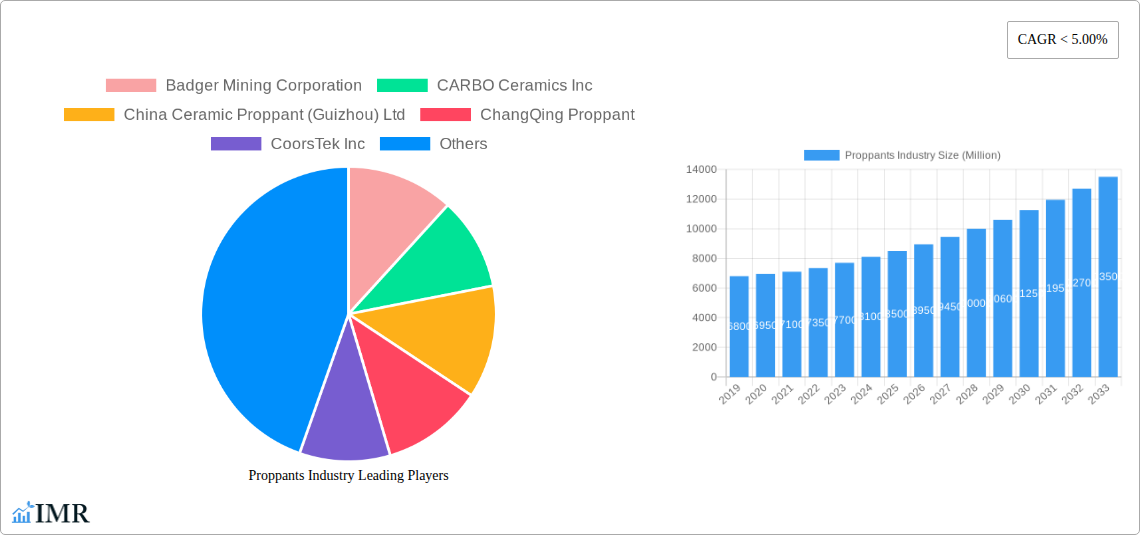
Proppants Industry Company Market Share
Proppants Industry Report: Market Dynamics, Growth Trends, and Future Outlook (2019–2033)
This comprehensive report delivers an in-depth analysis of the global Proppants industry, a critical component of the oil and gas sector, particularly in hydraulic fracturing operations. We meticulously examine market dynamics, growth trends, regional dominance, product landscapes, key drivers, challenges, emerging opportunities, and the strategic moves of leading players. Covering a study period from 2019 to 2033, with a base year of 2025 and a forecast period extending to 2033, this report provides actionable insights for stakeholders seeking to capitalize on the evolving proppants market. All monetary values are presented in millions of units.
Proppants Industry Market Dynamics & Structure
The Proppants market exhibits a moderately concentrated structure, with a few key players dominating market share, particularly in the higher-value ceramic and resin-coated proppant segments. Technological innovation is a significant driver, primarily focused on developing proppants with enhanced strength, conductivity, and resistance to closure stress and chemical degradation, crucial for optimizing hydrocarbon recovery in increasingly challenging reservoir conditions. Regulatory frameworks, though not overtly restrictive on proppant materials themselves, are influenced by broader environmental considerations and the demand for sustainable fracturing fluids and techniques. Competitive product substitutes are primarily defined by advancements in proppant technology, offering alternatives with superior performance metrics. End-user demographics are largely dictated by the exploration and production activities of major oil and gas companies, with a growing emphasis on unconventional resource plays in North America and emerging markets. Mergers and acquisitions (M&A) trends are notable, aimed at expanding product portfolios, consolidating market positions, and integrating complementary services such as fracture diagnostics and simulation, as exemplified by CARBO Ceramics Inc.'s acquisition of Pinnacle Technologies Inc. in May 2022.
- Market Concentration: Dominated by a few major global suppliers, especially in specialized proppant types.
- Technological Innovation Drivers: Demand for higher strength, conductivity, and chemical resistance in advanced proppants.
- Regulatory Frameworks: Indirect influence through environmental regulations and demand for sustainable practices.
- Competitive Product Substitutes: Primarily driven by ongoing proppant material science advancements.
- End-User Demographics: Tied to oil and gas exploration and production activities, particularly unconventional plays.
- M&A Trends: Strategic acquisitions to enhance product offerings and market reach.
Proppants Industry Growth Trends & Insights
The Proppants industry is poised for robust growth, driven by the sustained demand for oil and natural gas, especially from unconventional reserves. The market size is projected to witness a significant expansion, with a projected Compound Annual Growth Rate (CAGR) of approximately 5.5% between 2025 and 2033. This growth is underpinned by the increasing complexity of reservoir targets, necessitating the use of advanced proppants that can withstand higher pressures and temperatures to maintain fracture conductivity. Adoption rates for resin-coated and ceramic proppants are on an upward trajectory as operators recognize their superior performance over traditional frac sand in specific well conditions, leading to higher production efficiency and longer well lifespans. Technological disruptions are continuously emerging, with a focus on nanotechnology-infused proppants offering improved flow assurance and micro-proppants for enhanced fracture network creation. Consumer behavior shifts are evident, with a growing preference for suppliers who offer integrated solutions, including proppant selection guidance, logistics, and performance monitoring. The market penetration of high-performance proppants is expected to increase as operators seek to maximize the economic viability of their wells in a volatile commodity price environment. The global proppant market size in 2025 is estimated to be $12,500 million, projected to reach $18,100 million by 2033.
Dominant Regions, Countries, or Segments in Proppants Industry
The North American region, particularly the United States, stands as the dominant force in the global Proppants industry. This supremacy is primarily attributed to the extensive development of unconventional oil and gas resources, such as shale oil and tight gas formations, which rely heavily on hydraulic fracturing and, consequently, a massive demand for proppants. Within the product segments, Frac Sand continues to hold the largest market share due to its cost-effectiveness and widespread availability, forming the backbone of many fracturing operations. However, Resin Coated and Ceramic proppants are witnessing accelerated growth, driven by their superior performance in challenging downhole conditions, including high-pressure, high-temperature (HPHT) reservoirs and those prone to fines migration.
- Key Drivers in North America:
- Abundant Unconventional Reserves: Extensive shale plays necessitate widespread hydraulic fracturing.
- Technological Advancement: Continuous innovation in fracturing techniques and proppant technology.
- Economic Policies: Favorable policies supporting domestic energy production.
- Infrastructure Development: Well-established oil and gas infrastructure facilitating efficient proppant delivery and deployment.
- Dominance Factors:
- Market Share: The United States accounts for an estimated 70% of the global proppant consumption.
- Growth Potential: Continued exploration and development in existing and emerging shale basins.
- Technological Adoption: Early and rapid adoption of advanced proppant types to optimize production.
- Parent Market Dominance: The North American oil and gas upstream sector's reliance on fracturing directly fuels the proppant parent market. The global proppant market is projected to reach $25,600 million by 2033, with North America representing over 65% of this value.
Proppants Industry Product Landscape
The Proppants industry product landscape is characterized by continuous innovation aimed at enhancing proppant performance for optimized hydraulic fracturing. Frac sand, the most prevalent type, offers a cost-effective solution for many applications, with advancements focusing on grain size consistency and crush resistance. Resin-coated proppants provide enhanced flowback control and conductivity due to their polymer coating, which bonds grains and resists fines migration, making them ideal for longer-lived wells. Ceramic proppants, engineered for extreme downhole conditions, offer unparalleled crush resistance and conductivity at high pressures and temperatures, crucial for deep, complex formations. Innovations are also emerging in biodegradable and lower-density proppants to address environmental concerns and improve fluid recovery. The unique selling proposition for advanced proppants lies in their ability to increase hydrocarbon recovery rates and extend well productivity, directly impacting operator profitability.
Key Drivers, Barriers & Challenges in Proppants Industry
Key Drivers:
- Growing Global Energy Demand: Sustained need for oil and natural gas, particularly from unconventional reserves, directly fuels the demand for fracturing services and proppants.
- Technological Advancements in Fracturing: Development of more efficient and cost-effective fracturing techniques necessitates advanced proppant solutions.
- Exploration and Production in Complex Formations: The push into HPHT and unconventional reservoirs requires proppants with superior strength and conductivity.
- Cost Optimization for Operators: Proppants that enhance production efficiency and well longevity offer a clear return on investment for oil and gas companies.
Key Barriers & Challenges:
- Volatility in Oil and Gas Prices: Fluctuations in commodity prices can impact exploration and production budgets, directly affecting proppant demand.
- Environmental Regulations and Concerns: Increasing scrutiny on hydraulic fracturing and potential impacts on water resources can lead to stricter operational guidelines and demand for more sustainable proppant solutions.
- Supply Chain Disruptions: Geopolitical events, transportation issues, and raw material availability can impact the consistent supply of proppants, especially specialized types.
- Intense Competition and Pricing Pressures: The market, particularly for frac sand, is highly competitive, leading to significant pricing pressures and impacting profit margins.
- Technological Obsolescence: Rapid innovation can render existing proppant technologies less competitive if not continually upgraded.
Emerging Opportunities in Proppants Industry
Emerging opportunities in the Proppants industry lie in the development of sustainable and environmentally friendly proppant solutions. This includes exploring biodegradable proppants derived from renewable resources and proppants with reduced environmental footprints during their manufacturing process. Untapped markets in emerging oil and gas regions, where hydraulic fracturing is gaining traction, present significant growth potential. Furthermore, innovative applications such as proppants for carbon capture and storage (CCS) projects and for geothermal energy extraction are gaining traction. Evolving consumer preferences are also driving demand for suppliers who can offer integrated, data-driven proppant management services, including advanced analytics for proppant placement and performance optimization.
Growth Accelerators in the Proppants Industry Industry
The Proppants industry is experiencing accelerated growth driven by several key factors. Technological breakthroughs in material science are leading to the development of next-generation proppants with unprecedented strength, conductivity, and resistance to downhole conditions. Strategic partnerships between proppant manufacturers, service companies, and E&P operators are fostering collaborative innovation and ensuring that proppant solutions are precisely tailored to specific reservoir challenges. Furthermore, market expansion strategies, including entering new geographical regions with growing unconventional resources and diversifying product portfolios to cater to niche applications, are significant growth accelerators. The integration of digital technologies for proppant logistics and performance monitoring is also enhancing operational efficiency and customer satisfaction, further bolstering growth.
Key Players Shaping the Proppants Industry Market
- Badger Mining Corporation
- CARBO Ceramics Inc
- China Ceramic Proppant (Guizhou) Ltd
- ChangQing Proppant
- CoorsTek Inc
- Covia Holdings LLC
- Eagle Materials Inc
- Emerge Energy Services (Superior Silica Sands)
- Epic Ceramic Proppants Inc
- Fores LTD
- General Electric (Baker Hughes Company)
- Gongyi Yuanyang Ceramsite Co Ltd
- Halliburton
- Henan Tianxiang New Materials Co Ltd
- Hexion
- Nika Petrotech
- Preferred Sands LLC
- Saint-Gobain
- Unimin Energy Solutions (Sibelco)
- U S Silica
- Wanli Proppant
Notable Milestones in Proppants Industry Sector
- May 2022: CARBO Ceramics Inc. announced the acquisition of Pinnacle Technologies Inc., which provides fracture diagnostic services, fracture mapping services, and fracture simulation models. This strategic move is set to enhance CARBO Ceramics' product portfolio for the proppants market by offering integrated solutions that improve well performance and operational efficiency.
In-Depth Proppants Industry Market Outlook
The future of the Proppants industry is exceptionally promising, fueled by ongoing global energy demands and continuous innovation. Growth accelerators like advanced material science, strategic collaborations between industry leaders, and expansion into emerging markets are paving the way for sustained expansion. The increasing sophistication of hydraulic fracturing techniques, coupled with the drive to maximize recovery from complex geological formations, will continue to propel the demand for high-performance proppants. Furthermore, the development of more sustainable and environmentally conscious proppant solutions presents significant future market potential, aligning with global sustainability trends. Strategic opportunities lie in further integrating proppant supply chains with digital technologies for enhanced traceability and performance analytics, as well as in exploring novel applications for proppants beyond traditional oil and gas extraction, such as in advanced materials and renewable energy sectors. The estimated market size for proppants in 2025 is $12,500 million.
Proppants Industry Segmentation
-
1. Product Type
- 1.1. Frac Sand
- 1.2. Resin Coated
- 1.3. Ceramics
Proppants Industry Segmentation By Geography
-
1. Asia Pacific
- 1.1. China
- 1.2. India
- 1.3. Indonesia
- 1.4. Malaysia
- 1.5. Thailand
- 1.6. Vietnam
- 1.7. Rest of Asia Pacific
-
2. North America
- 2.1. United States
- 2.2. Canada
- 2.3. Mexico
-
3. Europe
- 3.1. Germany
- 3.2. United Kingdom
- 3.3. Russia
- 3.4. Norway
- 3.5. Rest of Europe
-
4. South America
- 4.1. Brazil
- 4.2. Argentina
- 4.3. Rest of South America
-
5. Middle East and Africa
- 5.1. Saudi Arabia
- 5.2. South Africa
- 5.3. Rest of Middle East and Africa
Proppants Industry Regional Market Share
Geographic Coverage of Proppants Industry
Proppants Industry REPORT HIGHLIGHTS
| Aspects | Details |
|---|---|
| Study Period | 2020-2034 |
| Base Year | 2025 |
| Estimated Year | 2026 |
| Forecast Period | 2026-2034 |
| Historical Period | 2020-2025 |
| Growth Rate | CAGR of 9.97% from 2020-2034 |
| Segmentation |
|
Table of Contents
- 1. Introduction
- 1.1. Research Scope
- 1.2. Market Segmentation
- 1.3. Research Objective
- 1.4. Definitions and Assumptions
- 2. Executive Summary
- 2.1. Market Snapshot
- 3. Market Dynamics
- 3.1. Market Drivers
- 3.2. Market Restrains
- 3.3. Market Trends
- 3.4. Market Opportunities
- 4. Market Factor Analysis
- 4.1. Porters Five Forces
- 4.1.1. Bargaining Power of Suppliers
- 4.1.2. Bargaining Power of Buyers
- 4.1.3. Threat of New Entrants
- 4.1.4. Threat of Substitutes
- 4.1.5. Competitive Rivalry
- 4.2. PESTEL analysis
- 4.3. BCG Analysis
- 4.3.1. Stars (High Growth, High Market Share)
- 4.3.2. Cash Cows (Low Growth, High Market Share)
- 4.3.3. Question Mark (High Growth, Low Market Share)
- 4.3.4. Dogs (Low Growth, Low Market Share)
- 4.4. Ansoff Matrix Analysis
- 4.5. Supply Chain Analysis
- 4.6. Regulatory Landscape
- 4.7. Current Market Potential and Opportunity Assessment (TAM–SAM–SOM Framework)
- 4.8. IMR Analyst Note
- 4.1. Porters Five Forces
- 5. Market Analysis, Insights and Forecast 2021-2033
- 5.1. Market Analysis, Insights and Forecast - by Product Type
- 5.1.1. Frac Sand
- 5.1.2. Resin Coated
- 5.1.3. Ceramics
- 5.2. Market Analysis, Insights and Forecast - by Region
- 5.2.1. Asia Pacific
- 5.2.2. North America
- 5.2.3. Europe
- 5.2.4. South America
- 5.2.5. Middle East and Africa
- 5.1. Market Analysis, Insights and Forecast - by Product Type
- 6. Global Proppants Industry Analysis, Insights and Forecast, 2021-2033
- 6.1. Market Analysis, Insights and Forecast - by Product Type
- 6.1.1. Frac Sand
- 6.1.2. Resin Coated
- 6.1.3. Ceramics
- 6.1. Market Analysis, Insights and Forecast - by Product Type
- 7. Asia Pacific Proppants Industry Analysis, Insights and Forecast, 2020-2032
- 7.1. Market Analysis, Insights and Forecast - by Product Type
- 7.1.1. Frac Sand
- 7.1.2. Resin Coated
- 7.1.3. Ceramics
- 7.1. Market Analysis, Insights and Forecast - by Product Type
- 8. North America Proppants Industry Analysis, Insights and Forecast, 2020-2032
- 8.1. Market Analysis, Insights and Forecast - by Product Type
- 8.1.1. Frac Sand
- 8.1.2. Resin Coated
- 8.1.3. Ceramics
- 8.1. Market Analysis, Insights and Forecast - by Product Type
- 9. Europe Proppants Industry Analysis, Insights and Forecast, 2020-2032
- 9.1. Market Analysis, Insights and Forecast - by Product Type
- 9.1.1. Frac Sand
- 9.1.2. Resin Coated
- 9.1.3. Ceramics
- 9.1. Market Analysis, Insights and Forecast - by Product Type
- 10. South America Proppants Industry Analysis, Insights and Forecast, 2020-2032
- 10.1. Market Analysis, Insights and Forecast - by Product Type
- 10.1.1. Frac Sand
- 10.1.2. Resin Coated
- 10.1.3. Ceramics
- 10.1. Market Analysis, Insights and Forecast - by Product Type
- 11. Middle East and Africa Proppants Industry Analysis, Insights and Forecast, 2020-2032
- 11.1. Market Analysis, Insights and Forecast - by Product Type
- 11.1.1. Frac Sand
- 11.1.2. Resin Coated
- 11.1.3. Ceramics
- 11.1. Market Analysis, Insights and Forecast - by Product Type
- 12. Competitive Analysis
- 12.1. Company Profiles
- 12.1.1 Badger Mining Corporation
- 12.1.1.1. Company Overview
- 12.1.1.2. Products
- 12.1.1.3. Company Financials
- 12.1.1.4. SWOT Analysis
- 12.1.2 CARBO Ceramics Inc
- 12.1.2.1. Company Overview
- 12.1.2.2. Products
- 12.1.2.3. Company Financials
- 12.1.2.4. SWOT Analysis
- 12.1.3 China Ceramic Proppant (Guizhou) Ltd
- 12.1.3.1. Company Overview
- 12.1.3.2. Products
- 12.1.3.3. Company Financials
- 12.1.3.4. SWOT Analysis
- 12.1.4 ChangQing Proppant
- 12.1.4.1. Company Overview
- 12.1.4.2. Products
- 12.1.4.3. Company Financials
- 12.1.4.4. SWOT Analysis
- 12.1.5 CoorsTek Inc
- 12.1.5.1. Company Overview
- 12.1.5.2. Products
- 12.1.5.3. Company Financials
- 12.1.5.4. SWOT Analysis
- 12.1.6 Covia Holdings LLC
- 12.1.6.1. Company Overview
- 12.1.6.2. Products
- 12.1.6.3. Company Financials
- 12.1.6.4. SWOT Analysis
- 12.1.7 Eagle Materials Inc
- 12.1.7.1. Company Overview
- 12.1.7.2. Products
- 12.1.7.3. Company Financials
- 12.1.7.4. SWOT Analysis
- 12.1.8 Emerge Energy Services (Superior Silica Sands)
- 12.1.8.1. Company Overview
- 12.1.8.2. Products
- 12.1.8.3. Company Financials
- 12.1.8.4. SWOT Analysis
- 12.1.9 Epic Ceramic Proppants Inc
- 12.1.9.1. Company Overview
- 12.1.9.2. Products
- 12.1.9.3. Company Financials
- 12.1.9.4. SWOT Analysis
- 12.1.10 Fores LTD
- 12.1.10.1. Company Overview
- 12.1.10.2. Products
- 12.1.10.3. Company Financials
- 12.1.10.4. SWOT Analysis
- 12.1.11 General Electric (Baker Hughes Company)
- 12.1.11.1. Company Overview
- 12.1.11.2. Products
- 12.1.11.3. Company Financials
- 12.1.11.4. SWOT Analysis
- 12.1.12 Gongyi Yuanyang Ceramsite Co Ltd
- 12.1.12.1. Company Overview
- 12.1.12.2. Products
- 12.1.12.3. Company Financials
- 12.1.12.4. SWOT Analysis
- 12.1.13 Halliburton
- 12.1.13.1. Company Overview
- 12.1.13.2. Products
- 12.1.13.3. Company Financials
- 12.1.13.4. SWOT Analysis
- 12.1.14 Henan Tianxiang New Materials Co Ltd
- 12.1.14.1. Company Overview
- 12.1.14.2. Products
- 12.1.14.3. Company Financials
- 12.1.14.4. SWOT Analysis
- 12.1.15 Hexion
- 12.1.15.1. Company Overview
- 12.1.15.2. Products
- 12.1.15.3. Company Financials
- 12.1.15.4. SWOT Analysis
- 12.1.16 Nika Petrotech
- 12.1.16.1. Company Overview
- 12.1.16.2. Products
- 12.1.16.3. Company Financials
- 12.1.16.4. SWOT Analysis
- 12.1.17 Preferred Sands LLC
- 12.1.17.1. Company Overview
- 12.1.17.2. Products
- 12.1.17.3. Company Financials
- 12.1.17.4. SWOT Analysis
- 12.1.18 Saint-Gobain
- 12.1.18.1. Company Overview
- 12.1.18.2. Products
- 12.1.18.3. Company Financials
- 12.1.18.4. SWOT Analysis
- 12.1.19 Unimin Energy Solutions (Sibelco)
- 12.1.19.1. Company Overview
- 12.1.19.2. Products
- 12.1.19.3. Company Financials
- 12.1.19.4. SWOT Analysis
- 12.1.20 U S Silica
- 12.1.20.1. Company Overview
- 12.1.20.2. Products
- 12.1.20.3. Company Financials
- 12.1.20.4. SWOT Analysis
- 12.1.21 Wanli Proppant*List Not Exhaustive
- 12.1.21.1. Company Overview
- 12.1.21.2. Products
- 12.1.21.3. Company Financials
- 12.1.21.4. SWOT Analysis
- 12.1.1 Badger Mining Corporation
- 12.2. Market Entropy
- 12.2.1 Company's Key Areas Served
- 12.2.2 Recent Developments
- 12.3. Company Market Share Analysis 2025
- 12.3.1 Top 5 Companies Market Share Analysis
- 12.3.2 Top 3 Companies Market Share Analysis
- 12.4. List of Potential Customers
- 13. Research Methodology
List of Figures
- Figure 1: Global Proppants Industry Revenue Breakdown (billion, %) by Region 2025 & 2033
- Figure 2: Asia Pacific Proppants Industry Revenue (billion), by Product Type 2025 & 2033
- Figure 3: Asia Pacific Proppants Industry Revenue Share (%), by Product Type 2025 & 2033
- Figure 4: Asia Pacific Proppants Industry Revenue (billion), by Country 2025 & 2033
- Figure 5: Asia Pacific Proppants Industry Revenue Share (%), by Country 2025 & 2033
- Figure 6: North America Proppants Industry Revenue (billion), by Product Type 2025 & 2033
- Figure 7: North America Proppants Industry Revenue Share (%), by Product Type 2025 & 2033
- Figure 8: North America Proppants Industry Revenue (billion), by Country 2025 & 2033
- Figure 9: North America Proppants Industry Revenue Share (%), by Country 2025 & 2033
- Figure 10: Europe Proppants Industry Revenue (billion), by Product Type 2025 & 2033
- Figure 11: Europe Proppants Industry Revenue Share (%), by Product Type 2025 & 2033
- Figure 12: Europe Proppants Industry Revenue (billion), by Country 2025 & 2033
- Figure 13: Europe Proppants Industry Revenue Share (%), by Country 2025 & 2033
- Figure 14: South America Proppants Industry Revenue (billion), by Product Type 2025 & 2033
- Figure 15: South America Proppants Industry Revenue Share (%), by Product Type 2025 & 2033
- Figure 16: South America Proppants Industry Revenue (billion), by Country 2025 & 2033
- Figure 17: South America Proppants Industry Revenue Share (%), by Country 2025 & 2033
- Figure 18: Middle East and Africa Proppants Industry Revenue (billion), by Product Type 2025 & 2033
- Figure 19: Middle East and Africa Proppants Industry Revenue Share (%), by Product Type 2025 & 2033
- Figure 20: Middle East and Africa Proppants Industry Revenue (billion), by Country 2025 & 2033
- Figure 21: Middle East and Africa Proppants Industry Revenue Share (%), by Country 2025 & 2033
List of Tables
- Table 1: Global Proppants Industry Revenue billion Forecast, by Product Type 2020 & 2033
- Table 2: Global Proppants Industry Revenue billion Forecast, by Region 2020 & 2033
- Table 3: Global Proppants Industry Revenue billion Forecast, by Product Type 2020 & 2033
- Table 4: Global Proppants Industry Revenue billion Forecast, by Country 2020 & 2033
- Table 5: China Proppants Industry Revenue (billion) Forecast, by Application 2020 & 2033
- Table 6: India Proppants Industry Revenue (billion) Forecast, by Application 2020 & 2033
- Table 7: Indonesia Proppants Industry Revenue (billion) Forecast, by Application 2020 & 2033
- Table 8: Malaysia Proppants Industry Revenue (billion) Forecast, by Application 2020 & 2033
- Table 9: Thailand Proppants Industry Revenue (billion) Forecast, by Application 2020 & 2033
- Table 10: Vietnam Proppants Industry Revenue (billion) Forecast, by Application 2020 & 2033
- Table 11: Rest of Asia Pacific Proppants Industry Revenue (billion) Forecast, by Application 2020 & 2033
- Table 12: Global Proppants Industry Revenue billion Forecast, by Product Type 2020 & 2033
- Table 13: Global Proppants Industry Revenue billion Forecast, by Country 2020 & 2033
- Table 14: United States Proppants Industry Revenue (billion) Forecast, by Application 2020 & 2033
- Table 15: Canada Proppants Industry Revenue (billion) Forecast, by Application 2020 & 2033
- Table 16: Mexico Proppants Industry Revenue (billion) Forecast, by Application 2020 & 2033
- Table 17: Global Proppants Industry Revenue billion Forecast, by Product Type 2020 & 2033
- Table 18: Global Proppants Industry Revenue billion Forecast, by Country 2020 & 2033
- Table 19: Germany Proppants Industry Revenue (billion) Forecast, by Application 2020 & 2033
- Table 20: United Kingdom Proppants Industry Revenue (billion) Forecast, by Application 2020 & 2033
- Table 21: Russia Proppants Industry Revenue (billion) Forecast, by Application 2020 & 2033
- Table 22: Norway Proppants Industry Revenue (billion) Forecast, by Application 2020 & 2033
- Table 23: Rest of Europe Proppants Industry Revenue (billion) Forecast, by Application 2020 & 2033
- Table 24: Global Proppants Industry Revenue billion Forecast, by Product Type 2020 & 2033
- Table 25: Global Proppants Industry Revenue billion Forecast, by Country 2020 & 2033
- Table 26: Brazil Proppants Industry Revenue (billion) Forecast, by Application 2020 & 2033
- Table 27: Argentina Proppants Industry Revenue (billion) Forecast, by Application 2020 & 2033
- Table 28: Rest of South America Proppants Industry Revenue (billion) Forecast, by Application 2020 & 2033
- Table 29: Global Proppants Industry Revenue billion Forecast, by Product Type 2020 & 2033
- Table 30: Global Proppants Industry Revenue billion Forecast, by Country 2020 & 2033
- Table 31: Saudi Arabia Proppants Industry Revenue (billion) Forecast, by Application 2020 & 2033
- Table 32: South Africa Proppants Industry Revenue (billion) Forecast, by Application 2020 & 2033
- Table 33: Rest of Middle East and Africa Proppants Industry Revenue (billion) Forecast, by Application 2020 & 2033
Frequently Asked Questions
1. What is the projected Compound Annual Growth Rate (CAGR) of the Proppants Industry?
The projected CAGR is approximately 9.97%.
2. Which companies are prominent players in the Proppants Industry?
Key companies in the market include Badger Mining Corporation, CARBO Ceramics Inc, China Ceramic Proppant (Guizhou) Ltd, ChangQing Proppant, CoorsTek Inc, Covia Holdings LLC, Eagle Materials Inc, Emerge Energy Services (Superior Silica Sands), Epic Ceramic Proppants Inc, Fores LTD, General Electric (Baker Hughes Company), Gongyi Yuanyang Ceramsite Co Ltd, Halliburton, Henan Tianxiang New Materials Co Ltd, Hexion, Nika Petrotech, Preferred Sands LLC, Saint-Gobain, Unimin Energy Solutions (Sibelco), U S Silica, Wanli Proppant*List Not Exhaustive.
3. What are the main segments of the Proppants Industry?
The market segments include Product Type.
4. Can you provide details about the market size?
The market size is estimated to be USD 8.902 billion as of 2022.
5. What are some drivers contributing to market growth?
Improvements in Fracking Technology; Increasing Shale Gas Production Activities.
6. What are the notable trends driving market growth?
Frac Sand Segment Expected to Dominate the Market.
7. Are there any restraints impacting market growth?
Improvements in Fracking Technology; Increasing Shale Gas Production Activities.
8. Can you provide examples of recent developments in the market?
May 2022: CARBO Ceramics Inc. announced the acquisition of Pinnacle Technologies Inc., which provides fracture diagnostic services, fracture mapping services, and fracture simulation models. It will enhance the company's product portfolio for the proppants market.
9. What pricing options are available for accessing the report?
Pricing options include single-user, multi-user, and enterprise licenses priced at USD 4750, USD 5250, and USD 8750 respectively.
10. Is the market size provided in terms of value or volume?
The market size is provided in terms of value, measured in billion.
11. Are there any specific market keywords associated with the report?
Yes, the market keyword associated with the report is "Proppants Industry," which aids in identifying and referencing the specific market segment covered.
12. How do I determine which pricing option suits my needs best?
The pricing options vary based on user requirements and access needs. Individual users may opt for single-user licenses, while businesses requiring broader access may choose multi-user or enterprise licenses for cost-effective access to the report.
13. Are there any additional resources or data provided in the Proppants Industry report?
While the report offers comprehensive insights, it's advisable to review the specific contents or supplementary materials provided to ascertain if additional resources or data are available.
14. How can I stay updated on further developments or reports in the Proppants Industry?
To stay informed about further developments, trends, and reports in the Proppants Industry, consider subscribing to industry newsletters, following relevant companies and organizations, or regularly checking reputable industry news sources and publications.
Methodology
Step 1 - Identification of Relevant Samples Size from Population Database


Step 2 - Approaches for Defining Global Market Size (Value, Volume* & Price*)

Note*: In applicable scenarios
Step 3 - Data Sources
Primary Research
- Web Analytics
- Survey Reports
- Research Institute
- Latest Research Reports
- Opinion Leaders
Secondary Research
- Annual Reports
- White Paper
- Latest Press Release
- Industry Association
- Paid Database
- Investor Presentations

Step 4 - Data Triangulation
Involves using different sources of information in order to increase the validity of a study
These sources are likely to be stakeholders in a program - participants, other researchers, program staff, other community members, and so on.
Then we put all data in single framework & apply various statistical tools to find out the dynamic on the market.
During the analysis stage, feedback from the stakeholder groups would be compared to determine areas of agreement as well as areas of divergence