

Key Insights
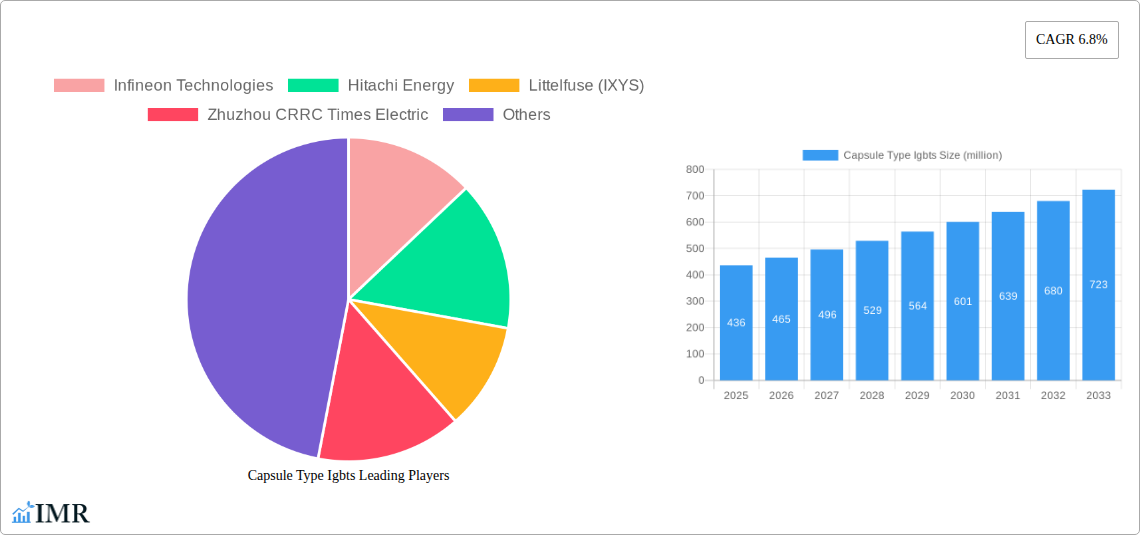
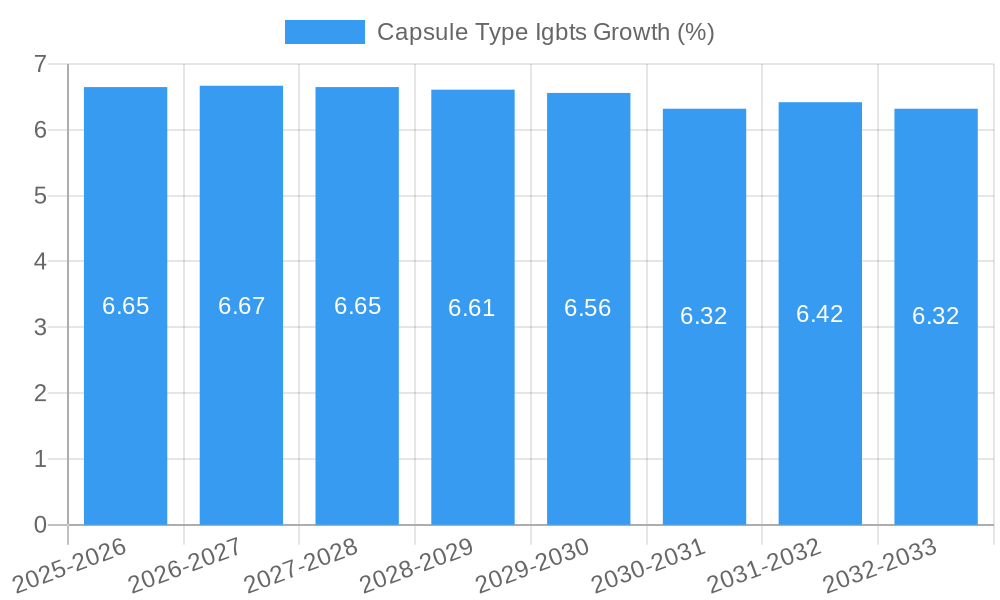
The global market for Capsule Type IGBTs is poised for significant expansion, projected to reach \$436 million with a Compound Annual Growth Rate (CAGR) of 6.8% between 2025 and 2033. This robust growth is primarily fueled by the escalating demand for high-power electronic devices across various critical sectors. The increasing adoption of High Voltage Direct Current (HVDC) and Flexible AC Transmission Systems (FACTS) for efficient power transmission, alongside the burgeoning renewable energy landscape, particularly wind power, are major drivers. Wind turbine converters, a key application segment, are experiencing substantial growth due to global initiatives to increase renewable energy capacity. Furthermore, the traction segment, encompassing electric vehicles and high-speed rail, is witnessing a surge in demand for reliable and efficient power semiconductor solutions like Capsule Type IGBTs.
The market's growth trajectory is further supported by advancements in technology leading to the development of higher voltage ratings, such as 4500 V and 6000 V, catering to more demanding industrial applications. The increasing focus on grid modernization and the integration of smart grid technologies also contribute to market expansion. While the market exhibits strong growth, certain restraints could influence its pace. These may include the high initial investment costs for advanced manufacturing facilities and the need for continuous research and development to keep pace with evolving technological standards and efficiency requirements. However, the overall outlook remains exceptionally positive, driven by innovation and the indispensable role of Capsule Type IGBTs in shaping a more sustainable and electrified future.
Capsule Type IGBTs Market Report: Dynamics, Trends, and Future Outlook (2019-2033)
This comprehensive report offers an in-depth analysis of the global Capsule Type Insulated Gate Bipolar Transistor (IGBT) market, examining its intricate dynamics, growth trajectories, and future potential. Covering a study period from 2019 to 2033, with a base and estimated year of 2025, this report provides critical insights for industry stakeholders, investors, and decision-makers. We meticulously analyze market segmentation by application and voltage type, identify dominant regions and key players, and explore the technological advancements, challenges, and emerging opportunities shaping this vital sector. The report presents all quantitative values in million units, ensuring a clear and actionable understanding of market size and growth.
Capsule Type Igbts Market Dynamics & Structure
The global Capsule Type IGBT market exhibits a moderately consolidated structure, with a few key players holding significant market share. Technological innovation is a primary driver, fueled by the increasing demand for higher efficiency, greater power density, and improved thermal management in power electronic applications. Regulatory frameworks, particularly those promoting renewable energy adoption and electric vehicle (EV) penetration, are also playing a crucial role in shaping market demand. Competitive product substitutes, while present in some niche applications, are largely outpaced by the superior performance characteristics of capsule IGBTs in high-power scenarios. End-user demographics are increasingly shifting towards industries with substantial power conversion needs, such as renewable energy generation, electric mobility, and industrial automation. Mergers and acquisitions (M&A) trends, though not rampant, are strategically driven by companies seeking to expand their product portfolios, enhance technological capabilities, or gain access to new markets. For instance, recent M&A activity has focused on acquiring specialized expertise in advanced packaging and silicon carbide (SiC) integration, indicating a forward-looking approach within the industry. The overall market concentration remains influenced by the significant R&D investments required for advanced IGBT development.
- Market Concentration: Moderately consolidated with a few dominant players.
- Technological Innovation Drivers: Demand for higher efficiency, power density, and thermal management.
- Regulatory Frameworks: Support for renewable energy and EV adoption.
- Competitive Product Substitutes: Limited in high-power applications.
- End-User Demographics: Shift towards renewable energy, electric mobility, and industrial automation sectors.
- M&A Trends: Strategic acquisitions for portfolio expansion and technological enhancement.
Capsule Type Igbts Growth Trends & Insights
The global Capsule Type IGBT market is poised for robust growth, projected to expand at a significant Compound Annual Growth Rate (CAGR) during the forecast period. This expansion is primarily driven by the escalating global demand for efficient and reliable power conversion solutions across a spectrum of high-power applications. The market size is estimated to reach approximately $8,500 million by 2033, up from an estimated $4,800 million in 2025. Adoption rates for capsule IGBTs are steadily increasing, particularly in sectors like HVDC and FACTS, where their inherent ability to handle high voltages and currents is indispensable for grid stability and efficient power transmission. Wind turbine converters represent another substantial growth avenue, as the renewable energy sector continues its aggressive expansion to meet climate change mitigation goals. The electrification of transportation, encompassing trains and emerging electric heavy-duty vehicles, is also a major catalyst, driving the demand for robust and high-performance traction inverters powered by capsule IGBTs.
Technological disruptions, such as the integration of advanced materials like silicon carbide (SiC) and gallium nitride (GaN) alongside traditional silicon, are expected to further enhance the performance characteristics of capsule IGBTs, leading to even greater efficiency and power density. These advancements will unlock new application possibilities and improve the overall cost-effectiveness of power electronic systems. Consumer behavior shifts, particularly the growing awareness and preference for sustainable energy solutions and electric mobility, indirectly fuel the demand for the underlying power electronic components. The increasing adoption of smart grid technologies and the need for reliable power management in large-scale industrial drives further contribute to the market's upward trajectory. The market penetration of capsule IGBTs is expected to deepen as their benefits in terms of reliability, longevity, and performance become more widely recognized and integrated into next-generation power systems. Furthermore, the ongoing digitalization of industries and the rise of the Internet of Things (IoT) are creating a need for more sophisticated and efficient power management solutions, which capsule IGBTs are well-suited to address. The development of advanced cooling techniques and packaging technologies will also play a pivotal role in sustaining and accelerating this growth, enabling higher operational temperatures and power handling capabilities. The base year value for 2025 is projected to be around $4,800 million, indicating a substantial starting point for the forecast period.
Dominant Regions, Countries, or Segments in Capsule Type Igbts
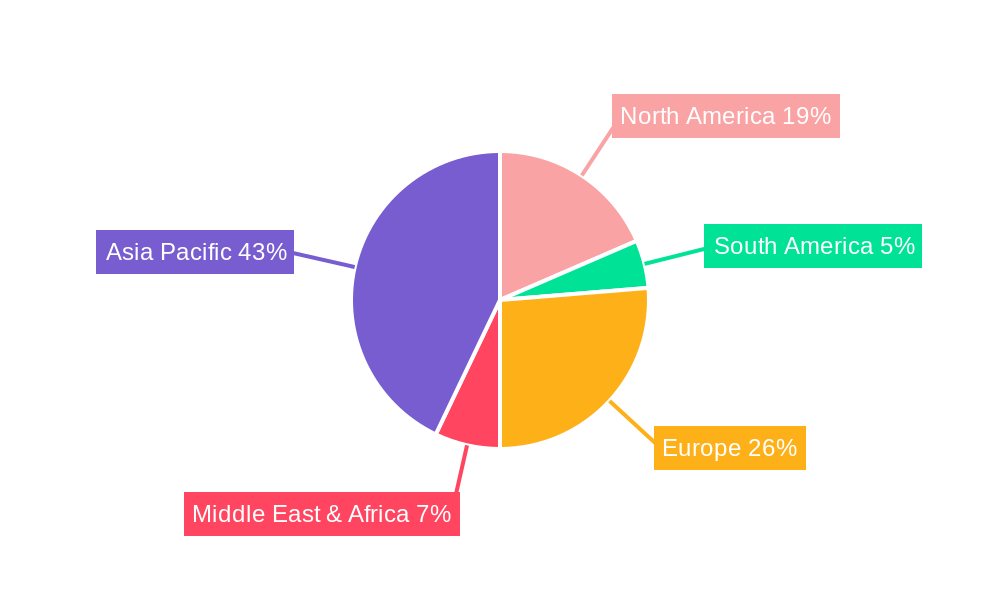
The global Capsule Type IGBT market is witnessing significant growth across multiple segments and regions, with Asia Pacific emerging as the dominant force. This region's leadership is underpinned by a confluence of factors including rapid industrialization, substantial government investments in renewable energy infrastructure, and the burgeoning electric vehicle market. Within Asia Pacific, China stands out as the single most influential country, driven by its massive manufacturing capabilities, ambitious renewable energy targets, and extensive investments in high-speed rail and grid modernization projects.
Among the application segments, HVDC & FACTS is a critical driver of market growth. The increasing need for efficient long-distance power transmission and grid stabilization globally, coupled with substantial investments in intercontinental power grids and renewable energy integration, makes this segment a cornerstone of demand. The market share for HVDC & FACTS applications within the capsule IGBT sector is estimated to be around 28% in 2025.
The Wind Turbine Converters segment is another significant contributor to market expansion. As global efforts to combat climate change intensify, the deployment of wind energy capacity continues to surge, necessitating high-performance IGBTs for efficient power conversion in wind turbines. This segment is projected to account for approximately 22% of the market share in 2025.
The Traction segment, encompassing electric trains and emerging electric heavy-duty vehicles, is experiencing exponential growth. Government initiatives promoting sustainable transportation and the increasing adoption of electric mobility solutions are fueling demand for robust and reliable traction inverters, contributing an estimated 19% market share in 2025.
The DC Breaker & MV Drives segment, vital for grid protection and industrial motor control, also plays a crucial role, representing an estimated 15% market share in 2025. Large-scale industrial drives, catering to manufacturing, mining, and other heavy industries, form another substantial segment, contributing approximately 10% of the market share in 2025. The 'Others' segment, encompassing niche applications, makes up the remaining percentage.
In terms of voltage types, the 4500 V and 6000 V segments are particularly dominant due to their suitability for the high-voltage requirements of HVDC, FACTS, and large-scale industrial applications. The 2500 V segment also holds significant importance, especially for traction and wind power applications. The 1700 V segment, while catering to a wider range of applications, sees relatively lower average power demands compared to the higher voltage variants. The overall market in 2025 is valued at approximately $4,800 million.
- Dominant Region: Asia Pacific
- Key Country: China
- Leading Application Segments:
- HVDC & FACTS (approx. 28% market share in 2025)
- Wind Turbine Converters (approx. 22% market share in 2025)
- Traction (approx. 19% market share in 2025)
- DC Breaker & MV Drives (approx. 15% market share in 2025)
- Large-scale Industrial Drive (approx. 10% market share in 2025)
- Dominant Voltage Types: 4500 V and 6000 V for high-power applications.
- Growth Drivers: Industrialization, renewable energy mandates, EV adoption, grid modernization, sustainable transportation initiatives.
Capsule Type Igbts Product Landscape
The capsule type IGBT product landscape is characterized by continuous innovation focused on enhancing power handling capabilities, improving energy efficiency, and extending product lifespan. Leading manufacturers are developing advanced module designs that optimize thermal management, allowing for higher power densities and reduced cooling system requirements. Innovations include the integration of advanced materials and sophisticated interconnection technologies to minimize parasitic inductance and resistance, thereby boosting performance and reliability. Applications span across critical sectors such as high-voltage direct current (HVDC) transmission systems, flexible AC transmission systems (FACTS), wind turbine converters, electric traction systems, DC breakers, and large-scale industrial drives. Unique selling propositions often revolve around superior short-circuit handling capabilities, excellent thermal cycling performance, and reduced switching losses, crucial for demanding industrial environments. Technological advancements are also geared towards miniaturization and modularity, enabling greater design flexibility for end-product manufacturers.
Key Drivers, Barriers & Challenges in Capsule Type Igbts
Key Drivers:
- Global Shift Towards Renewable Energy: The increasing adoption of solar, wind, and other renewable energy sources necessitates efficient power conversion, directly boosting demand for capsule IGBTs in converters and inverters.
- Electrification of Transportation: The rapid growth of electric vehicles (EVs), including trains, buses, and heavy-duty trucks, requires high-performance IGBTs for traction systems and charging infrastructure.
- Industrial Automation and Motor Drives: The ongoing digitalization and automation of industries across the globe drive the demand for robust and efficient motor control solutions powered by advanced IGBTs.
- HVDC and FACTS for Grid Modernization: Investments in upgrading and expanding power grids, particularly for long-distance transmission and grid stability, significantly boost the requirement for high-voltage capsule IGBTs.
- Technological Advancements: Continuous improvements in materials science, packaging, and semiconductor fabrication are leading to more efficient, compact, and reliable capsule IGBTs.
Barriers & Challenges:
- High Research and Development Costs: Developing cutting-edge capsule IGBT technology requires substantial investment in R&D, creating a barrier to entry for smaller players.
- Supply Chain Volatility and Material Costs: Fluctuations in the availability and cost of raw materials, such as silicon wafers and specialized metals, can impact production costs and lead times. The global semiconductor shortage has also presented challenges.
- Intense Competition and Pricing Pressures: The market, while consolidating, still faces competitive pricing pressures, particularly from established players with economies of scale.
- Complexity of Integration: Integrating high-power capsule IGBT modules into complex power electronic systems requires specialized engineering expertise, which can be a bottleneck for some end-users.
- Emergence of Alternative Technologies: While dominant, capsule IGBTs face ongoing competition from emerging technologies like Silicon Carbide (SiC) and Gallium Nitride (GaN) devices, which offer potential advantages in specific niche applications.
Emerging Opportunities in Capsule Type Igbts
Emerging opportunities in the capsule type IGBT market lie in the expanding applications for renewable energy integration, such as offshore wind farms and advanced grid management systems. The burgeoning sector of electric heavy-duty vehicles and industrial machinery presents a significant untapped market for high-power IGBTs. Furthermore, the increasing adoption of smart grids and microgrids worldwide will drive demand for more intelligent and modular power electronic solutions. The development of advanced packaging technologies that enable higher operating temperatures and reduced form factors will unlock new possibilities in compact power systems and electric propulsion for aviation and maritime applications. Opportunities also exist in providing customized IGBT solutions for highly specialized industrial processes and in emerging markets with significant infrastructure development plans.
Growth Accelerators in the Capsule Type Igbts Industry
Several catalysts are driving long-term growth in the capsule type IGBT industry. Firstly, the relentless pursuit of energy efficiency across all sectors, from industrial operations to transportation, is a primary growth accelerator. Governments worldwide are setting increasingly stringent energy efficiency standards, making advanced power semiconductor solutions like capsule IGBTs indispensable. Secondly, strategic partnerships between IGBT manufacturers and leading system integrators in industries like renewable energy and electric mobility are fostering innovation and accelerating product adoption. These collaborations ensure that IGBT technology aligns with the evolving needs of these critical sectors. Thirdly, the ongoing expansion of manufacturing capacity by key players, often coupled with investments in advanced fabrication processes, is crucial for meeting the rising global demand and maintaining competitive pricing. Finally, the continuous drive towards electrification in various domains, from building management systems to industrial processes, presents a sustained and expanding market for capsule IGBTs.
Key Players Shaping the Capsule Type Igbts Market
- Infineon Technologies
- Hitachi Energy
- Littelfuse (IXYS)
- Zhuzhou CRRC Times Electric
- Mitsubishi Electric (Vincotech)
Notable Milestones in Capsule Type Igbts Sector
- 2019: Introduction of advanced silicon carbide (SiC) based IGBT modules by leading manufacturers, offering higher efficiency and power density.
- 2020: Significant increase in demand for wind turbine converters due to aggressive renewable energy targets globally.
- 2021: Continued supply chain challenges impacting semiconductor production and lead times across the industry.
- 2022: Growing focus on modular IGBT solutions for easier integration in traction and industrial applications.
- 2023: Launch of next-generation capsule IGBTs with enhanced short-circuit capability and thermal management features.
- 2024: Increased R&D investments in hybrid SiC/Si IGBT modules for optimized performance and cost-effectiveness.
In-Depth Capsule Type Igbts Market Outlook
The future outlook for the capsule type IGBT market is exceptionally promising, driven by overarching global trends towards sustainability, electrification, and industrial efficiency. The sustained growth in renewable energy deployment, particularly wind and solar power, will continue to be a significant market expander. The accelerating pace of electric vehicle adoption across all segments, from passenger cars to heavy-duty transport, will create substantial and long-term demand for high-performance traction inverters. Furthermore, the ongoing digital transformation of industries and the drive for smart grids will necessitate advanced power electronic components. Strategic opportunities lie in further developing hybrid IGBT modules that leverage the benefits of both silicon and wide-bandgap semiconductors, offering a balanced approach to performance and cost. Continued innovation in packaging and thermal management technologies will also be key to unlocking new application frontiers and maintaining market leadership. The market is projected to reach approximately $8,500 million by 2033, reflecting robust growth driven by these critical technological and societal shifts.
Capsule Type Igbts Segmentation
-
1. Application
- 1.1. HVDC & FACTS
- 1.2. Wind Turbine Converters
- 1.3. Traction
- 1.4. DC Breaker & MV Drives
- 1.5. Large-scale Industrial Drive
- 1.6. Others
-
2. Type
- 2.1. 1700 V
- 2.2. 2500 V
- 2.3. 4500 V
- 2.4. 6000 V
Capsule Type Igbts Segmentation By Geography
-
1. North America
- 1.1. United States
- 1.2. Canada
- 1.3. Mexico
-
2. South America
- 2.1. Brazil
- 2.2. Argentina
- 2.3. Rest of South America
-
3. Europe
- 3.1. United Kingdom
- 3.2. Germany
- 3.3. France
- 3.4. Italy
- 3.5. Spain
- 3.6. Russia
- 3.7. Benelux
- 3.8. Nordics
- 3.9. Rest of Europe
-
4. Middle East & Africa
- 4.1. Turkey
- 4.2. Israel
- 4.3. GCC
- 4.4. North Africa
- 4.5. South Africa
- 4.6. Rest of Middle East & Africa
-
5. Asia Pacific
- 5.1. China
- 5.2. India
- 5.3. Japan
- 5.4. South Korea
- 5.5. ASEAN
- 5.6. Oceania
- 5.7. Rest of Asia Pacific
Capsule Type Igbts REPORT HIGHLIGHTS
| Aspects | Details |
|---|---|
| Study Period | 2019-2033 |
| Base Year | 2024 |
| Estimated Year | 2025 |
| Forecast Period | 2025-2033 |
| Historical Period | 2019-2024 |
| Growth Rate | CAGR of 6.8% from 2019-2033 |
| Segmentation |
|
Table of Contents
- 1. Introduction
- 1.1. Research Scope
- 1.2. Market Segmentation
- 1.3. Research Methodology
- 1.4. Definitions and Assumptions
- 2. Executive Summary
- 2.1. Introduction
- 3. Market Dynamics
- 3.1. Introduction
- 3.2. Market Drivers
- 3.3. Market Restrains
- 3.4. Market Trends
- 4. Market Factor Analysis
- 4.1. Porters Five Forces
- 4.2. Supply/Value Chain
- 4.3. PESTEL analysis
- 4.4. Market Entropy
- 4.5. Patent/Trademark Analysis
- 5. Global Capsule Type Igbts Analysis, Insights and Forecast, 2019-2031
- 5.1. Market Analysis, Insights and Forecast - by Application
- 5.1.1. HVDC & FACTS
- 5.1.2. Wind Turbine Converters
- 5.1.3. Traction
- 5.1.4. DC Breaker & MV Drives
- 5.1.5. Large-scale Industrial Drive
- 5.1.6. Others
- 5.2. Market Analysis, Insights and Forecast - by Type
- 5.2.1. 1700 V
- 5.2.2. 2500 V
- 5.2.3. 4500 V
- 5.2.4. 6000 V
- 5.3. Market Analysis, Insights and Forecast - by Region
- 5.3.1. North America
- 5.3.2. South America
- 5.3.3. Europe
- 5.3.4. Middle East & Africa
- 5.3.5. Asia Pacific
- 5.1. Market Analysis, Insights and Forecast - by Application
- 6. North America Capsule Type Igbts Analysis, Insights and Forecast, 2019-2031
- 6.1. Market Analysis, Insights and Forecast - by Application
- 6.1.1. HVDC & FACTS
- 6.1.2. Wind Turbine Converters
- 6.1.3. Traction
- 6.1.4. DC Breaker & MV Drives
- 6.1.5. Large-scale Industrial Drive
- 6.1.6. Others
- 6.2. Market Analysis, Insights and Forecast - by Type
- 6.2.1. 1700 V
- 6.2.2. 2500 V
- 6.2.3. 4500 V
- 6.2.4. 6000 V
- 6.1. Market Analysis, Insights and Forecast - by Application
- 7. South America Capsule Type Igbts Analysis, Insights and Forecast, 2019-2031
- 7.1. Market Analysis, Insights and Forecast - by Application
- 7.1.1. HVDC & FACTS
- 7.1.2. Wind Turbine Converters
- 7.1.3. Traction
- 7.1.4. DC Breaker & MV Drives
- 7.1.5. Large-scale Industrial Drive
- 7.1.6. Others
- 7.2. Market Analysis, Insights and Forecast - by Type
- 7.2.1. 1700 V
- 7.2.2. 2500 V
- 7.2.3. 4500 V
- 7.2.4. 6000 V
- 7.1. Market Analysis, Insights and Forecast - by Application
- 8. Europe Capsule Type Igbts Analysis, Insights and Forecast, 2019-2031
- 8.1. Market Analysis, Insights and Forecast - by Application
- 8.1.1. HVDC & FACTS
- 8.1.2. Wind Turbine Converters
- 8.1.3. Traction
- 8.1.4. DC Breaker & MV Drives
- 8.1.5. Large-scale Industrial Drive
- 8.1.6. Others
- 8.2. Market Analysis, Insights and Forecast - by Type
- 8.2.1. 1700 V
- 8.2.2. 2500 V
- 8.2.3. 4500 V
- 8.2.4. 6000 V
- 8.1. Market Analysis, Insights and Forecast - by Application
- 9. Middle East & Africa Capsule Type Igbts Analysis, Insights and Forecast, 2019-2031
- 9.1. Market Analysis, Insights and Forecast - by Application
- 9.1.1. HVDC & FACTS
- 9.1.2. Wind Turbine Converters
- 9.1.3. Traction
- 9.1.4. DC Breaker & MV Drives
- 9.1.5. Large-scale Industrial Drive
- 9.1.6. Others
- 9.2. Market Analysis, Insights and Forecast - by Type
- 9.2.1. 1700 V
- 9.2.2. 2500 V
- 9.2.3. 4500 V
- 9.2.4. 6000 V
- 9.1. Market Analysis, Insights and Forecast - by Application
- 10. Asia Pacific Capsule Type Igbts Analysis, Insights and Forecast, 2019-2031
- 10.1. Market Analysis, Insights and Forecast - by Application
- 10.1.1. HVDC & FACTS
- 10.1.2. Wind Turbine Converters
- 10.1.3. Traction
- 10.1.4. DC Breaker & MV Drives
- 10.1.5. Large-scale Industrial Drive
- 10.1.6. Others
- 10.2. Market Analysis, Insights and Forecast - by Type
- 10.2.1. 1700 V
- 10.2.2. 2500 V
- 10.2.3. 4500 V
- 10.2.4. 6000 V
- 10.1. Market Analysis, Insights and Forecast - by Application
- 11. Competitive Analysis
- 11.1. Global Market Share Analysis 2024
- 11.2. Company Profiles
- 11.2.1 Infineon Technologies
- 11.2.1.1. Overview
- 11.2.1.2. Products
- 11.2.1.3. SWOT Analysis
- 11.2.1.4. Recent Developments
- 11.2.1.5. Financials (Based on Availability)
- 11.2.2 Hitachi Energy
- 11.2.2.1. Overview
- 11.2.2.2. Products
- 11.2.2.3. SWOT Analysis
- 11.2.2.4. Recent Developments
- 11.2.2.5. Financials (Based on Availability)
- 11.2.3 Littelfuse (IXYS)
- 11.2.3.1. Overview
- 11.2.3.2. Products
- 11.2.3.3. SWOT Analysis
- 11.2.3.4. Recent Developments
- 11.2.3.5. Financials (Based on Availability)
- 11.2.4 Zhuzhou CRRC Times Electric
- 11.2.4.1. Overview
- 11.2.4.2. Products
- 11.2.4.3. SWOT Analysis
- 11.2.4.4. Recent Developments
- 11.2.4.5. Financials (Based on Availability)
- 11.2.5 Littelfuse (IXYS)
- 11.2.5.1. Overview
- 11.2.5.2. Products
- 11.2.5.3. SWOT Analysis
- 11.2.5.4. Recent Developments
- 11.2.5.5. Financials (Based on Availability)
- 11.2.6 Mitsubishi Electric (Vincotech)
- 11.2.6.1. Overview
- 11.2.6.2. Products
- 11.2.6.3. SWOT Analysis
- 11.2.6.4. Recent Developments
- 11.2.6.5. Financials (Based on Availability)
- 11.2.1 Infineon Technologies
List of Figures
- Figure 1: Global Capsule Type Igbts Revenue Breakdown (million, %) by Region 2024 & 2032
- Figure 2: Global Capsule Type Igbts Volume Breakdown (K, %) by Region 2024 & 2032
- Figure 3: North America Capsule Type Igbts Revenue (million), by Application 2024 & 2032
- Figure 4: North America Capsule Type Igbts Volume (K), by Application 2024 & 2032
- Figure 5: North America Capsule Type Igbts Revenue Share (%), by Application 2024 & 2032
- Figure 6: North America Capsule Type Igbts Volume Share (%), by Application 2024 & 2032
- Figure 7: North America Capsule Type Igbts Revenue (million), by Type 2024 & 2032
- Figure 8: North America Capsule Type Igbts Volume (K), by Type 2024 & 2032
- Figure 9: North America Capsule Type Igbts Revenue Share (%), by Type 2024 & 2032
- Figure 10: North America Capsule Type Igbts Volume Share (%), by Type 2024 & 2032
- Figure 11: North America Capsule Type Igbts Revenue (million), by Country 2024 & 2032
- Figure 12: North America Capsule Type Igbts Volume (K), by Country 2024 & 2032
- Figure 13: North America Capsule Type Igbts Revenue Share (%), by Country 2024 & 2032
- Figure 14: North America Capsule Type Igbts Volume Share (%), by Country 2024 & 2032
- Figure 15: South America Capsule Type Igbts Revenue (million), by Application 2024 & 2032
- Figure 16: South America Capsule Type Igbts Volume (K), by Application 2024 & 2032
- Figure 17: South America Capsule Type Igbts Revenue Share (%), by Application 2024 & 2032
- Figure 18: South America Capsule Type Igbts Volume Share (%), by Application 2024 & 2032
- Figure 19: South America Capsule Type Igbts Revenue (million), by Type 2024 & 2032
- Figure 20: South America Capsule Type Igbts Volume (K), by Type 2024 & 2032
- Figure 21: South America Capsule Type Igbts Revenue Share (%), by Type 2024 & 2032
- Figure 22: South America Capsule Type Igbts Volume Share (%), by Type 2024 & 2032
- Figure 23: South America Capsule Type Igbts Revenue (million), by Country 2024 & 2032
- Figure 24: South America Capsule Type Igbts Volume (K), by Country 2024 & 2032
- Figure 25: South America Capsule Type Igbts Revenue Share (%), by Country 2024 & 2032
- Figure 26: South America Capsule Type Igbts Volume Share (%), by Country 2024 & 2032
- Figure 27: Europe Capsule Type Igbts Revenue (million), by Application 2024 & 2032
- Figure 28: Europe Capsule Type Igbts Volume (K), by Application 2024 & 2032
- Figure 29: Europe Capsule Type Igbts Revenue Share (%), by Application 2024 & 2032
- Figure 30: Europe Capsule Type Igbts Volume Share (%), by Application 2024 & 2032
- Figure 31: Europe Capsule Type Igbts Revenue (million), by Type 2024 & 2032
- Figure 32: Europe Capsule Type Igbts Volume (K), by Type 2024 & 2032
- Figure 33: Europe Capsule Type Igbts Revenue Share (%), by Type 2024 & 2032
- Figure 34: Europe Capsule Type Igbts Volume Share (%), by Type 2024 & 2032
- Figure 35: Europe Capsule Type Igbts Revenue (million), by Country 2024 & 2032
- Figure 36: Europe Capsule Type Igbts Volume (K), by Country 2024 & 2032
- Figure 37: Europe Capsule Type Igbts Revenue Share (%), by Country 2024 & 2032
- Figure 38: Europe Capsule Type Igbts Volume Share (%), by Country 2024 & 2032
- Figure 39: Middle East & Africa Capsule Type Igbts Revenue (million), by Application 2024 & 2032
- Figure 40: Middle East & Africa Capsule Type Igbts Volume (K), by Application 2024 & 2032
- Figure 41: Middle East & Africa Capsule Type Igbts Revenue Share (%), by Application 2024 & 2032
- Figure 42: Middle East & Africa Capsule Type Igbts Volume Share (%), by Application 2024 & 2032
- Figure 43: Middle East & Africa Capsule Type Igbts Revenue (million), by Type 2024 & 2032
- Figure 44: Middle East & Africa Capsule Type Igbts Volume (K), by Type 2024 & 2032
- Figure 45: Middle East & Africa Capsule Type Igbts Revenue Share (%), by Type 2024 & 2032
- Figure 46: Middle East & Africa Capsule Type Igbts Volume Share (%), by Type 2024 & 2032
- Figure 47: Middle East & Africa Capsule Type Igbts Revenue (million), by Country 2024 & 2032
- Figure 48: Middle East & Africa Capsule Type Igbts Volume (K), by Country 2024 & 2032
- Figure 49: Middle East & Africa Capsule Type Igbts Revenue Share (%), by Country 2024 & 2032
- Figure 50: Middle East & Africa Capsule Type Igbts Volume Share (%), by Country 2024 & 2032
- Figure 51: Asia Pacific Capsule Type Igbts Revenue (million), by Application 2024 & 2032
- Figure 52: Asia Pacific Capsule Type Igbts Volume (K), by Application 2024 & 2032
- Figure 53: Asia Pacific Capsule Type Igbts Revenue Share (%), by Application 2024 & 2032
- Figure 54: Asia Pacific Capsule Type Igbts Volume Share (%), by Application 2024 & 2032
- Figure 55: Asia Pacific Capsule Type Igbts Revenue (million), by Type 2024 & 2032
- Figure 56: Asia Pacific Capsule Type Igbts Volume (K), by Type 2024 & 2032
- Figure 57: Asia Pacific Capsule Type Igbts Revenue Share (%), by Type 2024 & 2032
- Figure 58: Asia Pacific Capsule Type Igbts Volume Share (%), by Type 2024 & 2032
- Figure 59: Asia Pacific Capsule Type Igbts Revenue (million), by Country 2024 & 2032
- Figure 60: Asia Pacific Capsule Type Igbts Volume (K), by Country 2024 & 2032
- Figure 61: Asia Pacific Capsule Type Igbts Revenue Share (%), by Country 2024 & 2032
- Figure 62: Asia Pacific Capsule Type Igbts Volume Share (%), by Country 2024 & 2032
List of Tables
- Table 1: Global Capsule Type Igbts Revenue million Forecast, by Region 2019 & 2032
- Table 2: Global Capsule Type Igbts Volume K Forecast, by Region 2019 & 2032
- Table 3: Global Capsule Type Igbts Revenue million Forecast, by Application 2019 & 2032
- Table 4: Global Capsule Type Igbts Volume K Forecast, by Application 2019 & 2032
- Table 5: Global Capsule Type Igbts Revenue million Forecast, by Type 2019 & 2032
- Table 6: Global Capsule Type Igbts Volume K Forecast, by Type 2019 & 2032
- Table 7: Global Capsule Type Igbts Revenue million Forecast, by Region 2019 & 2032
- Table 8: Global Capsule Type Igbts Volume K Forecast, by Region 2019 & 2032
- Table 9: Global Capsule Type Igbts Revenue million Forecast, by Application 2019 & 2032
- Table 10: Global Capsule Type Igbts Volume K Forecast, by Application 2019 & 2032
- Table 11: Global Capsule Type Igbts Revenue million Forecast, by Type 2019 & 2032
- Table 12: Global Capsule Type Igbts Volume K Forecast, by Type 2019 & 2032
- Table 13: Global Capsule Type Igbts Revenue million Forecast, by Country 2019 & 2032
- Table 14: Global Capsule Type Igbts Volume K Forecast, by Country 2019 & 2032
- Table 15: United States Capsule Type Igbts Revenue (million) Forecast, by Application 2019 & 2032
- Table 16: United States Capsule Type Igbts Volume (K) Forecast, by Application 2019 & 2032
- Table 17: Canada Capsule Type Igbts Revenue (million) Forecast, by Application 2019 & 2032
- Table 18: Canada Capsule Type Igbts Volume (K) Forecast, by Application 2019 & 2032
- Table 19: Mexico Capsule Type Igbts Revenue (million) Forecast, by Application 2019 & 2032
- Table 20: Mexico Capsule Type Igbts Volume (K) Forecast, by Application 2019 & 2032
- Table 21: Global Capsule Type Igbts Revenue million Forecast, by Application 2019 & 2032
- Table 22: Global Capsule Type Igbts Volume K Forecast, by Application 2019 & 2032
- Table 23: Global Capsule Type Igbts Revenue million Forecast, by Type 2019 & 2032
- Table 24: Global Capsule Type Igbts Volume K Forecast, by Type 2019 & 2032
- Table 25: Global Capsule Type Igbts Revenue million Forecast, by Country 2019 & 2032
- Table 26: Global Capsule Type Igbts Volume K Forecast, by Country 2019 & 2032
- Table 27: Brazil Capsule Type Igbts Revenue (million) Forecast, by Application 2019 & 2032
- Table 28: Brazil Capsule Type Igbts Volume (K) Forecast, by Application 2019 & 2032
- Table 29: Argentina Capsule Type Igbts Revenue (million) Forecast, by Application 2019 & 2032
- Table 30: Argentina Capsule Type Igbts Volume (K) Forecast, by Application 2019 & 2032
- Table 31: Rest of South America Capsule Type Igbts Revenue (million) Forecast, by Application 2019 & 2032
- Table 32: Rest of South America Capsule Type Igbts Volume (K) Forecast, by Application 2019 & 2032
- Table 33: Global Capsule Type Igbts Revenue million Forecast, by Application 2019 & 2032
- Table 34: Global Capsule Type Igbts Volume K Forecast, by Application 2019 & 2032
- Table 35: Global Capsule Type Igbts Revenue million Forecast, by Type 2019 & 2032
- Table 36: Global Capsule Type Igbts Volume K Forecast, by Type 2019 & 2032
- Table 37: Global Capsule Type Igbts Revenue million Forecast, by Country 2019 & 2032
- Table 38: Global Capsule Type Igbts Volume K Forecast, by Country 2019 & 2032
- Table 39: United Kingdom Capsule Type Igbts Revenue (million) Forecast, by Application 2019 & 2032
- Table 40: United Kingdom Capsule Type Igbts Volume (K) Forecast, by Application 2019 & 2032
- Table 41: Germany Capsule Type Igbts Revenue (million) Forecast, by Application 2019 & 2032
- Table 42: Germany Capsule Type Igbts Volume (K) Forecast, by Application 2019 & 2032
- Table 43: France Capsule Type Igbts Revenue (million) Forecast, by Application 2019 & 2032
- Table 44: France Capsule Type Igbts Volume (K) Forecast, by Application 2019 & 2032
- Table 45: Italy Capsule Type Igbts Revenue (million) Forecast, by Application 2019 & 2032
- Table 46: Italy Capsule Type Igbts Volume (K) Forecast, by Application 2019 & 2032
- Table 47: Spain Capsule Type Igbts Revenue (million) Forecast, by Application 2019 & 2032
- Table 48: Spain Capsule Type Igbts Volume (K) Forecast, by Application 2019 & 2032
- Table 49: Russia Capsule Type Igbts Revenue (million) Forecast, by Application 2019 & 2032
- Table 50: Russia Capsule Type Igbts Volume (K) Forecast, by Application 2019 & 2032
- Table 51: Benelux Capsule Type Igbts Revenue (million) Forecast, by Application 2019 & 2032
- Table 52: Benelux Capsule Type Igbts Volume (K) Forecast, by Application 2019 & 2032
- Table 53: Nordics Capsule Type Igbts Revenue (million) Forecast, by Application 2019 & 2032
- Table 54: Nordics Capsule Type Igbts Volume (K) Forecast, by Application 2019 & 2032
- Table 55: Rest of Europe Capsule Type Igbts Revenue (million) Forecast, by Application 2019 & 2032
- Table 56: Rest of Europe Capsule Type Igbts Volume (K) Forecast, by Application 2019 & 2032
- Table 57: Global Capsule Type Igbts Revenue million Forecast, by Application 2019 & 2032
- Table 58: Global Capsule Type Igbts Volume K Forecast, by Application 2019 & 2032
- Table 59: Global Capsule Type Igbts Revenue million Forecast, by Type 2019 & 2032
- Table 60: Global Capsule Type Igbts Volume K Forecast, by Type 2019 & 2032
- Table 61: Global Capsule Type Igbts Revenue million Forecast, by Country 2019 & 2032
- Table 62: Global Capsule Type Igbts Volume K Forecast, by Country 2019 & 2032
- Table 63: Turkey Capsule Type Igbts Revenue (million) Forecast, by Application 2019 & 2032
- Table 64: Turkey Capsule Type Igbts Volume (K) Forecast, by Application 2019 & 2032
- Table 65: Israel Capsule Type Igbts Revenue (million) Forecast, by Application 2019 & 2032
- Table 66: Israel Capsule Type Igbts Volume (K) Forecast, by Application 2019 & 2032
- Table 67: GCC Capsule Type Igbts Revenue (million) Forecast, by Application 2019 & 2032
- Table 68: GCC Capsule Type Igbts Volume (K) Forecast, by Application 2019 & 2032
- Table 69: North Africa Capsule Type Igbts Revenue (million) Forecast, by Application 2019 & 2032
- Table 70: North Africa Capsule Type Igbts Volume (K) Forecast, by Application 2019 & 2032
- Table 71: South Africa Capsule Type Igbts Revenue (million) Forecast, by Application 2019 & 2032
- Table 72: South Africa Capsule Type Igbts Volume (K) Forecast, by Application 2019 & 2032
- Table 73: Rest of Middle East & Africa Capsule Type Igbts Revenue (million) Forecast, by Application 2019 & 2032
- Table 74: Rest of Middle East & Africa Capsule Type Igbts Volume (K) Forecast, by Application 2019 & 2032
- Table 75: Global Capsule Type Igbts Revenue million Forecast, by Application 2019 & 2032
- Table 76: Global Capsule Type Igbts Volume K Forecast, by Application 2019 & 2032
- Table 77: Global Capsule Type Igbts Revenue million Forecast, by Type 2019 & 2032
- Table 78: Global Capsule Type Igbts Volume K Forecast, by Type 2019 & 2032
- Table 79: Global Capsule Type Igbts Revenue million Forecast, by Country 2019 & 2032
- Table 80: Global Capsule Type Igbts Volume K Forecast, by Country 2019 & 2032
- Table 81: China Capsule Type Igbts Revenue (million) Forecast, by Application 2019 & 2032
- Table 82: China Capsule Type Igbts Volume (K) Forecast, by Application 2019 & 2032
- Table 83: India Capsule Type Igbts Revenue (million) Forecast, by Application 2019 & 2032
- Table 84: India Capsule Type Igbts Volume (K) Forecast, by Application 2019 & 2032
- Table 85: Japan Capsule Type Igbts Revenue (million) Forecast, by Application 2019 & 2032
- Table 86: Japan Capsule Type Igbts Volume (K) Forecast, by Application 2019 & 2032
- Table 87: South Korea Capsule Type Igbts Revenue (million) Forecast, by Application 2019 & 2032
- Table 88: South Korea Capsule Type Igbts Volume (K) Forecast, by Application 2019 & 2032
- Table 89: ASEAN Capsule Type Igbts Revenue (million) Forecast, by Application 2019 & 2032
- Table 90: ASEAN Capsule Type Igbts Volume (K) Forecast, by Application 2019 & 2032
- Table 91: Oceania Capsule Type Igbts Revenue (million) Forecast, by Application 2019 & 2032
- Table 92: Oceania Capsule Type Igbts Volume (K) Forecast, by Application 2019 & 2032
- Table 93: Rest of Asia Pacific Capsule Type Igbts Revenue (million) Forecast, by Application 2019 & 2032
- Table 94: Rest of Asia Pacific Capsule Type Igbts Volume (K) Forecast, by Application 2019 & 2032
Frequently Asked Questions
1. What is the projected Compound Annual Growth Rate (CAGR) of the Capsule Type Igbts?
The projected CAGR is approximately 6.8%.
2. Which companies are prominent players in the Capsule Type Igbts?
Key companies in the market include Infineon Technologies, Hitachi Energy, Littelfuse (IXYS), Zhuzhou CRRC Times Electric, Littelfuse (IXYS), Mitsubishi Electric (Vincotech).
3. What are the main segments of the Capsule Type Igbts?
The market segments include Application, Type.
4. Can you provide details about the market size?
The market size is estimated to be USD 436 million as of 2022.
5. What are some drivers contributing to market growth?
N/A
6. What are the notable trends driving market growth?
N/A
7. Are there any restraints impacting market growth?
N/A
8. Can you provide examples of recent developments in the market?
N/A
9. What pricing options are available for accessing the report?
Pricing options include single-user, multi-user, and enterprise licenses priced at USD 3950.00, USD 5925.00, and USD 7900.00 respectively.
10. Is the market size provided in terms of value or volume?
The market size is provided in terms of value, measured in million and volume, measured in K.
11. Are there any specific market keywords associated with the report?
Yes, the market keyword associated with the report is "Capsule Type Igbts," which aids in identifying and referencing the specific market segment covered.
12. How do I determine which pricing option suits my needs best?
The pricing options vary based on user requirements and access needs. Individual users may opt for single-user licenses, while businesses requiring broader access may choose multi-user or enterprise licenses for cost-effective access to the report.
13. Are there any additional resources or data provided in the Capsule Type Igbts report?
While the report offers comprehensive insights, it's advisable to review the specific contents or supplementary materials provided to ascertain if additional resources or data are available.
14. How can I stay updated on further developments or reports in the Capsule Type Igbts?
To stay informed about further developments, trends, and reports in the Capsule Type Igbts, consider subscribing to industry newsletters, following relevant companies and organizations, or regularly checking reputable industry news sources and publications.
Methodology
Step 1 - Identification of Relevant Samples Size from Population Database


Step 2 - Approaches for Defining Global Market Size (Value, Volume* & Price*)

Note*: In applicable scenarios
Step 3 - Data Sources
Primary Research
- Web Analytics
- Survey Reports
- Research Institute
- Latest Research Reports
- Opinion Leaders
Secondary Research
- Annual Reports
- White Paper
- Latest Press Release
- Industry Association
- Paid Database
- Investor Presentations

Step 4 - Data Triangulation
Involves using different sources of information in order to increase the validity of a study
These sources are likely to be stakeholders in a program - participants, other researchers, program staff, other community members, and so on.
Then we put all data in single framework & apply various statistical tools to find out the dynamic on the market.
During the analysis stage, feedback from the stakeholder groups would be compared to determine areas of agreement as well as areas of divergence
