

Key Insights
The Energy Harvesting Systems market is poised for significant expansion, projected to reach a substantial valuation by 2033. Driven by a compound annual growth rate (CAGR) of 11.8% from 2025 to 2033, the market's momentum is fueled by the escalating demand for sustainable power solutions across diverse industries. Key growth catalysts include the widespread adoption of low-power Internet of Things (IoT) devices, stringent environmental mandates promoting energy efficiency, and the increasing need for self-powered sensors in remote applications. The market is segmented by technology, encompassing light, vibration, thermal, and RF energy harvesting, and by application, including consumer electronics, building and home automation, industrial, transportation, and others. Consumer electronics and building automation currently lead, propelled by advancements in miniaturized energy harvesting and integration into smart devices. The industrial sector offers considerable future growth potential, addressing the demand for reliable, independent power in challenging environments. Emerging trends focus on enhanced energy conversion efficiency and further miniaturization. While initial costs and output limitations present challenges, ongoing research and development are expected to drive market growth. Geographically, North America and Europe hold significant market shares, with the Asia-Pacific region anticipated to experience the most rapid expansion due to industrialization and technological progress.
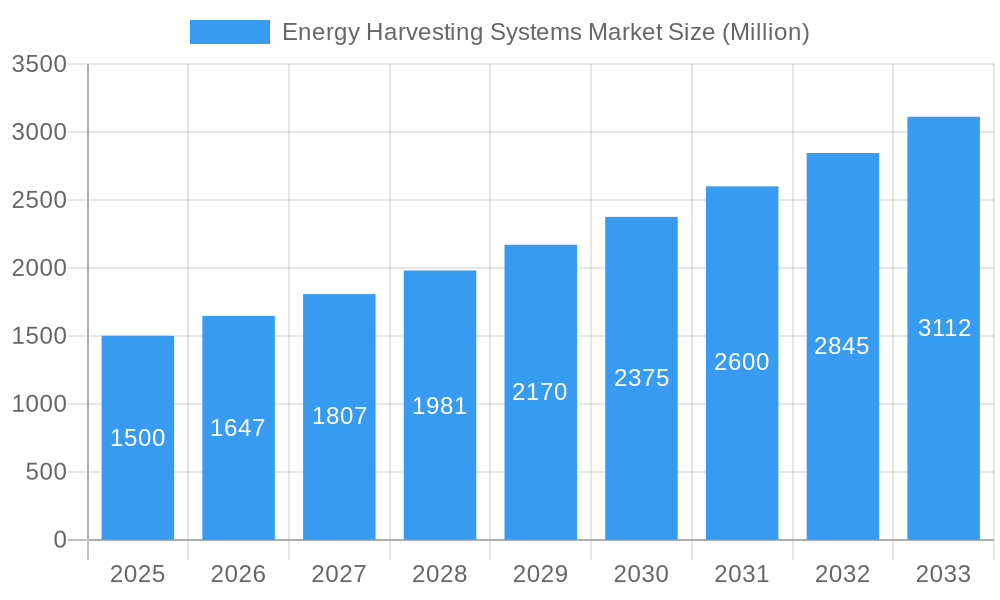
Energy Harvesting Systems Market Market Size (In Million)
Sustained growth throughout the forecast period (2025-2033) is expected across all segments, driven by continuous technological innovation, the rising demand for autonomous and self-powered devices, and an intensified focus on sustainability. The market is witnessing accelerated development of more efficient energy harvesting technologies, resulting in improved performance and reduced costs. Coupled with the expanding deployment of IoT and the proliferation of smart cities, this trend will further propel market expansion. Intense competition among established players, including Texas Instruments and STMicroelectronics, fosters innovation and opens avenues for new entrants specializing in niche applications and technological breakthroughs. The market is estimated to be valued at 700 million in the base year of 2025.
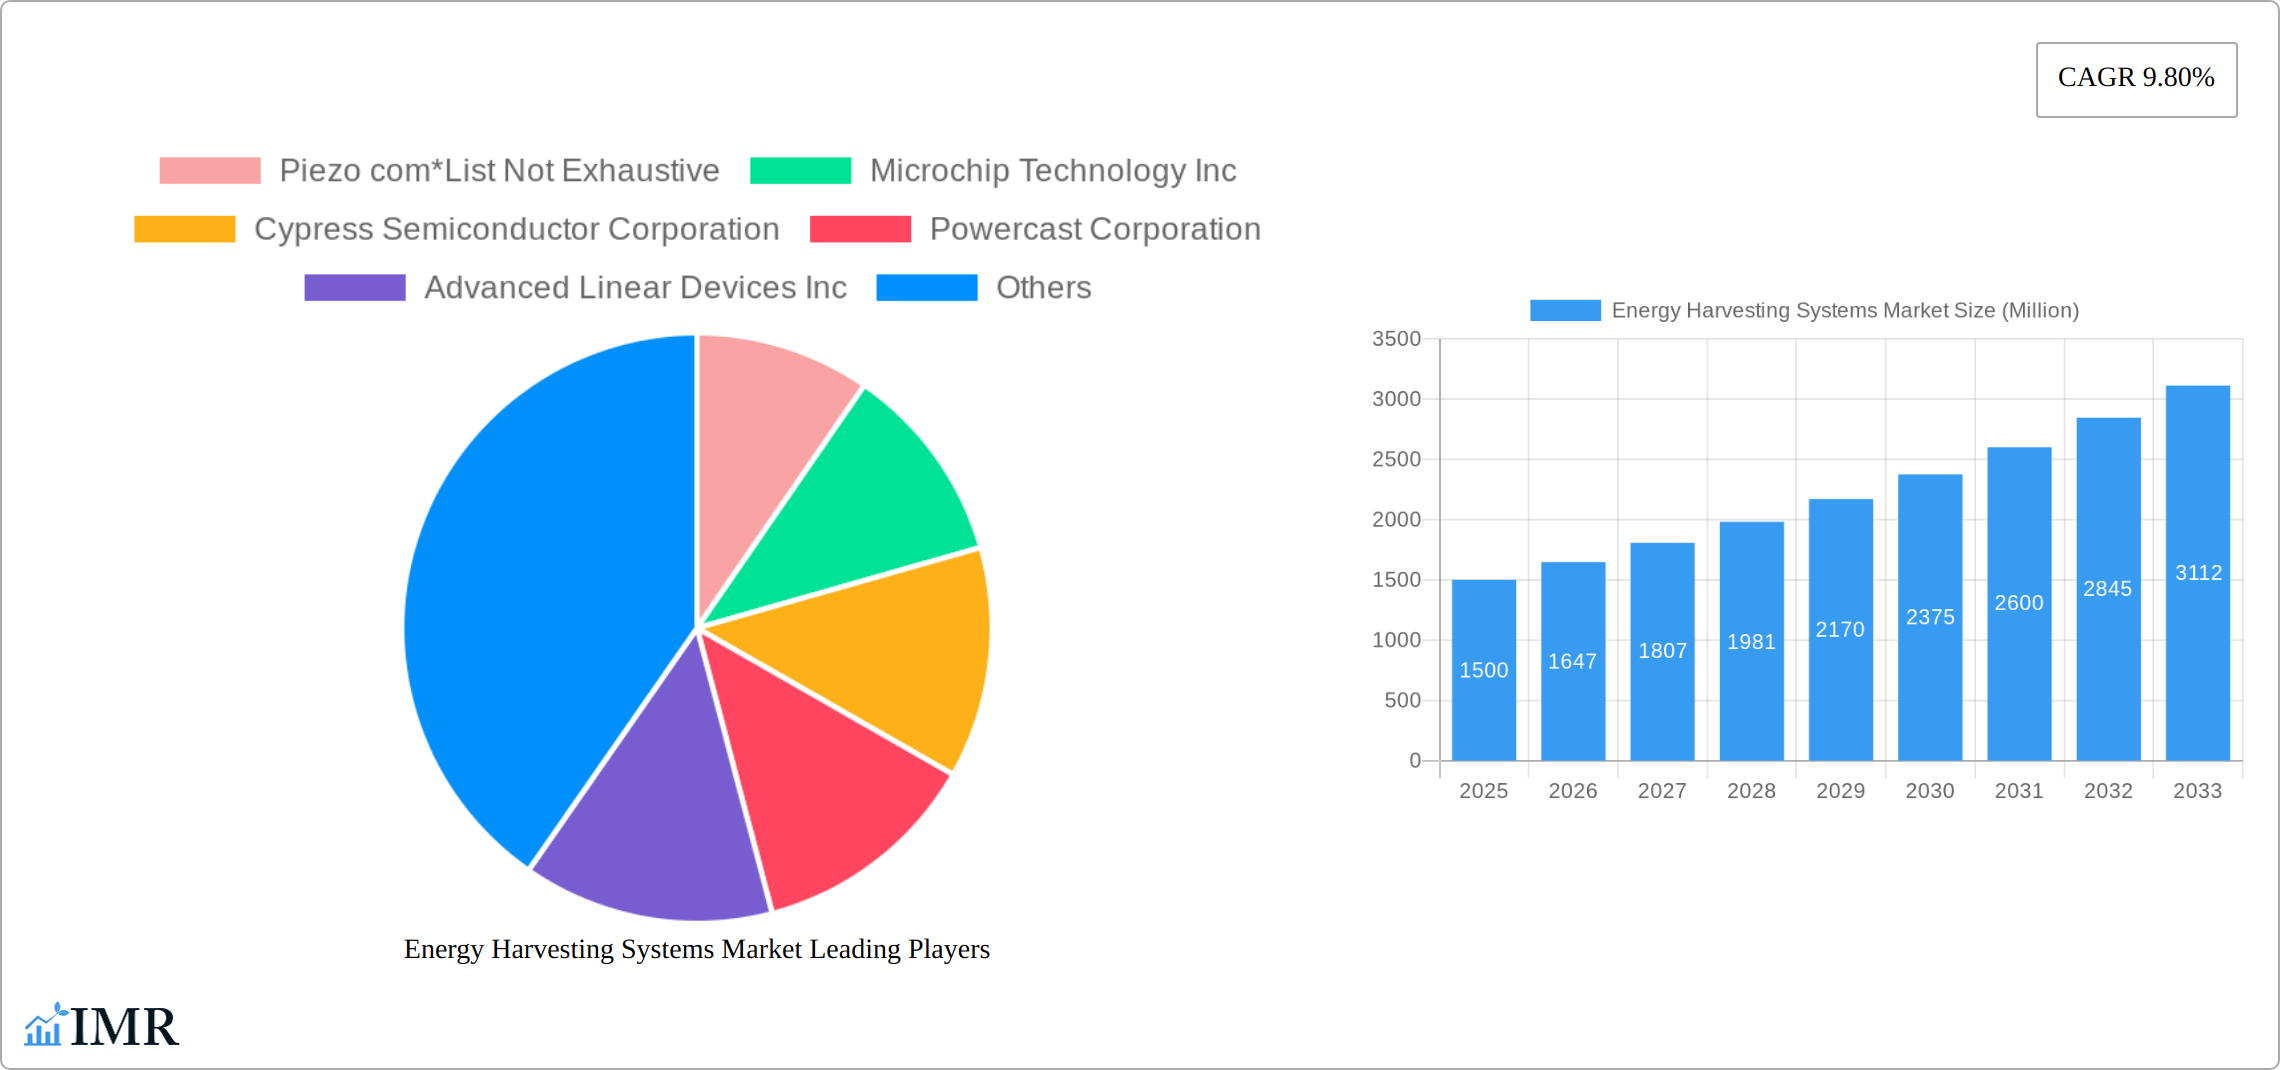
Energy Harvesting Systems Market Company Market Share
Energy Harvesting Systems Market: A Comprehensive Report (2019-2033)
This in-depth report provides a comprehensive analysis of the Energy Harvesting Systems market, encompassing market dynamics, growth trends, regional dominance, product landscape, key players, and future opportunities. The study period covers 2019-2033, with 2025 as the base and estimated year. The report segments the market by technology (Light Energy Harvesting, Vibration Energy Harvesting, Thermal Energy Harvesting, RF Energy Harvesting) and application (Consumer Electronics, Building and Home Automation, Industrial, Transportation, Other Applications), offering granular insights into each segment's growth trajectory. The market size is presented in million units.
Energy Harvesting Systems Market Dynamics & Structure
The Energy Harvesting Systems market is experiencing significant growth, driven by the increasing demand for sustainable and self-powered devices across various sectors. Market concentration is moderate, with several key players holding substantial market share, but also fostering intense competition and innovation. Technological advancements, particularly in miniaturization and efficiency, are key drivers. Regulatory frameworks promoting renewable energy sources further fuel market expansion. However, high initial investment costs and technological limitations pose challenges. The market is witnessing strategic mergers and acquisitions (M&A) aimed at consolidating market share and accessing new technologies.
- Market Concentration: Moderate, with top 10 players holding approximately xx% market share (2025).
- Technological Innovation: Continuous advancements in energy conversion efficiency and miniaturization are driving growth.
- Regulatory Frameworks: Government incentives and regulations supporting renewable energy adoption are positive catalysts.
- Competitive Substitutes: Traditional power sources (batteries) remain major competitors, but their limitations are driving adoption of energy harvesting systems.
- End-User Demographics: Growth is being fueled by a diverse range of end-users across consumer electronics, industrial automation, and transportation sectors.
- M&A Trends: A moderate number of M&A deals (xx deals in the last 5 years) indicate market consolidation and technology acquisition trends.
Energy Harvesting Systems Market Growth Trends & Insights
The Energy Harvesting Systems market has demonstrated a robust growth trajectory over the historical period (2019-2024). The market size was valued at xx million units in 2024 and is projected to reach xx million units by 2033, exhibiting a CAGR of xx% during the forecast period (2025-2033). This growth is attributed to increasing adoption across diverse applications, driven by factors such as declining costs, improved efficiency, and the rising demand for self-powered devices in the Internet of Things (IoT). Technological disruptions, such as the development of advanced materials and energy conversion techniques, further accelerate market expansion. Consumer preferences are shifting towards sustainable and energy-efficient solutions, fueling market demand.
Dominant Regions, Countries, or Segments in Energy Harvesting Systems Market
The North American and European regions are currently leading the Energy Harvesting Systems market, driven by robust technological advancements, supportive government policies, and high adoption rates across various sectors. However, the Asia-Pacific region is expected to exhibit substantial growth in the coming years owing to the rapid growth in emerging economies and the burgeoning demand for sustainable solutions.
By Technology:
- RF Energy Harvesting: This segment is witnessing strong growth due to its applicability in powering wireless sensors and devices over longer distances.
- Vibration Energy Harvesting: The increasing adoption of this technology in industrial applications and wearable devices is driving significant market expansion.
- Light Energy Harvesting: This segment has seen moderate growth, largely driven by the advancements in solar cell technology and its application in various consumer electronics and building automation systems.
- Thermal Energy Harvesting: The use of this technology is still limited by efficiency challenges, but the segment is showing promise in niche applications, like waste heat recovery.
By Application:
- Consumer Electronics: The integration of energy harvesting technologies into wearable devices, smartwatches, and other consumer electronics is a major driver.
- Building and Home Automation: The use of energy harvesting systems in building automation, like smart sensors, is gaining significant traction.
- Industrial: The industrial sector is adopting energy harvesting for various applications, including remote monitoring and data acquisition.
- Transportation: Growing interest in electric vehicles and other transportation systems is driving the adoption of this technology.
Energy Harvesting Systems Market Product Landscape
The Energy Harvesting Systems market presents a dynamic and expanding product portfolio, encompassing a spectrum from sophisticated individual energy harvesting components to integrated solutions for diverse applications. Key components include highly efficient piezoelectric generators for vibration-based energy capture, advanced solar cells optimized for low-light conditions, and next-generation thermoelectric generators leveraging thermal gradients. The trend is toward miniaturization and enhanced power density, allowing for seamless integration into even the smallest devices. Recent innovations are heavily focused on boosting energy conversion efficiency, achieving significant cost reductions through novel manufacturing processes, and developing robust, long-lasting solutions. Unique selling propositions often center on superior power output per unit volume, extended operational lifespans, and exceptional durability in challenging environments. Ongoing technological advancements are pushing the boundaries through the development of novel nanomaterials, highly efficient power management integrated circuits (PMICs), and optimized energy harvesting algorithms.
Key Drivers, Barriers & Challenges in Energy Harvesting Systems Market
Key Drivers:
- Rising demand for self-powered devices: The proliferation of IoT devices necessitates the development of self-sufficient power solutions.
- Government regulations & incentives: Policies supporting renewable energy adoption and reducing carbon emissions are driving growth.
- Technological advancements: Continuous innovations in energy conversion technologies are boosting efficiency and cost-effectiveness.
Key Challenges & Restraints:
- High initial investment costs: The high upfront investment for implementing energy harvesting systems can be a barrier for some applications.
- Low energy conversion efficiency: Compared to traditional power sources, the energy conversion efficiency of many energy harvesting technologies is relatively low.
- Environmental factors: The performance of some energy harvesting technologies (like solar) is affected by environmental conditions.
Emerging Opportunities in Energy Harvesting Systems Market
- Ubiquitous IoT Deployment: The explosive growth of the Internet of Things (IoT) presents a colossal opportunity, as energy harvesting can provide self-sustaining power for billions of distributed sensors and devices, eliminating the need for frequent battery replacements and enabling deployments in remote or inaccessible locations.
- Wearable Technology and Medical Implants: The burgeoning market for smart wearables and implantable medical devices is a prime area for energy harvesting. Harvesting body heat, motion, or even bio-electrical signals can power these devices indefinitely, enhancing patient comfort and reducing the risks associated with surgical battery replacements.
- Smart Infrastructure and Industrial Automation: The push for "smart cities" and Industry 4.0 necessitates self-powered sensors for monitoring structural integrity, environmental conditions, and machinery performance. Energy harvesting offers a sustainable and cost-effective solution for powering these critical infrastructure components.
- Advanced Energy Storage Integration: The development of highly efficient and compact energy storage solutions, such as supercapacitors and thin-film batteries, is synergistically boosting the potential of energy harvesting. These storage devices can effectively buffer intermittent harvested energy, ensuring a stable power supply.
- Green and Sustainable Technologies: A growing global emphasis on environmental sustainability and reducing carbon footprints is fueling demand for energy-efficient and self-powered solutions across all sectors. Energy harvesting directly aligns with these eco-conscious trends.
Growth Accelerators in the Energy Harvesting Systems Market Industry
Technological breakthroughs in materials science, energy conversion techniques, and power management are key growth accelerators. Strategic partnerships between energy harvesting technology providers and system integrators are expanding market reach and accelerating adoption. Market expansion strategies focusing on new applications and untapped markets are further fueling growth.
Key Players Shaping the Energy Harvesting Systems Market Market
Notable Milestones in Energy Harvesting Systems Market Sector
- March 2022: Powercast Corporation shipped 10 million wireless RF Powerharvester PCC110 chips, demonstrating the growing demand for wireless power solutions.
- January 2022: E-Peas SA launched an ultra-compact power management solution for Cartier's solar energy harvesting watch, showcasing advancements in miniaturization.
- January 2022: Advanced Linear Devices, Inc. announced a nano-powder precision P-Channel EPAD MOSFET array for low-power applications, enhancing energy harvesting efficiency in various sectors.
In-Depth Energy Harvesting Systems Market Market Outlook
The Energy Harvesting Systems market is poised for significant growth in the coming years, driven by technological advancements, increasing demand for sustainable solutions, and expanding applications across various sectors. Strategic partnerships, focused research and development, and targeted market expansion efforts will shape the future market landscape, creating lucrative opportunities for key players and new entrants alike. The continuous innovation in materials science and energy conversion technologies will pave the way for more efficient and cost-effective solutions, further stimulating market growth.
Energy Harvesting Systems Market Segmentation
-
1. Technology
- 1.1. Light Energy Harvesting
- 1.2. Vibration Energy Harvesting
- 1.3. Thermal Energy Harvesting
- 1.4. RF Energy Harvesting
-
2. Application
- 2.1. Consumer Electronics
- 2.2. Building and Home Automation
- 2.3. Industrial
- 2.4. Transportation
- 2.5. Other Applications
Energy Harvesting Systems Market Segmentation By Geography
- 1. North America
- 2. Europe
- 3. Asia Pacific
- 4. Rest of the World

Energy Harvesting Systems Market Regional Market Share
Geographic Coverage of Energy Harvesting Systems Market
Energy Harvesting Systems Market REPORT HIGHLIGHTS
| Aspects | Details |
|---|---|
| Study Period | 2020-2034 |
| Base Year | 2025 |
| Estimated Year | 2026 |
| Forecast Period | 2026-2034 |
| Historical Period | 2020-2025 |
| Growth Rate | CAGR of 11.8% from 2020-2034 |
| Segmentation |
|
Table of Contents
- 1. Introduction
- 1.1. Research Scope
- 1.2. Market Segmentation
- 1.3. Research Objective
- 1.4. Definitions and Assumptions
- 2. Executive Summary
- 2.1. Market Snapshot
- 3. Market Dynamics
- 3.1. Market Drivers
- 3.2. Market Restrains
- 3.3. Market Trends
- 3.4. Market Opportunities
- 4. Market Factor Analysis
- 4.1. Porters Five Forces
- 4.1.1. Bargaining Power of Suppliers
- 4.1.2. Bargaining Power of Buyers
- 4.1.3. Threat of New Entrants
- 4.1.4. Threat of Substitutes
- 4.1.5. Competitive Rivalry
- 4.2. PESTEL analysis
- 4.3. BCG Analysis
- 4.3.1. Stars (High Growth, High Market Share)
- 4.3.2. Cash Cows (Low Growth, High Market Share)
- 4.3.3. Question Mark (High Growth, Low Market Share)
- 4.3.4. Dogs (Low Growth, Low Market Share)
- 4.4. Ansoff Matrix Analysis
- 4.5. Supply Chain Analysis
- 4.6. Regulatory Landscape
- 4.7. Current Market Potential and Opportunity Assessment (TAM–SAM–SOM Framework)
- 4.8. IMR Analyst Note
- 4.1. Porters Five Forces
- 5. Market Analysis, Insights and Forecast 2021-2033
- 5.1. Market Analysis, Insights and Forecast - by Technology
- 5.1.1. Light Energy Harvesting
- 5.1.2. Vibration Energy Harvesting
- 5.1.3. Thermal Energy Harvesting
- 5.1.4. RF Energy Harvesting
- 5.2. Market Analysis, Insights and Forecast - by Application
- 5.2.1. Consumer Electronics
- 5.2.2. Building and Home Automation
- 5.2.3. Industrial
- 5.2.4. Transportation
- 5.2.5. Other Applications
- 5.3. Market Analysis, Insights and Forecast - by Region
- 5.3.1. North America
- 5.3.2. Europe
- 5.3.3. Asia Pacific
- 5.3.4. Rest of the World
- 5.1. Market Analysis, Insights and Forecast - by Technology
- 6. Global Energy Harvesting Systems Market Analysis, Insights and Forecast, 2021-2033
- 6.1. Market Analysis, Insights and Forecast - by Technology
- 6.1.1. Light Energy Harvesting
- 6.1.2. Vibration Energy Harvesting
- 6.1.3. Thermal Energy Harvesting
- 6.1.4. RF Energy Harvesting
- 6.2. Market Analysis, Insights and Forecast - by Application
- 6.2.1. Consumer Electronics
- 6.2.2. Building and Home Automation
- 6.2.3. Industrial
- 6.2.4. Transportation
- 6.2.5. Other Applications
- 6.1. Market Analysis, Insights and Forecast - by Technology
- 7. North America Energy Harvesting Systems Market Analysis, Insights and Forecast, 2020-2032
- 7.1. Market Analysis, Insights and Forecast - by Technology
- 7.1.1. Light Energy Harvesting
- 7.1.2. Vibration Energy Harvesting
- 7.1.3. Thermal Energy Harvesting
- 7.1.4. RF Energy Harvesting
- 7.2. Market Analysis, Insights and Forecast - by Application
- 7.2.1. Consumer Electronics
- 7.2.2. Building and Home Automation
- 7.2.3. Industrial
- 7.2.4. Transportation
- 7.2.5. Other Applications
- 7.1. Market Analysis, Insights and Forecast - by Technology
- 8. Europe Energy Harvesting Systems Market Analysis, Insights and Forecast, 2020-2032
- 8.1. Market Analysis, Insights and Forecast - by Technology
- 8.1.1. Light Energy Harvesting
- 8.1.2. Vibration Energy Harvesting
- 8.1.3. Thermal Energy Harvesting
- 8.1.4. RF Energy Harvesting
- 8.2. Market Analysis, Insights and Forecast - by Application
- 8.2.1. Consumer Electronics
- 8.2.2. Building and Home Automation
- 8.2.3. Industrial
- 8.2.4. Transportation
- 8.2.5. Other Applications
- 8.1. Market Analysis, Insights and Forecast - by Technology
- 9. Asia Pacific Energy Harvesting Systems Market Analysis, Insights and Forecast, 2020-2032
- 9.1. Market Analysis, Insights and Forecast - by Technology
- 9.1.1. Light Energy Harvesting
- 9.1.2. Vibration Energy Harvesting
- 9.1.3. Thermal Energy Harvesting
- 9.1.4. RF Energy Harvesting
- 9.2. Market Analysis, Insights and Forecast - by Application
- 9.2.1. Consumer Electronics
- 9.2.2. Building and Home Automation
- 9.2.3. Industrial
- 9.2.4. Transportation
- 9.2.5. Other Applications
- 9.1. Market Analysis, Insights and Forecast - by Technology
- 10. Rest of the World Energy Harvesting Systems Market Analysis, Insights and Forecast, 2020-2032
- 10.1. Market Analysis, Insights and Forecast - by Technology
- 10.1.1. Light Energy Harvesting
- 10.1.2. Vibration Energy Harvesting
- 10.1.3. Thermal Energy Harvesting
- 10.1.4. RF Energy Harvesting
- 10.2. Market Analysis, Insights and Forecast - by Application
- 10.2.1. Consumer Electronics
- 10.2.2. Building and Home Automation
- 10.2.3. Industrial
- 10.2.4. Transportation
- 10.2.5. Other Applications
- 10.1. Market Analysis, Insights and Forecast - by Technology
- 11. Competitive Analysis
- 11.1. Company Profiles
- 11.1.1 Piezo com*List Not Exhaustive
- 11.1.1.1. Company Overview
- 11.1.1.2. Products
- 11.1.1.3. Company Financials
- 11.1.1.4. SWOT Analysis
- 11.1.2 Microchip Technology Inc
- 11.1.2.1. Company Overview
- 11.1.2.2. Products
- 11.1.2.3. Company Financials
- 11.1.2.4. SWOT Analysis
- 11.1.3 Cypress Semiconductor Corporation
- 11.1.3.1. Company Overview
- 11.1.3.2. Products
- 11.1.3.3. Company Financials
- 11.1.3.4. SWOT Analysis
- 11.1.4 Powercast Corporation
- 11.1.4.1. Company Overview
- 11.1.4.2. Products
- 11.1.4.3. Company Financials
- 11.1.4.4. SWOT Analysis
- 11.1.5 Advanced Linear Devices Inc
- 11.1.5.1. Company Overview
- 11.1.5.2. Products
- 11.1.5.3. Company Financials
- 11.1.5.4. SWOT Analysis
- 11.1.6 STMicroelectronics NV
- 11.1.6.1. Company Overview
- 11.1.6.2. Products
- 11.1.6.3. Company Financials
- 11.1.6.4. SWOT Analysis
- 11.1.7 E-Peas SA
- 11.1.7.1. Company Overview
- 11.1.7.2. Products
- 11.1.7.3. Company Financials
- 11.1.7.4. SWOT Analysis
- 11.1.8 Texas Instruments Incorporated
- 11.1.8.1. Company Overview
- 11.1.8.2. Products
- 11.1.8.3. Company Financials
- 11.1.8.4. SWOT Analysis
- 11.1.9 EnoCean GmbH
- 11.1.9.1. Company Overview
- 11.1.9.2. Products
- 11.1.9.3. Company Financials
- 11.1.9.4. SWOT Analysis
- 11.1.10 Analog Devices Inc
- 11.1.10.1. Company Overview
- 11.1.10.2. Products
- 11.1.10.3. Company Financials
- 11.1.10.4. SWOT Analysis
- 11.1.11 ABB Limited
- 11.1.11.1. Company Overview
- 11.1.11.2. Products
- 11.1.11.3. Company Financials
- 11.1.11.4. SWOT Analysis
- 11.1.1 Piezo com*List Not Exhaustive
- 11.2. Market Entropy
- 11.2.1 Company's Key Areas Served
- 11.2.2 Recent Developments
- 11.3. Company Market Share Analysis 2025
- 11.3.1 Top 5 Companies Market Share Analysis
- 11.3.2 Top 3 Companies Market Share Analysis
- 11.4. List of Potential Customers
- 12. Research Methodology
List of Figures
- Figure 1: Global Energy Harvesting Systems Market Revenue Breakdown (million, %) by Region 2025 & 2033
- Figure 2: North America Energy Harvesting Systems Market Revenue (million), by Technology 2025 & 2033
- Figure 3: North America Energy Harvesting Systems Market Revenue Share (%), by Technology 2025 & 2033
- Figure 4: North America Energy Harvesting Systems Market Revenue (million), by Application 2025 & 2033
- Figure 5: North America Energy Harvesting Systems Market Revenue Share (%), by Application 2025 & 2033
- Figure 6: North America Energy Harvesting Systems Market Revenue (million), by Country 2025 & 2033
- Figure 7: North America Energy Harvesting Systems Market Revenue Share (%), by Country 2025 & 2033
- Figure 8: Europe Energy Harvesting Systems Market Revenue (million), by Technology 2025 & 2033
- Figure 9: Europe Energy Harvesting Systems Market Revenue Share (%), by Technology 2025 & 2033
- Figure 10: Europe Energy Harvesting Systems Market Revenue (million), by Application 2025 & 2033
- Figure 11: Europe Energy Harvesting Systems Market Revenue Share (%), by Application 2025 & 2033
- Figure 12: Europe Energy Harvesting Systems Market Revenue (million), by Country 2025 & 2033
- Figure 13: Europe Energy Harvesting Systems Market Revenue Share (%), by Country 2025 & 2033
- Figure 14: Asia Pacific Energy Harvesting Systems Market Revenue (million), by Technology 2025 & 2033
- Figure 15: Asia Pacific Energy Harvesting Systems Market Revenue Share (%), by Technology 2025 & 2033
- Figure 16: Asia Pacific Energy Harvesting Systems Market Revenue (million), by Application 2025 & 2033
- Figure 17: Asia Pacific Energy Harvesting Systems Market Revenue Share (%), by Application 2025 & 2033
- Figure 18: Asia Pacific Energy Harvesting Systems Market Revenue (million), by Country 2025 & 2033
- Figure 19: Asia Pacific Energy Harvesting Systems Market Revenue Share (%), by Country 2025 & 2033
- Figure 20: Rest of the World Energy Harvesting Systems Market Revenue (million), by Technology 2025 & 2033
- Figure 21: Rest of the World Energy Harvesting Systems Market Revenue Share (%), by Technology 2025 & 2033
- Figure 22: Rest of the World Energy Harvesting Systems Market Revenue (million), by Application 2025 & 2033
- Figure 23: Rest of the World Energy Harvesting Systems Market Revenue Share (%), by Application 2025 & 2033
- Figure 24: Rest of the World Energy Harvesting Systems Market Revenue (million), by Country 2025 & 2033
- Figure 25: Rest of the World Energy Harvesting Systems Market Revenue Share (%), by Country 2025 & 2033
List of Tables
- Table 1: Global Energy Harvesting Systems Market Revenue million Forecast, by Technology 2020 & 2033
- Table 2: Global Energy Harvesting Systems Market Revenue million Forecast, by Application 2020 & 2033
- Table 3: Global Energy Harvesting Systems Market Revenue million Forecast, by Region 2020 & 2033
- Table 4: Global Energy Harvesting Systems Market Revenue million Forecast, by Technology 2020 & 2033
- Table 5: Global Energy Harvesting Systems Market Revenue million Forecast, by Application 2020 & 2033
- Table 6: Global Energy Harvesting Systems Market Revenue million Forecast, by Country 2020 & 2033
- Table 7: Global Energy Harvesting Systems Market Revenue million Forecast, by Technology 2020 & 2033
- Table 8: Global Energy Harvesting Systems Market Revenue million Forecast, by Application 2020 & 2033
- Table 9: Global Energy Harvesting Systems Market Revenue million Forecast, by Country 2020 & 2033
- Table 10: Global Energy Harvesting Systems Market Revenue million Forecast, by Technology 2020 & 2033
- Table 11: Global Energy Harvesting Systems Market Revenue million Forecast, by Application 2020 & 2033
- Table 12: Global Energy Harvesting Systems Market Revenue million Forecast, by Country 2020 & 2033
- Table 13: Global Energy Harvesting Systems Market Revenue million Forecast, by Technology 2020 & 2033
- Table 14: Global Energy Harvesting Systems Market Revenue million Forecast, by Application 2020 & 2033
- Table 15: Global Energy Harvesting Systems Market Revenue million Forecast, by Country 2020 & 2033
Frequently Asked Questions
1. What is the projected Compound Annual Growth Rate (CAGR) of the Energy Harvesting Systems Market?
The projected CAGR is approximately 11.8%.
2. Which companies are prominent players in the Energy Harvesting Systems Market?
Key companies in the market include Piezo com*List Not Exhaustive, Microchip Technology Inc, Cypress Semiconductor Corporation, Powercast Corporation, Advanced Linear Devices Inc, STMicroelectronics NV, E-Peas SA, Texas Instruments Incorporated, EnoCean GmbH, Analog Devices Inc, ABB Limited.
3. What are the main segments of the Energy Harvesting Systems Market?
The market segments include Technology, Application.
4. Can you provide details about the market size?
The market size is estimated to be USD 700 million as of 2022.
5. What are some drivers contributing to market growth?
Growth of Smart Cities; Technology Developments in Manufacturing Industries.
6. What are the notable trends driving market growth?
Consumer Electronics to Hold Significant Market Share.
7. Are there any restraints impacting market growth?
Increasing Complexity of Design.
8. Can you provide examples of recent developments in the market?
March 2022: Powercast Corporation announced that it had shipped 10 million wireless RF Powerharvester PCC110 chips in the previous two years. The company credits this achievement to the rising demand for wireless power-over-distance solutions that liberate gadgets from cables, batteries, and positioning constraints, such as the direct contact with a charging surface mandated by the Qi wireless charging standard. With the help of Powercast's technology, untethered devices can be powered remotely (up to 80 feet away), which reduces or eliminates the need for batteries and connections while boosting functionality and efficiency and allowing for more flexible device placement.
9. What pricing options are available for accessing the report?
Pricing options include single-user, multi-user, and enterprise licenses priced at USD 4750, USD 5250, and USD 8750 respectively.
10. Is the market size provided in terms of value or volume?
The market size is provided in terms of value, measured in million.
11. Are there any specific market keywords associated with the report?
Yes, the market keyword associated with the report is "Energy Harvesting Systems Market," which aids in identifying and referencing the specific market segment covered.
12. How do I determine which pricing option suits my needs best?
The pricing options vary based on user requirements and access needs. Individual users may opt for single-user licenses, while businesses requiring broader access may choose multi-user or enterprise licenses for cost-effective access to the report.
13. Are there any additional resources or data provided in the Energy Harvesting Systems Market report?
While the report offers comprehensive insights, it's advisable to review the specific contents or supplementary materials provided to ascertain if additional resources or data are available.
14. How can I stay updated on further developments or reports in the Energy Harvesting Systems Market?
To stay informed about further developments, trends, and reports in the Energy Harvesting Systems Market, consider subscribing to industry newsletters, following relevant companies and organizations, or regularly checking reputable industry news sources and publications.
Methodology
Step 1 - Identification of Relevant Samples Size from Population Database


Step 2 - Approaches for Defining Global Market Size (Value, Volume* & Price*)

Note*: In applicable scenarios
Step 3 - Data Sources
Primary Research
- Web Analytics
- Survey Reports
- Research Institute
- Latest Research Reports
- Opinion Leaders
Secondary Research
- Annual Reports
- White Paper
- Latest Press Release
- Industry Association
- Paid Database
- Investor Presentations

Step 4 - Data Triangulation
Involves using different sources of information in order to increase the validity of a study
These sources are likely to be stakeholders in a program - participants, other researchers, program staff, other community members, and so on.
Then we put all data in single framework & apply various statistical tools to find out the dynamic on the market.
During the analysis stage, feedback from the stakeholder groups would be compared to determine areas of agreement as well as areas of divergence