

Key Insights
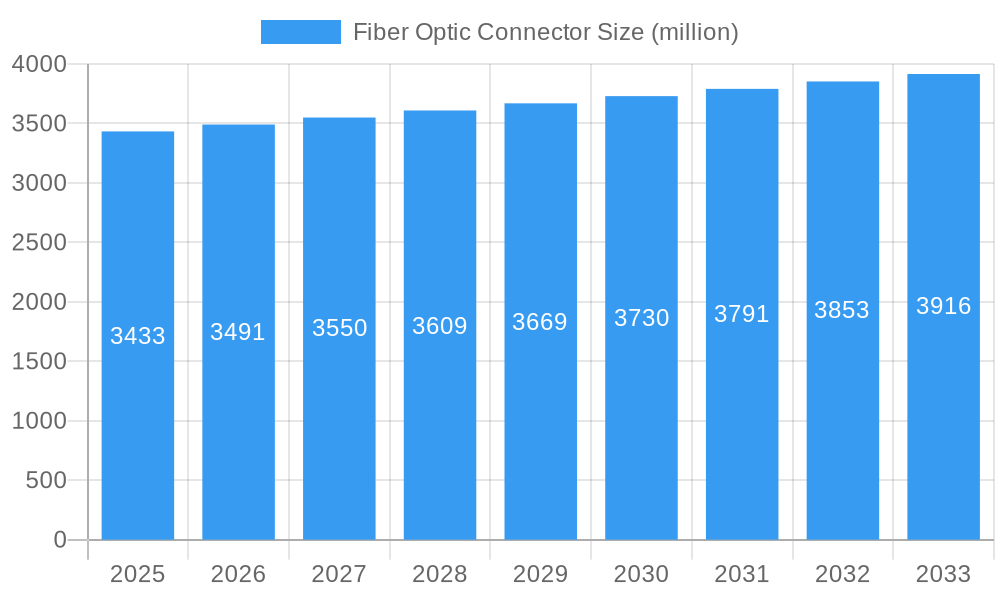
The global Fiber Optic Connector market is projected for steady growth, with a market size of $3433 million and a Compound Annual Growth Rate (CAGR) of 1.7% from 2025 to 2033. This moderate expansion is fueled by the escalating demand for high-speed data transmission across various sectors. Key drivers include the continued build-out of fiber optic networks for telecommunications and the increasing adoption of Fiber-to-the-Home (FTTH) services, driven by evolving consumer needs for faster internet and richer multimedia experiences. Furthermore, the burgeoning growth in data centers, cloud computing, and the Internet of Things (IoT) ecosystem necessitates robust and reliable fiber optic connectivity, directly translating into a sustained demand for advanced fiber optic connectors. The ongoing digital transformation across industries like healthcare, finance, and manufacturing also plays a pivotal role in propelling market expansion, as these sectors increasingly rely on high-bandwidth, low-latency communication infrastructure.
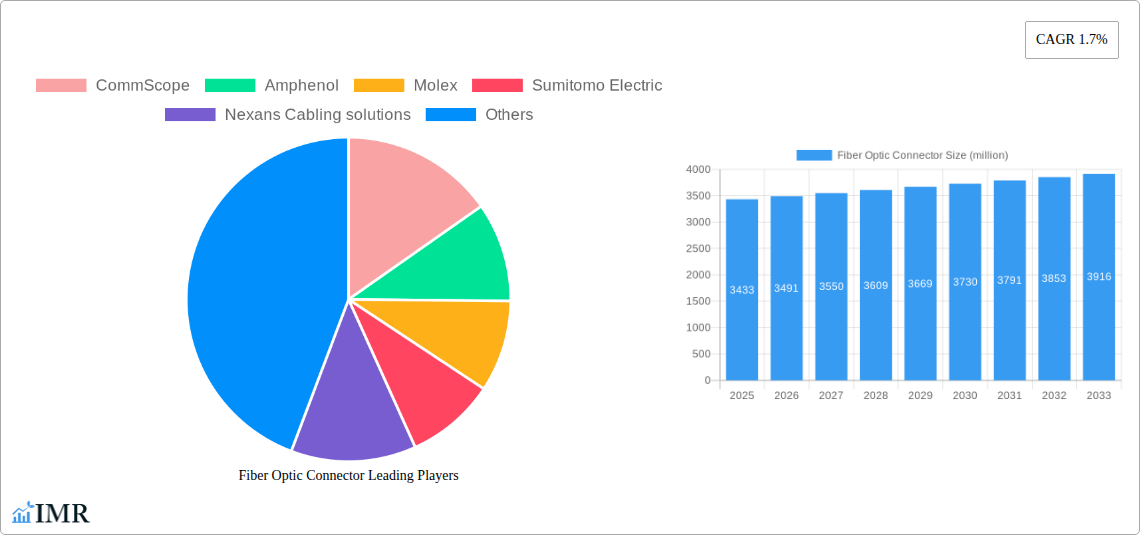
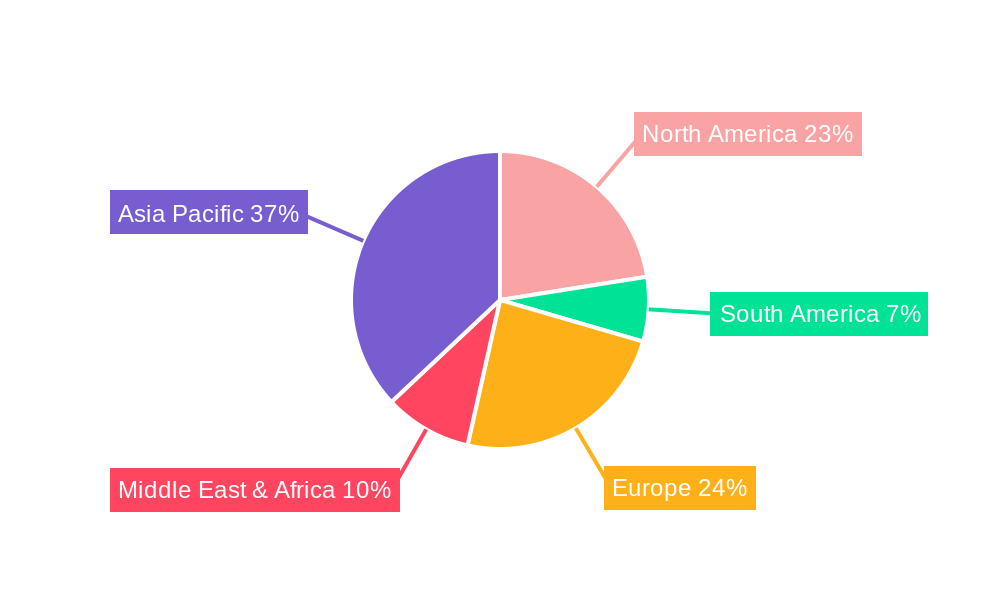
Fiber Optic Connector Market Size (In Billion)
The market is segmented by application into Family, Commercial, Public, and Other, with the Commercial and Public segments expected to represent significant demand due to large-scale infrastructure projects and enterprise network upgrades. By type, connectors such as FC, SC, LC, and ST are crucial components, with LC connectors likely to dominate due to their compact size and high density, making them ideal for modern, space-constrained applications. Geographically, Asia Pacific is anticipated to be a leading region, driven by rapid digitalization initiatives, significant investments in 5G infrastructure, and a substantial manufacturing base for fiber optic components. North America and Europe also represent mature yet growing markets, characterized by ongoing network modernization and the expansion of data center capacities. Restraints to market growth may include the high initial cost of deploying fiber optic infrastructure and the availability of alternative networking technologies in specific niche applications, although the long-term advantages of fiber optics generally outweigh these limitations.
Fiber Optic Connector Company Market Share
Fiber Optic Connector Market Report: Comprehensive Analysis and Future Outlook (2019-2033)
This in-depth report provides a complete analysis of the global Fiber Optic Connector market, forecasting its trajectory from 2025 to 2033. Delving into market dynamics, growth trends, regional dominance, product innovations, key drivers, challenges, and emerging opportunities, this report equips industry stakeholders with critical insights to navigate the evolving landscape. We explore parent and child market segments, offering a granular understanding of the industry's structure and potential. All quantitative values are presented in million units for clarity and ease of comparison.
Fiber Optic Connector Market Dynamics & Structure
The global Fiber Optic Connector market exhibits a moderately concentrated structure, with leading players like CommScope, Amphenol, Molex, Sumitomo Electric, and Nexans Cabling Solutions holding significant market shares. Technological innovation is a primary driver, fueled by the relentless demand for higher bandwidth, lower latency, and increased data transmission speeds across telecommunications, data centers, and emerging 5G infrastructure. Regulatory frameworks, particularly those promoting digital transformation and broadband expansion initiatives, also play a crucial role in shaping market growth. Competitive product substitutes, while limited in the core fiber optic connector space, can emerge from advancements in wireless technologies for short-range applications. End-user demographics are increasingly diverse, encompassing enterprises, telecommunication providers, government agencies, and residential users seeking robust and reliable connectivity solutions. Mergers and acquisitions (M&A) trends reveal a strategic consolidation aimed at expanding product portfolios, geographic reach, and technological capabilities. For instance, the past five years have seen approximately 15-20 significant M&A deals, valued at an aggregate of $800-$1,200 million, bolstering market concentration.
- Market Concentration: Moderately concentrated, with top 5 players holding an estimated 40-50% of the market share.
- Technological Innovation Drivers: Demand for higher bandwidth, 5G deployment, AI, and IoT proliferation.
- Regulatory Frameworks: Government initiatives for broadband expansion and digital infrastructure development.
- Competitive Product Substitutes: Limited for core fiber optic connectivity, but advancements in wireless technologies pose indirect competition for certain short-range applications.
- End-User Demographics: Diverse, including telecommunication providers, data centers, enterprises, and governments.
- M&A Trends: Strategic acquisitions to gain market share, expand technology offerings, and enhance vertical integration.
Fiber Optic Connector Growth Trends & Insights
The global Fiber Optic Connector market is poised for robust growth, driven by the insatiable demand for high-speed data transmission and the continuous expansion of digital infrastructure worldwide. Market size is projected to expand at a Compound Annual Growth Rate (CAGR) of approximately 8-10% during the forecast period of 2025-2033. This growth is underpinned by the escalating adoption rates of fiber optic technology in telecommunications, data centers, and enterprise networks, fueled by the proliferation of bandwidth-intensive applications such as cloud computing, artificial intelligence, and the Internet of Things (IoT). Technological disruptions, including the development of advanced connector types with higher port density and improved optical performance, are further stimulating market penetration. Consumer behavior shifts towards greater reliance on digital services and seamless connectivity are creating a sustained demand for reliable and high-performance fiber optic solutions. The market penetration of fiber optic connectors, currently estimated at around 60-65% in developed regions, is expected to increase significantly, particularly in emerging economies undergoing rapid digital transformation. By 2025, the estimated market size is projected to reach approximately $7,500 million, growing to an estimated $13,000 million by 2033. This upward trajectory is also influenced by the ongoing upgrades of existing networks to accommodate higher data speeds and the deployment of new optical fiber infrastructure for enhanced network capacity and future-proofing. The increasing prevalence of smart cities, advanced manufacturing, and the expansion of the metaverse are additional tailwinds contributing to the sustained demand for efficient and high-performance fiber optic connectors.
Dominant Regions, Countries, or Segments in Fiber Optic Connector
The Commercial application segment, particularly within data centers and enterprise networks, is a dominant force driving growth in the global Fiber Optic Connector market. This dominance is attributed to the burgeoning demand for high-speed data processing and storage, fueled by the widespread adoption of cloud computing, big data analytics, and artificial intelligence. North America and Europe currently lead in market share within this segment, driven by established technological infrastructure, significant investments in data center expansion, and stringent performance requirements for enterprise networks. The LC Connector type also holds a commanding position due to its compact size, high density, and excellent performance characteristics, making it the preferred choice for modern high-speed networking applications.
Key drivers for this dominance include:
- Economic Policies: Pro-business policies in North America and Europe encourage significant private sector investment in digital infrastructure.
- Infrastructure: Extensive existing fiber optic networks and ongoing upgrades to accommodate higher bandwidth demands.
- Technological Adoption: Rapid uptake of cloud services, AI, and IoT solutions by businesses.
- Market Share: The Commercial segment is estimated to hold approximately 45-50% of the overall Fiber Optic Connector market by value.
- Growth Potential: Continued expansion of data center capacity and increasing enterprise network complexity offer substantial growth potential.
The Asia Pacific region, particularly China, is rapidly emerging as a significant growth engine, driven by massive government investments in telecommunications infrastructure, the burgeoning e-commerce sector, and the rapid deployment of 5G networks. Countries like Japan and South Korea are also key contributors due to their advanced technological ecosystems and high adoption rates of sophisticated communication technologies. The Public application segment, encompassing telecommunications and broadband access initiatives, is also experiencing substantial growth, driven by government mandates for universal broadband access and the ongoing rollout of 5G infrastructure.
Fiber Optic Connector Product Landscape
The fiber optic connector market is characterized by continuous innovation in product design and performance. Key advancements include the development of higher port density connectors like the MPO/MTP for increased efficiency in data centers, as well as ruggedized connectors designed for harsh environmental conditions in industrial and military applications. Enhanced performance metrics such as lower insertion loss and higher return loss are crucial for enabling faster and more reliable data transmission. Unique selling propositions often revolve around ease of installation, superior durability, and compatibility with existing infrastructure, catering to the diverse needs of applications ranging from telecommunications backbones to specialized industrial equipment.
Key Drivers, Barriers & Challenges in Fiber Optic Connector
Key Drivers: The primary forces propelling the Fiber Optic Connector market are the exponential growth in data traffic, the global rollout of 5G networks, the expansion of data center infrastructure, and the increasing adoption of IoT devices. Technological advancements in connector design, offering higher bandwidth and lower signal loss, are also critical drivers. Furthermore, government initiatives and investments in digital infrastructure development worldwide are creating significant market opportunities.
Key Barriers & Challenges: Despite the positive outlook, the market faces challenges such as high upfront costs associated with fiber optic network deployment, especially in rural or less developed areas. Supply chain disruptions, including the availability of raw materials and skilled labor, can also impact production and lead times. Intense price competition among manufacturers, particularly in commoditized segments, can put pressure on profit margins. Furthermore, the complexity of installation and maintenance compared to copper-based solutions can act as a restraint in certain applications. Regulatory hurdles in some regions concerning infrastructure deployment and standardization can also pose challenges. The estimated impact of these challenges on market growth can range from 5-10% reduction in potential expansion.
Emerging Opportunities in Fiber Optic Connector
Emerging opportunities in the Fiber Optic Connector market are abundant, driven by the rapid evolution of technology and consumer demands. The burgeoning demand for high-speed connectivity in areas like virtual reality (VR), augmented reality (AR), and the metaverse presents a significant untapped market. The increasing adoption of fiber optics in automotive applications, for in-vehicle networking and autonomous driving systems, is another key growth area. Furthermore, advancements in miniaturization and ruggedization of connectors are opening doors for new applications in industrial automation, aerospace, and defense sectors. The development of smart sensors and the expansion of the Internet of Medical Things (IoMT) also present lucrative avenues for specialized fiber optic connector solutions.
Growth Accelerators in the Fiber Optic Connector Industry
Several catalysts are accelerating the long-term growth of the Fiber Optic Connector industry. Technological breakthroughs in materials science and manufacturing processes are enabling the production of connectors with enhanced performance at competitive costs. Strategic partnerships and collaborations between connector manufacturers, equipment vendors, and service providers are crucial for fostering innovation and expanding market reach. Market expansion strategies, including penetrating emerging economies and catering to niche applications, are vital for sustained growth. The increasing focus on sustainability and the development of eco-friendly connector solutions are also gaining traction, potentially becoming a significant growth accelerator.
Key Players Shaping the Fiber Optic Connector Market
- CommScope
- Amphenol
- Molex
- Sumitomo Electric
- Nexans Cabling Solutions
- Radiall
- 3M
- JAE
- HUBER + SUHNER
- Corning
- Yazaki
- Senko
- Rosenberger-OSI
- Delphi
- AFL
- LEMO
- Hirose
- FIT
- China Fiber Optic
- Sunsea
- Jonhon
- Longxing
- Ningbo Chitong
- Huawei
Notable Milestones in Fiber Optic Connector Sector
- 2019: Introduction of advanced LC connector variants offering higher density and improved performance by leading manufacturers.
- 2020: Significant increase in demand for fiber optic connectors driven by the surge in remote work and online education during the COVID-19 pandemic.
- 2021: Key players focus on MPO/MTP connector innovations to support the growing needs of hyperscale data centers.
- 2022: Increased investment in R&D for ruggedized and specialized fiber optic connectors for industrial and automotive applications.
- 2023: Growing emphasis on sustainable manufacturing practices and the development of eco-friendly connector materials.
- 2024: Anticipated advancements in optical transceiver integration with connectors for enhanced performance and cost-efficiency.
In-Depth Fiber Optic Connector Market Outlook
The future outlook for the Fiber Optic Connector market is exceptionally promising, fueled by persistent demand for high-speed data and pervasive digitalization. Growth accelerators such as continuous technological advancements in connector design, strategic alliances within the industry ecosystem, and aggressive market expansion into nascent economies will continue to propel the market forward. The integration of innovative applications like the metaverse and advancements in autonomous systems will further solidify the indispensable role of robust fiber optic connectivity. Strategic opportunities lie in developing specialized connectors for emerging sectors and catering to the unique demands of evolving network architectures, ensuring sustained revenue streams and market leadership.
Fiber Optic Connector Segmentation
-
1. Application
- 1.1. Family
- 1.2. Commercial
- 1.3. Public
- 1.4. Other
-
2. Type
- 2.1. FC Connector
- 2.2. SC Connector
- 2.3. LC Connector
- 2.4. ST Connector
Fiber Optic Connector Segmentation By Geography
-
1. North America
- 1.1. United States
- 1.2. Canada
- 1.3. Mexico
-
2. South America
- 2.1. Brazil
- 2.2. Argentina
- 2.3. Rest of South America
-
3. Europe
- 3.1. United Kingdom
- 3.2. Germany
- 3.3. France
- 3.4. Italy
- 3.5. Spain
- 3.6. Russia
- 3.7. Benelux
- 3.8. Nordics
- 3.9. Rest of Europe
-
4. Middle East & Africa
- 4.1. Turkey
- 4.2. Israel
- 4.3. GCC
- 4.4. North Africa
- 4.5. South Africa
- 4.6. Rest of Middle East & Africa
-
5. Asia Pacific
- 5.1. China
- 5.2. India
- 5.3. Japan
- 5.4. South Korea
- 5.5. ASEAN
- 5.6. Oceania
- 5.7. Rest of Asia Pacific
Fiber Optic Connector Regional Market Share
Geographic Coverage of Fiber Optic Connector
Fiber Optic Connector REPORT HIGHLIGHTS
| Aspects | Details |
|---|---|
| Study Period | 2020-2034 |
| Base Year | 2025 |
| Estimated Year | 2026 |
| Forecast Period | 2026-2034 |
| Historical Period | 2020-2025 |
| Growth Rate | CAGR of 1.7% from 2020-2034 |
| Segmentation |
|
Table of Contents
- 1. Introduction
- 1.1. Research Scope
- 1.2. Market Segmentation
- 1.3. Research Methodology
- 1.4. Definitions and Assumptions
- 2. Executive Summary
- 2.1. Introduction
- 3. Market Dynamics
- 3.1. Introduction
- 3.2. Market Drivers
- 3.3. Market Restrains
- 3.4. Market Trends
- 4. Market Factor Analysis
- 4.1. Porters Five Forces
- 4.2. Supply/Value Chain
- 4.3. PESTEL analysis
- 4.4. Market Entropy
- 4.5. Patent/Trademark Analysis
- 5. Global Fiber Optic Connector Analysis, Insights and Forecast, 2020-2032
- 5.1. Market Analysis, Insights and Forecast - by Application
- 5.1.1. Family
- 5.1.2. Commercial
- 5.1.3. Public
- 5.1.4. Other
- 5.2. Market Analysis, Insights and Forecast - by Type
- 5.2.1. FC Connector
- 5.2.2. SC Connector
- 5.2.3. LC Connector
- 5.2.4. ST Connector
- 5.3. Market Analysis, Insights and Forecast - by Region
- 5.3.1. North America
- 5.3.2. South America
- 5.3.3. Europe
- 5.3.4. Middle East & Africa
- 5.3.5. Asia Pacific
- 5.1. Market Analysis, Insights and Forecast - by Application
- 6. North America Fiber Optic Connector Analysis, Insights and Forecast, 2020-2032
- 6.1. Market Analysis, Insights and Forecast - by Application
- 6.1.1. Family
- 6.1.2. Commercial
- 6.1.3. Public
- 6.1.4. Other
- 6.2. Market Analysis, Insights and Forecast - by Type
- 6.2.1. FC Connector
- 6.2.2. SC Connector
- 6.2.3. LC Connector
- 6.2.4. ST Connector
- 6.1. Market Analysis, Insights and Forecast - by Application
- 7. South America Fiber Optic Connector Analysis, Insights and Forecast, 2020-2032
- 7.1. Market Analysis, Insights and Forecast - by Application
- 7.1.1. Family
- 7.1.2. Commercial
- 7.1.3. Public
- 7.1.4. Other
- 7.2. Market Analysis, Insights and Forecast - by Type
- 7.2.1. FC Connector
- 7.2.2. SC Connector
- 7.2.3. LC Connector
- 7.2.4. ST Connector
- 7.1. Market Analysis, Insights and Forecast - by Application
- 8. Europe Fiber Optic Connector Analysis, Insights and Forecast, 2020-2032
- 8.1. Market Analysis, Insights and Forecast - by Application
- 8.1.1. Family
- 8.1.2. Commercial
- 8.1.3. Public
- 8.1.4. Other
- 8.2. Market Analysis, Insights and Forecast - by Type
- 8.2.1. FC Connector
- 8.2.2. SC Connector
- 8.2.3. LC Connector
- 8.2.4. ST Connector
- 8.1. Market Analysis, Insights and Forecast - by Application
- 9. Middle East & Africa Fiber Optic Connector Analysis, Insights and Forecast, 2020-2032
- 9.1. Market Analysis, Insights and Forecast - by Application
- 9.1.1. Family
- 9.1.2. Commercial
- 9.1.3. Public
- 9.1.4. Other
- 9.2. Market Analysis, Insights and Forecast - by Type
- 9.2.1. FC Connector
- 9.2.2. SC Connector
- 9.2.3. LC Connector
- 9.2.4. ST Connector
- 9.1. Market Analysis, Insights and Forecast - by Application
- 10. Asia Pacific Fiber Optic Connector Analysis, Insights and Forecast, 2020-2032
- 10.1. Market Analysis, Insights and Forecast - by Application
- 10.1.1. Family
- 10.1.2. Commercial
- 10.1.3. Public
- 10.1.4. Other
- 10.2. Market Analysis, Insights and Forecast - by Type
- 10.2.1. FC Connector
- 10.2.2. SC Connector
- 10.2.3. LC Connector
- 10.2.4. ST Connector
- 10.1. Market Analysis, Insights and Forecast - by Application
- 11. Competitive Analysis
- 11.1. Global Market Share Analysis 2025
- 11.2. Company Profiles
- 11.2.1 CommScope
- 11.2.1.1. Overview
- 11.2.1.2. Products
- 11.2.1.3. SWOT Analysis
- 11.2.1.4. Recent Developments
- 11.2.1.5. Financials (Based on Availability)
- 11.2.2 Amphenol
- 11.2.2.1. Overview
- 11.2.2.2. Products
- 11.2.2.3. SWOT Analysis
- 11.2.2.4. Recent Developments
- 11.2.2.5. Financials (Based on Availability)
- 11.2.3 Molex
- 11.2.3.1. Overview
- 11.2.3.2. Products
- 11.2.3.3. SWOT Analysis
- 11.2.3.4. Recent Developments
- 11.2.3.5. Financials (Based on Availability)
- 11.2.4 Sumitomo Electric
- 11.2.4.1. Overview
- 11.2.4.2. Products
- 11.2.4.3. SWOT Analysis
- 11.2.4.4. Recent Developments
- 11.2.4.5. Financials (Based on Availability)
- 11.2.5 Nexans Cabling solutions
- 11.2.5.1. Overview
- 11.2.5.2. Products
- 11.2.5.3. SWOT Analysis
- 11.2.5.4. Recent Developments
- 11.2.5.5. Financials (Based on Availability)
- 11.2.6 Radiall
- 11.2.6.1. Overview
- 11.2.6.2. Products
- 11.2.6.3. SWOT Analysis
- 11.2.6.4. Recent Developments
- 11.2.6.5. Financials (Based on Availability)
- 11.2.7 3M
- 11.2.7.1. Overview
- 11.2.7.2. Products
- 11.2.7.3. SWOT Analysis
- 11.2.7.4. Recent Developments
- 11.2.7.5. Financials (Based on Availability)
- 11.2.8 JAE
- 11.2.8.1. Overview
- 11.2.8.2. Products
- 11.2.8.3. SWOT Analysis
- 11.2.8.4. Recent Developments
- 11.2.8.5. Financials (Based on Availability)
- 11.2.9 HUBER + SUHNER
- 11.2.9.1. Overview
- 11.2.9.2. Products
- 11.2.9.3. SWOT Analysis
- 11.2.9.4. Recent Developments
- 11.2.9.5. Financials (Based on Availability)
- 11.2.10 Corning
- 11.2.10.1. Overview
- 11.2.10.2. Products
- 11.2.10.3. SWOT Analysis
- 11.2.10.4. Recent Developments
- 11.2.10.5. Financials (Based on Availability)
- 11.2.11 Yazaki
- 11.2.11.1. Overview
- 11.2.11.2. Products
- 11.2.11.3. SWOT Analysis
- 11.2.11.4. Recent Developments
- 11.2.11.5. Financials (Based on Availability)
- 11.2.12 Senko
- 11.2.12.1. Overview
- 11.2.12.2. Products
- 11.2.12.3. SWOT Analysis
- 11.2.12.4. Recent Developments
- 11.2.12.5. Financials (Based on Availability)
- 11.2.13 Rosenberger-OSI
- 11.2.13.1. Overview
- 11.2.13.2. Products
- 11.2.13.3. SWOT Analysis
- 11.2.13.4. Recent Developments
- 11.2.13.5. Financials (Based on Availability)
- 11.2.14 Delphi
- 11.2.14.1. Overview
- 11.2.14.2. Products
- 11.2.14.3. SWOT Analysis
- 11.2.14.4. Recent Developments
- 11.2.14.5. Financials (Based on Availability)
- 11.2.15 AFL
- 11.2.15.1. Overview
- 11.2.15.2. Products
- 11.2.15.3. SWOT Analysis
- 11.2.15.4. Recent Developments
- 11.2.15.5. Financials (Based on Availability)
- 11.2.16 LEMO
- 11.2.16.1. Overview
- 11.2.16.2. Products
- 11.2.16.3. SWOT Analysis
- 11.2.16.4. Recent Developments
- 11.2.16.5. Financials (Based on Availability)
- 11.2.17 Hirose
- 11.2.17.1. Overview
- 11.2.17.2. Products
- 11.2.17.3. SWOT Analysis
- 11.2.17.4. Recent Developments
- 11.2.17.5. Financials (Based on Availability)
- 11.2.18 FIT
- 11.2.18.1. Overview
- 11.2.18.2. Products
- 11.2.18.3. SWOT Analysis
- 11.2.18.4. Recent Developments
- 11.2.18.5. Financials (Based on Availability)
- 11.2.19 China Fiber Optic
- 11.2.19.1. Overview
- 11.2.19.2. Products
- 11.2.19.3. SWOT Analysis
- 11.2.19.4. Recent Developments
- 11.2.19.5. Financials (Based on Availability)
- 11.2.20 Sunsea
- 11.2.20.1. Overview
- 11.2.20.2. Products
- 11.2.20.3. SWOT Analysis
- 11.2.20.4. Recent Developments
- 11.2.20.5. Financials (Based on Availability)
- 11.2.21 Jonhon
- 11.2.21.1. Overview
- 11.2.21.2. Products
- 11.2.21.3. SWOT Analysis
- 11.2.21.4. Recent Developments
- 11.2.21.5. Financials (Based on Availability)
- 11.2.22 Longxing
- 11.2.22.1. Overview
- 11.2.22.2. Products
- 11.2.22.3. SWOT Analysis
- 11.2.22.4. Recent Developments
- 11.2.22.5. Financials (Based on Availability)
- 11.2.23 Ningbo Chitong
- 11.2.23.1. Overview
- 11.2.23.2. Products
- 11.2.23.3. SWOT Analysis
- 11.2.23.4. Recent Developments
- 11.2.23.5. Financials (Based on Availability)
- 11.2.24 Huawei
- 11.2.24.1. Overview
- 11.2.24.2. Products
- 11.2.24.3. SWOT Analysis
- 11.2.24.4. Recent Developments
- 11.2.24.5. Financials (Based on Availability)
- 11.2.1 CommScope
List of Figures
- Figure 1: Global Fiber Optic Connector Revenue Breakdown (million, %) by Region 2025 & 2033
- Figure 2: North America Fiber Optic Connector Revenue (million), by Application 2025 & 2033
- Figure 3: North America Fiber Optic Connector Revenue Share (%), by Application 2025 & 2033
- Figure 4: North America Fiber Optic Connector Revenue (million), by Type 2025 & 2033
- Figure 5: North America Fiber Optic Connector Revenue Share (%), by Type 2025 & 2033
- Figure 6: North America Fiber Optic Connector Revenue (million), by Country 2025 & 2033
- Figure 7: North America Fiber Optic Connector Revenue Share (%), by Country 2025 & 2033
- Figure 8: South America Fiber Optic Connector Revenue (million), by Application 2025 & 2033
- Figure 9: South America Fiber Optic Connector Revenue Share (%), by Application 2025 & 2033
- Figure 10: South America Fiber Optic Connector Revenue (million), by Type 2025 & 2033
- Figure 11: South America Fiber Optic Connector Revenue Share (%), by Type 2025 & 2033
- Figure 12: South America Fiber Optic Connector Revenue (million), by Country 2025 & 2033
- Figure 13: South America Fiber Optic Connector Revenue Share (%), by Country 2025 & 2033
- Figure 14: Europe Fiber Optic Connector Revenue (million), by Application 2025 & 2033
- Figure 15: Europe Fiber Optic Connector Revenue Share (%), by Application 2025 & 2033
- Figure 16: Europe Fiber Optic Connector Revenue (million), by Type 2025 & 2033
- Figure 17: Europe Fiber Optic Connector Revenue Share (%), by Type 2025 & 2033
- Figure 18: Europe Fiber Optic Connector Revenue (million), by Country 2025 & 2033
- Figure 19: Europe Fiber Optic Connector Revenue Share (%), by Country 2025 & 2033
- Figure 20: Middle East & Africa Fiber Optic Connector Revenue (million), by Application 2025 & 2033
- Figure 21: Middle East & Africa Fiber Optic Connector Revenue Share (%), by Application 2025 & 2033
- Figure 22: Middle East & Africa Fiber Optic Connector Revenue (million), by Type 2025 & 2033
- Figure 23: Middle East & Africa Fiber Optic Connector Revenue Share (%), by Type 2025 & 2033
- Figure 24: Middle East & Africa Fiber Optic Connector Revenue (million), by Country 2025 & 2033
- Figure 25: Middle East & Africa Fiber Optic Connector Revenue Share (%), by Country 2025 & 2033
- Figure 26: Asia Pacific Fiber Optic Connector Revenue (million), by Application 2025 & 2033
- Figure 27: Asia Pacific Fiber Optic Connector Revenue Share (%), by Application 2025 & 2033
- Figure 28: Asia Pacific Fiber Optic Connector Revenue (million), by Type 2025 & 2033
- Figure 29: Asia Pacific Fiber Optic Connector Revenue Share (%), by Type 2025 & 2033
- Figure 30: Asia Pacific Fiber Optic Connector Revenue (million), by Country 2025 & 2033
- Figure 31: Asia Pacific Fiber Optic Connector Revenue Share (%), by Country 2025 & 2033
List of Tables
- Table 1: Global Fiber Optic Connector Revenue million Forecast, by Application 2020 & 2033
- Table 2: Global Fiber Optic Connector Revenue million Forecast, by Type 2020 & 2033
- Table 3: Global Fiber Optic Connector Revenue million Forecast, by Region 2020 & 2033
- Table 4: Global Fiber Optic Connector Revenue million Forecast, by Application 2020 & 2033
- Table 5: Global Fiber Optic Connector Revenue million Forecast, by Type 2020 & 2033
- Table 6: Global Fiber Optic Connector Revenue million Forecast, by Country 2020 & 2033
- Table 7: United States Fiber Optic Connector Revenue (million) Forecast, by Application 2020 & 2033
- Table 8: Canada Fiber Optic Connector Revenue (million) Forecast, by Application 2020 & 2033
- Table 9: Mexico Fiber Optic Connector Revenue (million) Forecast, by Application 2020 & 2033
- Table 10: Global Fiber Optic Connector Revenue million Forecast, by Application 2020 & 2033
- Table 11: Global Fiber Optic Connector Revenue million Forecast, by Type 2020 & 2033
- Table 12: Global Fiber Optic Connector Revenue million Forecast, by Country 2020 & 2033
- Table 13: Brazil Fiber Optic Connector Revenue (million) Forecast, by Application 2020 & 2033
- Table 14: Argentina Fiber Optic Connector Revenue (million) Forecast, by Application 2020 & 2033
- Table 15: Rest of South America Fiber Optic Connector Revenue (million) Forecast, by Application 2020 & 2033
- Table 16: Global Fiber Optic Connector Revenue million Forecast, by Application 2020 & 2033
- Table 17: Global Fiber Optic Connector Revenue million Forecast, by Type 2020 & 2033
- Table 18: Global Fiber Optic Connector Revenue million Forecast, by Country 2020 & 2033
- Table 19: United Kingdom Fiber Optic Connector Revenue (million) Forecast, by Application 2020 & 2033
- Table 20: Germany Fiber Optic Connector Revenue (million) Forecast, by Application 2020 & 2033
- Table 21: France Fiber Optic Connector Revenue (million) Forecast, by Application 2020 & 2033
- Table 22: Italy Fiber Optic Connector Revenue (million) Forecast, by Application 2020 & 2033
- Table 23: Spain Fiber Optic Connector Revenue (million) Forecast, by Application 2020 & 2033
- Table 24: Russia Fiber Optic Connector Revenue (million) Forecast, by Application 2020 & 2033
- Table 25: Benelux Fiber Optic Connector Revenue (million) Forecast, by Application 2020 & 2033
- Table 26: Nordics Fiber Optic Connector Revenue (million) Forecast, by Application 2020 & 2033
- Table 27: Rest of Europe Fiber Optic Connector Revenue (million) Forecast, by Application 2020 & 2033
- Table 28: Global Fiber Optic Connector Revenue million Forecast, by Application 2020 & 2033
- Table 29: Global Fiber Optic Connector Revenue million Forecast, by Type 2020 & 2033
- Table 30: Global Fiber Optic Connector Revenue million Forecast, by Country 2020 & 2033
- Table 31: Turkey Fiber Optic Connector Revenue (million) Forecast, by Application 2020 & 2033
- Table 32: Israel Fiber Optic Connector Revenue (million) Forecast, by Application 2020 & 2033
- Table 33: GCC Fiber Optic Connector Revenue (million) Forecast, by Application 2020 & 2033
- Table 34: North Africa Fiber Optic Connector Revenue (million) Forecast, by Application 2020 & 2033
- Table 35: South Africa Fiber Optic Connector Revenue (million) Forecast, by Application 2020 & 2033
- Table 36: Rest of Middle East & Africa Fiber Optic Connector Revenue (million) Forecast, by Application 2020 & 2033
- Table 37: Global Fiber Optic Connector Revenue million Forecast, by Application 2020 & 2033
- Table 38: Global Fiber Optic Connector Revenue million Forecast, by Type 2020 & 2033
- Table 39: Global Fiber Optic Connector Revenue million Forecast, by Country 2020 & 2033
- Table 40: China Fiber Optic Connector Revenue (million) Forecast, by Application 2020 & 2033
- Table 41: India Fiber Optic Connector Revenue (million) Forecast, by Application 2020 & 2033
- Table 42: Japan Fiber Optic Connector Revenue (million) Forecast, by Application 2020 & 2033
- Table 43: South Korea Fiber Optic Connector Revenue (million) Forecast, by Application 2020 & 2033
- Table 44: ASEAN Fiber Optic Connector Revenue (million) Forecast, by Application 2020 & 2033
- Table 45: Oceania Fiber Optic Connector Revenue (million) Forecast, by Application 2020 & 2033
- Table 46: Rest of Asia Pacific Fiber Optic Connector Revenue (million) Forecast, by Application 2020 & 2033
Frequently Asked Questions
1. What is the projected Compound Annual Growth Rate (CAGR) of the Fiber Optic Connector?
The projected CAGR is approximately 1.7%.
2. Which companies are prominent players in the Fiber Optic Connector?
Key companies in the market include CommScope, Amphenol, Molex, Sumitomo Electric, Nexans Cabling solutions, Radiall, 3M, JAE, HUBER + SUHNER, Corning, Yazaki, Senko, Rosenberger-OSI, Delphi, AFL, LEMO, Hirose, FIT, China Fiber Optic, Sunsea, Jonhon, Longxing, Ningbo Chitong, Huawei.
3. What are the main segments of the Fiber Optic Connector?
The market segments include Application, Type.
4. Can you provide details about the market size?
The market size is estimated to be USD 3433 million as of 2022.
5. What are some drivers contributing to market growth?
N/A
6. What are the notable trends driving market growth?
N/A
7. Are there any restraints impacting market growth?
N/A
8. Can you provide examples of recent developments in the market?
N/A
9. What pricing options are available for accessing the report?
Pricing options include single-user, multi-user, and enterprise licenses priced at USD 5900.00, USD 8850.00, and USD 11800.00 respectively.
10. Is the market size provided in terms of value or volume?
The market size is provided in terms of value, measured in million.
11. Are there any specific market keywords associated with the report?
Yes, the market keyword associated with the report is "Fiber Optic Connector," which aids in identifying and referencing the specific market segment covered.
12. How do I determine which pricing option suits my needs best?
The pricing options vary based on user requirements and access needs. Individual users may opt for single-user licenses, while businesses requiring broader access may choose multi-user or enterprise licenses for cost-effective access to the report.
13. Are there any additional resources or data provided in the Fiber Optic Connector report?
While the report offers comprehensive insights, it's advisable to review the specific contents or supplementary materials provided to ascertain if additional resources or data are available.
14. How can I stay updated on further developments or reports in the Fiber Optic Connector?
To stay informed about further developments, trends, and reports in the Fiber Optic Connector, consider subscribing to industry newsletters, following relevant companies and organizations, or regularly checking reputable industry news sources and publications.
Methodology
Step 1 - Identification of Relevant Samples Size from Population Database


Step 2 - Approaches for Defining Global Market Size (Value, Volume* & Price*)

Note*: In applicable scenarios
Step 3 - Data Sources
Primary Research
- Web Analytics
- Survey Reports
- Research Institute
- Latest Research Reports
- Opinion Leaders
Secondary Research
- Annual Reports
- White Paper
- Latest Press Release
- Industry Association
- Paid Database
- Investor Presentations

Step 4 - Data Triangulation
Involves using different sources of information in order to increase the validity of a study
These sources are likely to be stakeholders in a program - participants, other researchers, program staff, other community members, and so on.
Then we put all data in single framework & apply various statistical tools to find out the dynamic on the market.
During the analysis stage, feedback from the stakeholder groups would be compared to determine areas of agreement as well as areas of divergence