

Key Insights
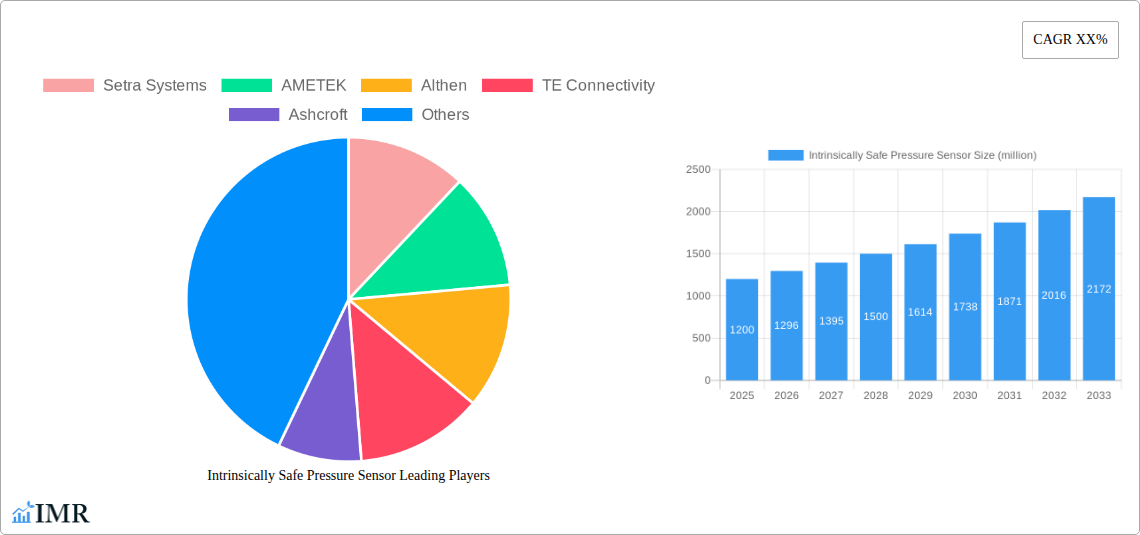
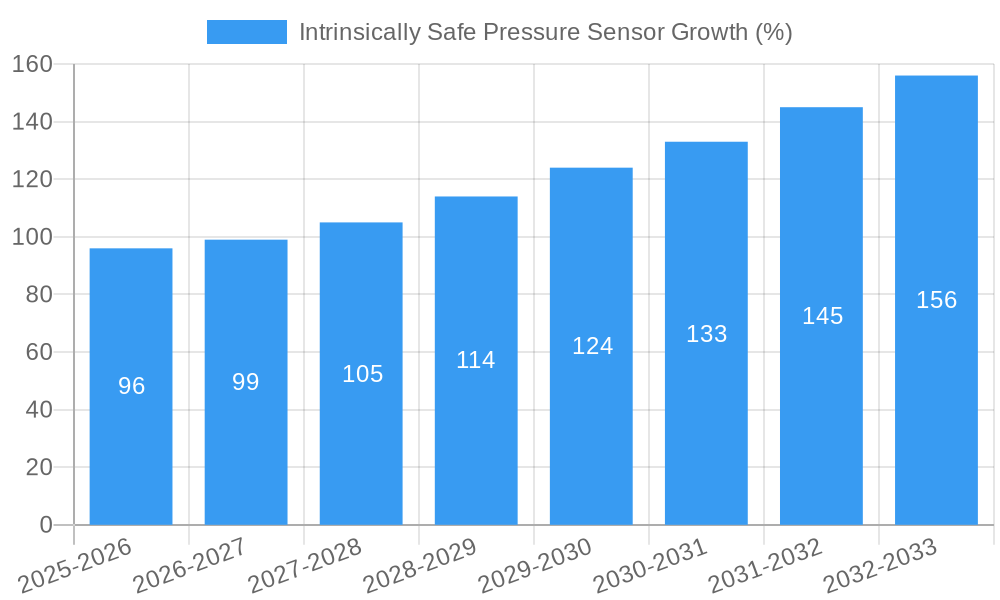
The global Intrinsically Safe Pressure Sensor market is poised for significant expansion, projected to reach an estimated $1,200 million by 2025. This robust growth is driven by an anticipated Compound Annual Growth Rate (CAGR) of 8.5% through 2033. The escalating demand for enhanced safety and reliability in hazardous environments, particularly within the Oil & Gas and Chemical industries, serves as a primary catalyst. These sectors rigorously adhere to stringent safety regulations, necessitating the deployment of intrinsically safe instrumentation to mitigate risks associated with flammable atmospheres. The increasing exploration and production activities, coupled with ongoing investments in infrastructure upgrades and process automation, further fuel the adoption of these specialized sensors. Moreover, advancements in sensor technology, including miniaturization, improved accuracy, and enhanced resistance to extreme conditions, are expanding their application scope and contributing to market vitality. The "Others" segment, encompassing industries like pharmaceuticals and mining, also presents burgeoning opportunities as safety consciousness permeates across diverse industrial landscapes.
The market is characterized by a dynamic competitive landscape, featuring established players such as Setra Systems, AMETEK, TE Connectivity, and WIKA, alongside emerging innovators. These companies are actively engaged in research and development to introduce more sophisticated and cost-effective intrinsically safe pressure sensors. Key trends shaping the market include the growing integration of IoT capabilities for remote monitoring and predictive maintenance, the development of wireless intrinsically safe sensors to reduce cabling complexity and installation costs, and a focus on sensors with higher accuracy and wider operating temperature ranges. However, the market faces certain restraints, including the high initial cost of intrinsically safe equipment and the need for specialized training for installation and maintenance. Despite these challenges, the overarching imperative for enhanced operational safety and compliance with evolving regulatory frameworks ensures a promising trajectory for the intrinsically safe pressure sensor market. The strategic importance of these sensors in safeguarding personnel and assets in high-risk operations underpins their sustained demand and market growth potential.
Intrinsically Safe Pressure Sensor Market Report: Comprehensive Analysis and Future Outlook (2019-2033)
This in-depth report provides a detailed market analysis of the Intrinsically Safe Pressure Sensor industry, offering strategic insights for stakeholders navigating this critical sector. Covering the period from 2019 to 2033, with a base year of 2025, this report delves into market dynamics, growth trends, regional dominance, product innovations, key drivers, barriers, and emerging opportunities. With a focus on high-traffic keywords such as "intrinsically safe pressure sensor," "hazardous area pressure measurement," "oil and gas pressure monitoring," "chemical plant safety sensors," and "compound pressure sensors," this report is optimized for maximum search engine visibility and engagement with industry professionals. We explore the parent and child market segments to provide a comprehensive understanding of market interdependencies and growth potential. All quantitative values are presented in million units for clarity and ease of analysis.
Intrinsically Safe Pressure Sensor Market Dynamics & Structure
The intrinsically safe pressure sensor market is characterized by a moderately concentrated landscape, with key players like Setra Systems, AMETEK, TE Connectivity, Ashcroft, and WIKA holding significant market shares. Technological innovation is a primary driver, particularly advancements in sensor accuracy, miniaturization, and digital communication protocols that enhance safety and operational efficiency in hazardous environments. Stringent regulatory frameworks, such as ATEX and IECEx certifications, are crucial for market entry and product adoption, ensuring devices meet rigorous safety standards for explosive atmospheres. Competitive product substitutes include explosion-proof enclosures for standard sensors and other protection methods, though intrinsically safe designs often offer superior safety and cost-effectiveness in specific applications. End-user demographics span a range of industries, with Oil & Gas and Chemical sectors being dominant, followed by Other applications including pharmaceuticals and mining. Mergers and acquisitions (M&A) trends are observable as companies seek to expand their product portfolios and geographical reach. For instance, there have been approximately 5-7 significant M&A deals in the broader industrial sensor market annually, with a subset impacting the intrinsically safe segment. Innovation barriers include the high cost of certification and the need for specialized R&D expertise.
- Market Concentration: Moderately concentrated with a few dominant players.
- Technological Innovation Drivers: Increased accuracy, miniaturization, digital interfaces, improved durability.
- Regulatory Frameworks: ATEX, IECEx, NEC – essential for market access.
- Competitive Product Substitutes: Explosion-proof enclosures, purged systems.
- End-User Demographics: Primarily Oil & Gas, Chemical, and specialized industrial sectors.
- M&A Trends: Strategic acquisitions to enhance product offerings and market presence.
- Innovation Barriers: High certification costs, specialized engineering talent.
Intrinsically Safe Pressure Sensor Growth Trends & Insights
The intrinsically safe pressure sensor market is poised for robust growth, driven by an escalating global demand for enhanced safety in hazardous industrial environments. The market size is projected to grow from approximately $500 million in 2019 to an estimated $950 million by 2033, exhibiting a Compound Annual Growth Rate (CAGR) of approximately 6.5%. This growth is fueled by increased investments in upstream and midstream oil and gas exploration and production, particularly in offshore and deep-water operations where safety is paramount. The chemical industry, with its inherent risks associated with handling volatile substances, is also a significant contributor to market expansion. Adoption rates of intrinsically safe sensors are rising as industries become more aware of their benefits in preventing catastrophic accidents and minimizing downtime. Technological disruptions are playing a crucial role, with the integration of IoT capabilities and advanced diagnostics enabling predictive maintenance and remote monitoring, further enhancing operational safety and efficiency. Consumer behavior shifts are evident, with end-users increasingly prioritizing reliability, long-term cost savings, and compliance with evolving safety regulations over initial purchase price. Market penetration is currently around 35% in key industrial sectors and is expected to reach over 50% by 2033. The increasing complexity of industrial processes and the growing emphasis on worker safety are creating sustained demand for these critical components. Furthermore, the transition towards more sustainable and environmentally friendly industrial practices indirectly supports the adoption of intrinsically safe technologies, as they contribute to preventing leaks and emissions. The global market for pressure sensors, the parent market, is projected to reach over $15 billion by 2033, with intrinsically safe variants representing a significant and growing niche within this larger market.
Dominant Regions, Countries, or Segments in Intrinsically Safe Pressure Sensor
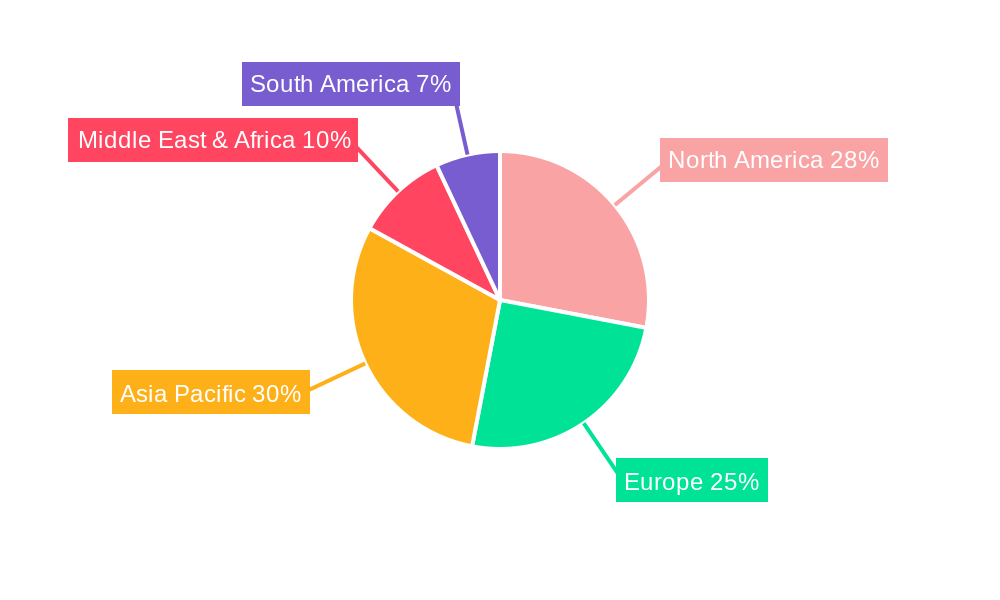
The intrinsically safe pressure sensor market's dominance is significantly influenced by regional industrial activities, regulatory environments, and technological adoption rates. North America and Europe currently lead the market, driven by well-established Oil & Gas and Chemical industries that are heavily regulated and prioritize safety. The United States, with its extensive shale gas production and advanced chemical manufacturing, represents a substantial market. Similarly, Germany and the United Kingdom in Europe are key markets due to their strong industrial base and stringent safety standards. The Asia-Pacific region, particularly China and India, is emerging as a high-growth area, propelled by rapid industrialization, significant investments in infrastructure, and increasing awareness of safety protocols. Economic policies encouraging industrial development and foreign investment in these regions are further accelerating the demand for intrinsically safe equipment.
Within the application segments, Oil & Gas is the most dominant, accounting for approximately 45% of the market share. This is attributed to the hazardous nature of exploration, extraction, refining, and transportation processes, where the risk of explosion is ever-present. The need for reliable pressure measurement in downhole drilling, pipeline monitoring, and refinery operations makes intrinsically safe sensors indispensable.
The Chemical segment follows closely, holding around 30% of the market. Chemical plants handle a wide array of flammable, explosive, and toxic substances, necessitating the highest safety standards. Process control, reactor monitoring, and storage tank level sensing in chemical facilities are critical applications where intrinsically safe pressure sensors are mandated.
The Others segment, encompassing pharmaceuticals, mining, and wastewater treatment, contributes the remaining 25%. While individually smaller, this segment collectively represents a significant and growing market as safety regulations tighten across all industrial verticals.
Considering the types, Gage pressure sensors are the most prevalent due to their widespread use in monitoring positive pressure relative to atmospheric pressure in various industrial processes. However, Compound pressure sensors, capable of measuring both positive and negative pressures, are gaining traction in specialized applications within the Oil & Gas and Chemical sectors, such as vacuum systems and pressure relief valve monitoring, contributing to a growing market share. The global market for pressure sensors, the parent market, is vast, and the intrinsically safe segment is a specialized yet crucial child market.
- Dominant Regions: North America, Europe, and rapidly growing Asia-Pacific.
- Key Countries: USA, Germany, UK, China, India.
- Dominant Application: Oil & Gas (approx. 45% market share).
- Second Leading Application: Chemical (approx. 30% market share).
- Emerging Application: Pharmaceuticals, Mining, Wastewater Treatment.
- Dominant Type: Gage Pressure Sensors.
- Growing Type: Compound Pressure Sensors.
- Key Drivers: Strict safety regulations, industrial expansion, technological advancements.
Intrinsically Safe Pressure Sensor Product Landscape
The intrinsically safe pressure sensor product landscape is defined by continuous innovation aimed at enhancing safety, accuracy, and connectivity in hazardous environments. Manufacturers are focusing on miniaturization, allowing for easier integration into confined spaces within industrial equipment. Advanced materials are being employed to improve sensor durability and resistance to corrosive media. Many new products feature digital output capabilities, enabling seamless integration with modern control systems and facilitating remote monitoring and data analytics. Unique selling propositions include enhanced ingress protection (IP ratings), extended temperature ranges, and sophisticated self-diagnostic features that proactively alert users to potential issues. Technological advancements are also driving the development of multi-parameter sensors that can measure pressure, temperature, and other variables simultaneously, offering greater value and efficiency.
Key Drivers, Barriers & Challenges in Intrinsically Safe Pressure Sensor
Key Drivers: The intrinsically safe pressure sensor market is propelled by a confluence of factors crucial for industrial safety and efficiency. Stringent government regulations mandating the use of certified equipment in hazardous zones are a primary driver. The relentless expansion of the Oil & Gas and Chemical industries, particularly in emerging economies, creates a sustained demand for reliable safety instrumentation. Technological advancements, such as the integration of IoT and advanced communication protocols, enhance the appeal of these sensors for modern industrial automation and predictive maintenance. Furthermore, a growing emphasis on worker safety and minimizing operational risks motivates companies to invest in intrinsically safe solutions.
Barriers & Challenges: Despite its growth, the market faces several hurdles. The high cost associated with obtaining certifications like ATEX and IECEx presents a significant barrier to entry for smaller manufacturers and increases the overall product price. The complexity of these certifications requires specialized expertise and rigorous testing. Supply chain disruptions, particularly for specialized components and rare earth materials, can impact production and lead times. Intense competition from alternative safety technologies and the need for continuous R&D to keep pace with evolving standards also pose challenges. Furthermore, a lack of skilled personnel trained in the installation and maintenance of intrinsically safe equipment can limit adoption in some regions. The global market for pressure sensors, the parent market, is very large, but the intrinsically safe niche within it is subject to these specific challenges.
Emerging Opportunities in Intrinsically Safe Pressure Sensor
Emerging opportunities in the intrinsically safe pressure sensor market lie in the expanding applications beyond traditional sectors. The increasing adoption of automation in industries like pharmaceuticals, food and beverage processing, and renewable energy (e.g., hydrogen production facilities) presents significant untapped potential. The development of wireless intrinsically safe pressure sensors is creating new avenues for remote monitoring in hard-to-reach or frequently reconfigured environments, reducing installation costs and downtime. Furthermore, the growing trend towards digitalization and the Industrial Internet of Things (IIoT) creates demand for sensors with advanced connectivity and data analytics capabilities, enabling predictive maintenance and process optimization in hazardous areas. The demand for sensors with extended lifespan and reduced maintenance requirements in remote or challenging locations also represents a key growth area.
Growth Accelerators in the Intrinsically Safe Pressure Sensor Industry
Several catalysts are accelerating long-term growth in the intrinsically safe pressure sensor industry. Technological breakthroughs in sensor materials and miniaturization are enabling more compact, robust, and cost-effective solutions. Strategic partnerships between sensor manufacturers and automation solution providers are creating integrated offerings that simplify implementation for end-users. Market expansion strategies, including targeting underdeveloped regions with rapidly industrializing economies, are unlocking new revenue streams. The ongoing drive for enhanced operational efficiency and reduced environmental impact in hazardous industries further fuels the adoption of intrinsically safe technologies. Investment in research and development focused on smart sensors with embedded analytics and predictive capabilities is a key growth accelerator.
Key Players Shaping the Intrinsically Safe Pressure Sensor Market
- Setra Systems
- AMETEK
- Althen
- TE Connectivity
- Ashcroft
- OMEGA
- NOSHOK
- WIKA
- ESI Technology
- Winters Instruments
- Gefran
- Core Sensors
- Alpha Instruments Inc
- Automation Products Group
- PMC
- Meiyo Electric
Notable Milestones in Intrinsically Safe Pressure Sensor Sector
- 2019: Introduction of new ATEX-certified compound pressure sensors with advanced digital communication options.
- 2020: TE Connectivity expands its portfolio with enhanced intrinsically safe pressure transmitters for harsh environments.
- 2021: WIKA launches a new generation of compact intrinsically safe pressure sensors for demanding industrial applications.
- 2022: AMETEK acquires a company specializing in hazardous area instrumentation, strengthening its market position.
- 2023: ESI Technology introduces a wireless intrinsically safe pressure monitoring system for remote asset tracking.
- 2024: Regulatory bodies update safety standards, driving demand for next-generation intrinsically safe sensor technology.
- 2025: Increased adoption of IIoT-enabled intrinsically safe sensors for predictive maintenance in the Oil & Gas sector.
In-Depth Intrinsically Safe Pressure Sensor Market Outlook
The intrinsically safe pressure sensor market is projected for sustained and significant growth, driven by an unwavering global commitment to industrial safety and operational excellence. The ongoing digital transformation in industries, coupled with the increasing complexity of hazardous operations, will continue to elevate the demand for reliable, connected, and intelligent safety instrumentation. Strategic investments in emerging markets, particularly in the Asia-Pacific region, coupled with the continuous innovation in sensor technology, will act as primary growth accelerators. Companies that can offer integrated solutions, focusing on data analytics and predictive capabilities, will be well-positioned to capture a larger market share. The parent market for pressure sensors offers a broad scope, but the intrinsically safe segment's future is bright due to its indispensable role in mitigating risks and ensuring compliance in critical industrial sectors.
Intrinsically Safe Pressure Sensor Segmentation
-
1. Application
- 1.1. Oil & Gas
- 1.2. Chemical
- 1.3. Others
-
2. Types
- 2.1. Compound
- 2.2. Gage
Intrinsically Safe Pressure Sensor Segmentation By Geography
-
1. North America
- 1.1. United States
- 1.2. Canada
- 1.3. Mexico
-
2. South America
- 2.1. Brazil
- 2.2. Argentina
- 2.3. Rest of South America
-
3. Europe
- 3.1. United Kingdom
- 3.2. Germany
- 3.3. France
- 3.4. Italy
- 3.5. Spain
- 3.6. Russia
- 3.7. Benelux
- 3.8. Nordics
- 3.9. Rest of Europe
-
4. Middle East & Africa
- 4.1. Turkey
- 4.2. Israel
- 4.3. GCC
- 4.4. North Africa
- 4.5. South Africa
- 4.6. Rest of Middle East & Africa
-
5. Asia Pacific
- 5.1. China
- 5.2. India
- 5.3. Japan
- 5.4. South Korea
- 5.5. ASEAN
- 5.6. Oceania
- 5.7. Rest of Asia Pacific
Intrinsically Safe Pressure Sensor REPORT HIGHLIGHTS
| Aspects | Details |
|---|---|
| Study Period | 2019-2033 |
| Base Year | 2024 |
| Estimated Year | 2025 |
| Forecast Period | 2025-2033 |
| Historical Period | 2019-2024 |
| Growth Rate | CAGR of XX% from 2019-2033 |
| Segmentation |
|
Table of Contents
- 1. Introduction
- 1.1. Research Scope
- 1.2. Market Segmentation
- 1.3. Research Methodology
- 1.4. Definitions and Assumptions
- 2. Executive Summary
- 2.1. Introduction
- 3. Market Dynamics
- 3.1. Introduction
- 3.2. Market Drivers
- 3.3. Market Restrains
- 3.4. Market Trends
- 4. Market Factor Analysis
- 4.1. Porters Five Forces
- 4.2. Supply/Value Chain
- 4.3. PESTEL analysis
- 4.4. Market Entropy
- 4.5. Patent/Trademark Analysis
- 5. Global Intrinsically Safe Pressure Sensor Analysis, Insights and Forecast, 2019-2031
- 5.1. Market Analysis, Insights and Forecast - by Application
- 5.1.1. Oil & Gas
- 5.1.2. Chemical
- 5.1.3. Others
- 5.2. Market Analysis, Insights and Forecast - by Types
- 5.2.1. Compound
- 5.2.2. Gage
- 5.3. Market Analysis, Insights and Forecast - by Region
- 5.3.1. North America
- 5.3.2. South America
- 5.3.3. Europe
- 5.3.4. Middle East & Africa
- 5.3.5. Asia Pacific
- 5.1. Market Analysis, Insights and Forecast - by Application
- 6. North America Intrinsically Safe Pressure Sensor Analysis, Insights and Forecast, 2019-2031
- 6.1. Market Analysis, Insights and Forecast - by Application
- 6.1.1. Oil & Gas
- 6.1.2. Chemical
- 6.1.3. Others
- 6.2. Market Analysis, Insights and Forecast - by Types
- 6.2.1. Compound
- 6.2.2. Gage
- 6.1. Market Analysis, Insights and Forecast - by Application
- 7. South America Intrinsically Safe Pressure Sensor Analysis, Insights and Forecast, 2019-2031
- 7.1. Market Analysis, Insights and Forecast - by Application
- 7.1.1. Oil & Gas
- 7.1.2. Chemical
- 7.1.3. Others
- 7.2. Market Analysis, Insights and Forecast - by Types
- 7.2.1. Compound
- 7.2.2. Gage
- 7.1. Market Analysis, Insights and Forecast - by Application
- 8. Europe Intrinsically Safe Pressure Sensor Analysis, Insights and Forecast, 2019-2031
- 8.1. Market Analysis, Insights and Forecast - by Application
- 8.1.1. Oil & Gas
- 8.1.2. Chemical
- 8.1.3. Others
- 8.2. Market Analysis, Insights and Forecast - by Types
- 8.2.1. Compound
- 8.2.2. Gage
- 8.1. Market Analysis, Insights and Forecast - by Application
- 9. Middle East & Africa Intrinsically Safe Pressure Sensor Analysis, Insights and Forecast, 2019-2031
- 9.1. Market Analysis, Insights and Forecast - by Application
- 9.1.1. Oil & Gas
- 9.1.2. Chemical
- 9.1.3. Others
- 9.2. Market Analysis, Insights and Forecast - by Types
- 9.2.1. Compound
- 9.2.2. Gage
- 9.1. Market Analysis, Insights and Forecast - by Application
- 10. Asia Pacific Intrinsically Safe Pressure Sensor Analysis, Insights and Forecast, 2019-2031
- 10.1. Market Analysis, Insights and Forecast - by Application
- 10.1.1. Oil & Gas
- 10.1.2. Chemical
- 10.1.3. Others
- 10.2. Market Analysis, Insights and Forecast - by Types
- 10.2.1. Compound
- 10.2.2. Gage
- 10.1. Market Analysis, Insights and Forecast - by Application
- 11. Competitive Analysis
- 11.1. Global Market Share Analysis 2024
- 11.2. Company Profiles
- 11.2.1 Setra Systems
- 11.2.1.1. Overview
- 11.2.1.2. Products
- 11.2.1.3. SWOT Analysis
- 11.2.1.4. Recent Developments
- 11.2.1.5. Financials (Based on Availability)
- 11.2.2 AMETEK
- 11.2.2.1. Overview
- 11.2.2.2. Products
- 11.2.2.3. SWOT Analysis
- 11.2.2.4. Recent Developments
- 11.2.2.5. Financials (Based on Availability)
- 11.2.3 Althen
- 11.2.3.1. Overview
- 11.2.3.2. Products
- 11.2.3.3. SWOT Analysis
- 11.2.3.4. Recent Developments
- 11.2.3.5. Financials (Based on Availability)
- 11.2.4 TE Connectivity
- 11.2.4.1. Overview
- 11.2.4.2. Products
- 11.2.4.3. SWOT Analysis
- 11.2.4.4. Recent Developments
- 11.2.4.5. Financials (Based on Availability)
- 11.2.5 Ashcroft
- 11.2.5.1. Overview
- 11.2.5.2. Products
- 11.2.5.3. SWOT Analysis
- 11.2.5.4. Recent Developments
- 11.2.5.5. Financials (Based on Availability)
- 11.2.6 OMEGA
- 11.2.6.1. Overview
- 11.2.6.2. Products
- 11.2.6.3. SWOT Analysis
- 11.2.6.4. Recent Developments
- 11.2.6.5. Financials (Based on Availability)
- 11.2.7 NOSHOK
- 11.2.7.1. Overview
- 11.2.7.2. Products
- 11.2.7.3. SWOT Analysis
- 11.2.7.4. Recent Developments
- 11.2.7.5. Financials (Based on Availability)
- 11.2.8 WIKA
- 11.2.8.1. Overview
- 11.2.8.2. Products
- 11.2.8.3. SWOT Analysis
- 11.2.8.4. Recent Developments
- 11.2.8.5. Financials (Based on Availability)
- 11.2.9 ESI Technology
- 11.2.9.1. Overview
- 11.2.9.2. Products
- 11.2.9.3. SWOT Analysis
- 11.2.9.4. Recent Developments
- 11.2.9.5. Financials (Based on Availability)
- 11.2.10 Winters Instruments
- 11.2.10.1. Overview
- 11.2.10.2. Products
- 11.2.10.3. SWOT Analysis
- 11.2.10.4. Recent Developments
- 11.2.10.5. Financials (Based on Availability)
- 11.2.11 Gefran
- 11.2.11.1. Overview
- 11.2.11.2. Products
- 11.2.11.3. SWOT Analysis
- 11.2.11.4. Recent Developments
- 11.2.11.5. Financials (Based on Availability)
- 11.2.12 Core Sensors
- 11.2.12.1. Overview
- 11.2.12.2. Products
- 11.2.12.3. SWOT Analysis
- 11.2.12.4. Recent Developments
- 11.2.12.5. Financials (Based on Availability)
- 11.2.13 Alpha Instruments Inc
- 11.2.13.1. Overview
- 11.2.13.2. Products
- 11.2.13.3. SWOT Analysis
- 11.2.13.4. Recent Developments
- 11.2.13.5. Financials (Based on Availability)
- 11.2.14 Automation Products Group
- 11.2.14.1. Overview
- 11.2.14.2. Products
- 11.2.14.3. SWOT Analysis
- 11.2.14.4. Recent Developments
- 11.2.14.5. Financials (Based on Availability)
- 11.2.15 PMC
- 11.2.15.1. Overview
- 11.2.15.2. Products
- 11.2.15.3. SWOT Analysis
- 11.2.15.4. Recent Developments
- 11.2.15.5. Financials (Based on Availability)
- 11.2.16 Meiyo Electric
- 11.2.16.1. Overview
- 11.2.16.2. Products
- 11.2.16.3. SWOT Analysis
- 11.2.16.4. Recent Developments
- 11.2.16.5. Financials (Based on Availability)
- 11.2.1 Setra Systems
List of Figures
- Figure 1: Global Intrinsically Safe Pressure Sensor Revenue Breakdown (million, %) by Region 2024 & 2032
- Figure 2: North America Intrinsically Safe Pressure Sensor Revenue (million), by Application 2024 & 2032
- Figure 3: North America Intrinsically Safe Pressure Sensor Revenue Share (%), by Application 2024 & 2032
- Figure 4: North America Intrinsically Safe Pressure Sensor Revenue (million), by Types 2024 & 2032
- Figure 5: North America Intrinsically Safe Pressure Sensor Revenue Share (%), by Types 2024 & 2032
- Figure 6: North America Intrinsically Safe Pressure Sensor Revenue (million), by Country 2024 & 2032
- Figure 7: North America Intrinsically Safe Pressure Sensor Revenue Share (%), by Country 2024 & 2032
- Figure 8: South America Intrinsically Safe Pressure Sensor Revenue (million), by Application 2024 & 2032
- Figure 9: South America Intrinsically Safe Pressure Sensor Revenue Share (%), by Application 2024 & 2032
- Figure 10: South America Intrinsically Safe Pressure Sensor Revenue (million), by Types 2024 & 2032
- Figure 11: South America Intrinsically Safe Pressure Sensor Revenue Share (%), by Types 2024 & 2032
- Figure 12: South America Intrinsically Safe Pressure Sensor Revenue (million), by Country 2024 & 2032
- Figure 13: South America Intrinsically Safe Pressure Sensor Revenue Share (%), by Country 2024 & 2032
- Figure 14: Europe Intrinsically Safe Pressure Sensor Revenue (million), by Application 2024 & 2032
- Figure 15: Europe Intrinsically Safe Pressure Sensor Revenue Share (%), by Application 2024 & 2032
- Figure 16: Europe Intrinsically Safe Pressure Sensor Revenue (million), by Types 2024 & 2032
- Figure 17: Europe Intrinsically Safe Pressure Sensor Revenue Share (%), by Types 2024 & 2032
- Figure 18: Europe Intrinsically Safe Pressure Sensor Revenue (million), by Country 2024 & 2032
- Figure 19: Europe Intrinsically Safe Pressure Sensor Revenue Share (%), by Country 2024 & 2032
- Figure 20: Middle East & Africa Intrinsically Safe Pressure Sensor Revenue (million), by Application 2024 & 2032
- Figure 21: Middle East & Africa Intrinsically Safe Pressure Sensor Revenue Share (%), by Application 2024 & 2032
- Figure 22: Middle East & Africa Intrinsically Safe Pressure Sensor Revenue (million), by Types 2024 & 2032
- Figure 23: Middle East & Africa Intrinsically Safe Pressure Sensor Revenue Share (%), by Types 2024 & 2032
- Figure 24: Middle East & Africa Intrinsically Safe Pressure Sensor Revenue (million), by Country 2024 & 2032
- Figure 25: Middle East & Africa Intrinsically Safe Pressure Sensor Revenue Share (%), by Country 2024 & 2032
- Figure 26: Asia Pacific Intrinsically Safe Pressure Sensor Revenue (million), by Application 2024 & 2032
- Figure 27: Asia Pacific Intrinsically Safe Pressure Sensor Revenue Share (%), by Application 2024 & 2032
- Figure 28: Asia Pacific Intrinsically Safe Pressure Sensor Revenue (million), by Types 2024 & 2032
- Figure 29: Asia Pacific Intrinsically Safe Pressure Sensor Revenue Share (%), by Types 2024 & 2032
- Figure 30: Asia Pacific Intrinsically Safe Pressure Sensor Revenue (million), by Country 2024 & 2032
- Figure 31: Asia Pacific Intrinsically Safe Pressure Sensor Revenue Share (%), by Country 2024 & 2032
List of Tables
- Table 1: Global Intrinsically Safe Pressure Sensor Revenue million Forecast, by Region 2019 & 2032
- Table 2: Global Intrinsically Safe Pressure Sensor Revenue million Forecast, by Application 2019 & 2032
- Table 3: Global Intrinsically Safe Pressure Sensor Revenue million Forecast, by Types 2019 & 2032
- Table 4: Global Intrinsically Safe Pressure Sensor Revenue million Forecast, by Region 2019 & 2032
- Table 5: Global Intrinsically Safe Pressure Sensor Revenue million Forecast, by Application 2019 & 2032
- Table 6: Global Intrinsically Safe Pressure Sensor Revenue million Forecast, by Types 2019 & 2032
- Table 7: Global Intrinsically Safe Pressure Sensor Revenue million Forecast, by Country 2019 & 2032
- Table 8: United States Intrinsically Safe Pressure Sensor Revenue (million) Forecast, by Application 2019 & 2032
- Table 9: Canada Intrinsically Safe Pressure Sensor Revenue (million) Forecast, by Application 2019 & 2032
- Table 10: Mexico Intrinsically Safe Pressure Sensor Revenue (million) Forecast, by Application 2019 & 2032
- Table 11: Global Intrinsically Safe Pressure Sensor Revenue million Forecast, by Application 2019 & 2032
- Table 12: Global Intrinsically Safe Pressure Sensor Revenue million Forecast, by Types 2019 & 2032
- Table 13: Global Intrinsically Safe Pressure Sensor Revenue million Forecast, by Country 2019 & 2032
- Table 14: Brazil Intrinsically Safe Pressure Sensor Revenue (million) Forecast, by Application 2019 & 2032
- Table 15: Argentina Intrinsically Safe Pressure Sensor Revenue (million) Forecast, by Application 2019 & 2032
- Table 16: Rest of South America Intrinsically Safe Pressure Sensor Revenue (million) Forecast, by Application 2019 & 2032
- Table 17: Global Intrinsically Safe Pressure Sensor Revenue million Forecast, by Application 2019 & 2032
- Table 18: Global Intrinsically Safe Pressure Sensor Revenue million Forecast, by Types 2019 & 2032
- Table 19: Global Intrinsically Safe Pressure Sensor Revenue million Forecast, by Country 2019 & 2032
- Table 20: United Kingdom Intrinsically Safe Pressure Sensor Revenue (million) Forecast, by Application 2019 & 2032
- Table 21: Germany Intrinsically Safe Pressure Sensor Revenue (million) Forecast, by Application 2019 & 2032
- Table 22: France Intrinsically Safe Pressure Sensor Revenue (million) Forecast, by Application 2019 & 2032
- Table 23: Italy Intrinsically Safe Pressure Sensor Revenue (million) Forecast, by Application 2019 & 2032
- Table 24: Spain Intrinsically Safe Pressure Sensor Revenue (million) Forecast, by Application 2019 & 2032
- Table 25: Russia Intrinsically Safe Pressure Sensor Revenue (million) Forecast, by Application 2019 & 2032
- Table 26: Benelux Intrinsically Safe Pressure Sensor Revenue (million) Forecast, by Application 2019 & 2032
- Table 27: Nordics Intrinsically Safe Pressure Sensor Revenue (million) Forecast, by Application 2019 & 2032
- Table 28: Rest of Europe Intrinsically Safe Pressure Sensor Revenue (million) Forecast, by Application 2019 & 2032
- Table 29: Global Intrinsically Safe Pressure Sensor Revenue million Forecast, by Application 2019 & 2032
- Table 30: Global Intrinsically Safe Pressure Sensor Revenue million Forecast, by Types 2019 & 2032
- Table 31: Global Intrinsically Safe Pressure Sensor Revenue million Forecast, by Country 2019 & 2032
- Table 32: Turkey Intrinsically Safe Pressure Sensor Revenue (million) Forecast, by Application 2019 & 2032
- Table 33: Israel Intrinsically Safe Pressure Sensor Revenue (million) Forecast, by Application 2019 & 2032
- Table 34: GCC Intrinsically Safe Pressure Sensor Revenue (million) Forecast, by Application 2019 & 2032
- Table 35: North Africa Intrinsically Safe Pressure Sensor Revenue (million) Forecast, by Application 2019 & 2032
- Table 36: South Africa Intrinsically Safe Pressure Sensor Revenue (million) Forecast, by Application 2019 & 2032
- Table 37: Rest of Middle East & Africa Intrinsically Safe Pressure Sensor Revenue (million) Forecast, by Application 2019 & 2032
- Table 38: Global Intrinsically Safe Pressure Sensor Revenue million Forecast, by Application 2019 & 2032
- Table 39: Global Intrinsically Safe Pressure Sensor Revenue million Forecast, by Types 2019 & 2032
- Table 40: Global Intrinsically Safe Pressure Sensor Revenue million Forecast, by Country 2019 & 2032
- Table 41: China Intrinsically Safe Pressure Sensor Revenue (million) Forecast, by Application 2019 & 2032
- Table 42: India Intrinsically Safe Pressure Sensor Revenue (million) Forecast, by Application 2019 & 2032
- Table 43: Japan Intrinsically Safe Pressure Sensor Revenue (million) Forecast, by Application 2019 & 2032
- Table 44: South Korea Intrinsically Safe Pressure Sensor Revenue (million) Forecast, by Application 2019 & 2032
- Table 45: ASEAN Intrinsically Safe Pressure Sensor Revenue (million) Forecast, by Application 2019 & 2032
- Table 46: Oceania Intrinsically Safe Pressure Sensor Revenue (million) Forecast, by Application 2019 & 2032
- Table 47: Rest of Asia Pacific Intrinsically Safe Pressure Sensor Revenue (million) Forecast, by Application 2019 & 2032
Frequently Asked Questions
1. What is the projected Compound Annual Growth Rate (CAGR) of the Intrinsically Safe Pressure Sensor?
The projected CAGR is approximately XX%.
2. Which companies are prominent players in the Intrinsically Safe Pressure Sensor?
Key companies in the market include Setra Systems, AMETEK, Althen, TE Connectivity, Ashcroft, OMEGA, NOSHOK, WIKA, ESI Technology, Winters Instruments, Gefran, Core Sensors, Alpha Instruments Inc, Automation Products Group, PMC, Meiyo Electric.
3. What are the main segments of the Intrinsically Safe Pressure Sensor?
The market segments include Application, Types.
4. Can you provide details about the market size?
The market size is estimated to be USD XXX million as of 2022.
5. What are some drivers contributing to market growth?
N/A
6. What are the notable trends driving market growth?
N/A
7. Are there any restraints impacting market growth?
N/A
8. Can you provide examples of recent developments in the market?
N/A
9. What pricing options are available for accessing the report?
Pricing options include single-user, multi-user, and enterprise licenses priced at USD 2900.00, USD 4350.00, and USD 5800.00 respectively.
10. Is the market size provided in terms of value or volume?
The market size is provided in terms of value, measured in million.
11. Are there any specific market keywords associated with the report?
Yes, the market keyword associated with the report is "Intrinsically Safe Pressure Sensor," which aids in identifying and referencing the specific market segment covered.
12. How do I determine which pricing option suits my needs best?
The pricing options vary based on user requirements and access needs. Individual users may opt for single-user licenses, while businesses requiring broader access may choose multi-user or enterprise licenses for cost-effective access to the report.
13. Are there any additional resources or data provided in the Intrinsically Safe Pressure Sensor report?
While the report offers comprehensive insights, it's advisable to review the specific contents or supplementary materials provided to ascertain if additional resources or data are available.
14. How can I stay updated on further developments or reports in the Intrinsically Safe Pressure Sensor?
To stay informed about further developments, trends, and reports in the Intrinsically Safe Pressure Sensor, consider subscribing to industry newsletters, following relevant companies and organizations, or regularly checking reputable industry news sources and publications.
Methodology
Step 1 - Identification of Relevant Samples Size from Population Database


Step 2 - Approaches for Defining Global Market Size (Value, Volume* & Price*)

Note*: In applicable scenarios
Step 3 - Data Sources
Primary Research
- Web Analytics
- Survey Reports
- Research Institute
- Latest Research Reports
- Opinion Leaders
Secondary Research
- Annual Reports
- White Paper
- Latest Press Release
- Industry Association
- Paid Database
- Investor Presentations

Step 4 - Data Triangulation
Involves using different sources of information in order to increase the validity of a study
These sources are likely to be stakeholders in a program - participants, other researchers, program staff, other community members, and so on.
Then we put all data in single framework & apply various statistical tools to find out the dynamic on the market.
During the analysis stage, feedback from the stakeholder groups would be compared to determine areas of agreement as well as areas of divergence
