

Key Insights
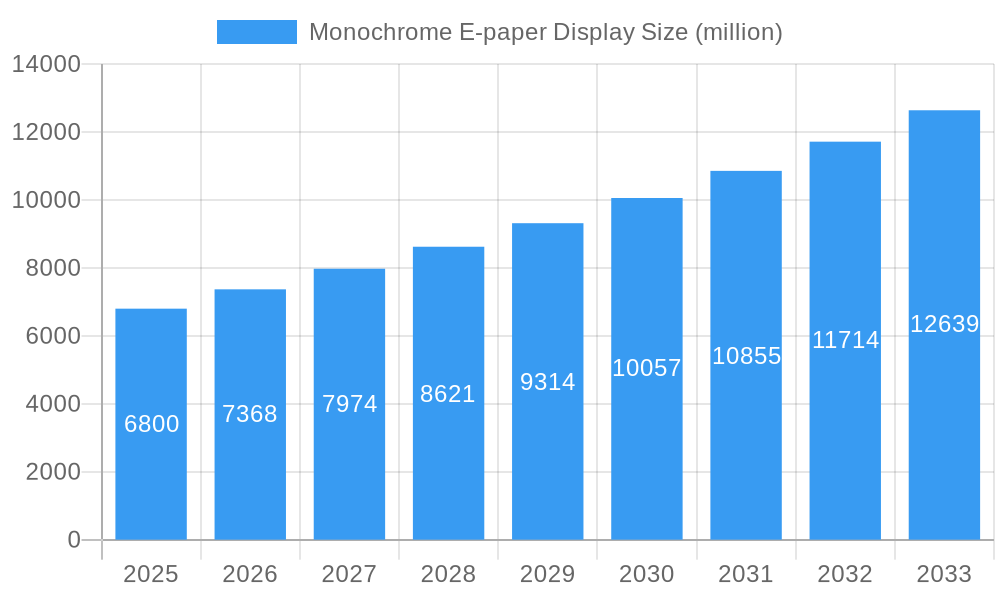
The Monochrome E-paper Display market is poised for significant expansion, projected to reach a market size of USD 6.8 billion in 2025. This growth is fueled by an impressive CAGR of 8.3% over the forecast period. The escalating demand for low-power, paper-like displays across various applications, from e-readers and electronic shelf labels to industrial signage and smart wearables, is a primary driver. The inherent advantages of E-paper technology, including exceptional readability in direct sunlight, minimal power consumption for static images, and a reduced environmental footprint compared to traditional LCDs and OLEDs, are increasingly recognized by consumers and businesses alike. Emerging trends like the development of faster refresh rates, enhanced color capabilities in monochrome variants, and the integration of E-paper into the Internet of Things (IoT) ecosystem are further propelling market adoption.
Monochrome E-paper Display Market Size (In Billion)
The market's trajectory is further bolstered by advancements in display sizes and types, catering to a broader spectrum of use cases. While the 3.1-6 inch segment, prevalent in e-readers, will remain robust, significant growth is anticipated in smaller displays (1-3 inch) for wearables and larger formats (over 10 inch) for digital signage and information boards. Key players like E Ink, Liquavistar, and Plastic Logic are at the forefront of innovation, introducing new materials and manufacturing processes to enhance performance and reduce costs. Despite the promising outlook, potential restraints include the relatively higher manufacturing costs compared to some competing technologies and limitations in refresh rates for dynamic content. However, ongoing research and development are actively addressing these challenges, ensuring a bright future for monochrome E-paper displays.
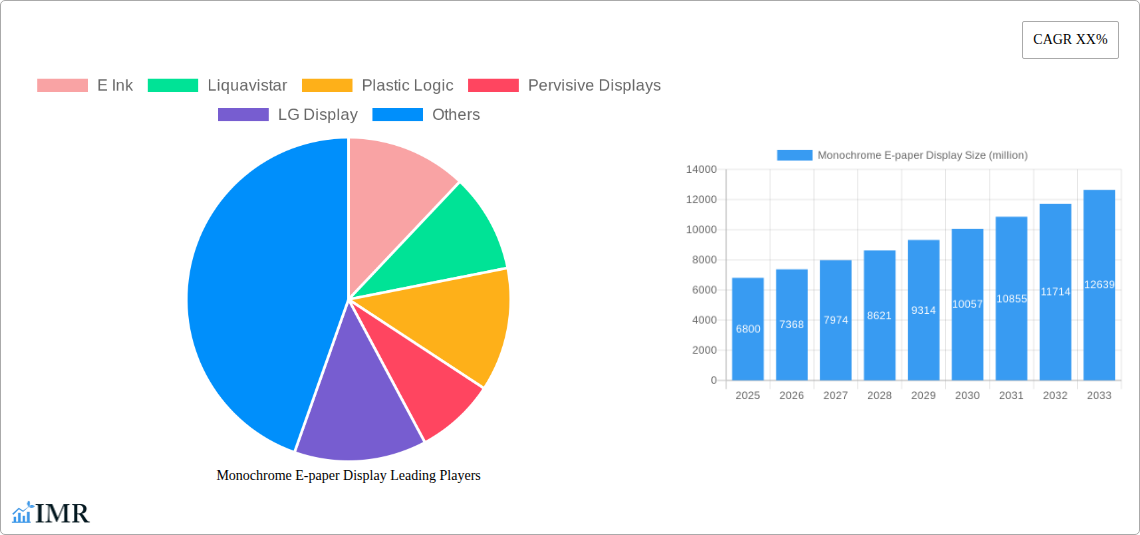
Monochrome E-paper Display Company Market Share
Comprehensive Monochrome E-paper Display Market Report: 2019-2033
This report offers an in-depth analysis of the global Monochrome E-paper Display market, forecasting its trajectory from 2019 to 2033. With a base year of 2025, the study leverages extensive historical data and future projections to provide actionable insights for industry stakeholders. The analysis encompasses market dynamics, growth trends, regional dominance, product innovations, key drivers, emerging opportunities, and the competitive landscape. Special attention is given to the parent and child market segments, allowing for a nuanced understanding of market penetration and strategic positioning. We provide quantitative data in billions of USD, ensuring a clear and impactful presentation of market size and growth.
Monochrome E-paper Display Market Dynamics & Structure
The Monochrome E-paper Display market exhibits a moderately consolidated structure, with key players like E Ink and LG Display holding significant market shares. Technological innovation is the primary driver, fueled by advancements in electrophoretic ink technology, offering enhanced refresh rates, lower power consumption, and improved outdoor readability. Regulatory frameworks, while generally supportive of energy-efficient display technologies, can vary across regions regarding product certifications and import/export policies. Competitive product substitutes include traditional LCD and OLED displays, though e-paper's unique advantages in specific applications, such as static content display and extreme power efficiency, differentiate it. End-user demographics are increasingly sophisticated, seeking sustainable and user-friendly electronic solutions. Mergers and acquisitions (M&A) trends are observed as companies aim to expand their technological capabilities and market reach. For instance, recent M&A activities in the parent market, projected at a value of $85.7 billion in 2025, indicate a consolidation of innovation and production capacity.
- Market Concentration: Moderately consolidated with a few dominant players.
- Technological Innovation Drivers: Electrophoretic ink advancements, power efficiency, outdoor readability, refresh rates.
- Regulatory Frameworks: Supportive for energy-efficient displays, with regional variations.
- Competitive Product Substitutes: LCD, OLED (for specific applications).
- End-User Demographics: Growing demand for sustainable and low-power electronic solutions.
- M&A Trends: Strategic acquisitions to enhance technology and market access.
Monochrome E-paper Display Growth Trends & Insights
The Monochrome E-paper Display market is poised for robust growth, driven by increasing demand across diverse applications and a widening adoption of its inherent advantages. The global market size for monochrome e-paper displays is projected to reach $14.3 billion by 2025 and is anticipated to expand at a Compound Annual Growth Rate (CAGR) of 18.9% during the forecast period of 2025-2033, reaching an estimated $35.6 billion by 2033. This growth is underpinned by significant technological disruptions, including the development of color e-paper technologies that, while currently nascent, hint at broader future market potential, and continuous improvements in monochrome display performance. Consumer behavior shifts towards more sustainable and less visually fatiguing electronic devices are also playing a crucial role. Adoption rates are accelerating, particularly in the electronic shelf label (ESL) segment, where the low power consumption and readability of e-paper are revolutionizing retail operations. The parent market for electronic displays, valued at $198.7 billion in 2025, is a significant indicator of the broader ecosystem in which monochrome e-paper operates. The child market for low-power displays is also experiencing substantial growth, with monochrome e-paper being a primary beneficiary. Market penetration in emerging economies is expected to surge as cost-effectiveness and energy efficiency become paramount concerns. The estimated market size of $14.3 billion in 2025 is expected to be driven by a consistent upward trend, with a projected market penetration of 45% in key application segments by 2033. The increasing integration of e-paper in Internet of Things (IoT) devices further solidifies its growth trajectory, with the IoT device market itself projected to reach over $1.1 trillion by 2025. This symbiotic relationship is expected to propel the monochrome e-paper display market to new heights.
Dominant Regions, Countries, or Segments in Monochrome E-paper Display
Asia Pacific is emerging as the dominant region in the Monochrome E-paper Display market, driven by a confluence of factors including robust manufacturing capabilities, a rapidly expanding electronics industry, and significant government support for technological innovation. China, in particular, plays a pivotal role as both a major manufacturer and a growing consumer of e-paper displays, contributing substantially to the regional market share. The child market segment of Electronic Shelf Labels (ESLs) is experiencing phenomenal growth across all regions, but its adoption is particularly pronounced in developed economies within Asia Pacific and Europe, owing to advanced retail infrastructure and a strong focus on operational efficiency.
Dominant Region: Asia Pacific (especially China and South Korea)
- Key Drivers: Strong manufacturing base, government incentives for electronics R&D, high demand from consumer electronics and industrial sectors.
- Market Share Contribution: Estimated to hold over 40% of the global market share by 2025.
- Growth Potential: High due to continuous innovation and expansion of manufacturing capacity.
Dominant Segment (Application): Electronic Shelf Label (ESL)
- Key Drivers: Retail modernization, cost savings through automated price updates, energy efficiency, enhanced customer experience.
- Market Share within E-paper: Projected to account for approximately 35% of the total monochrome e-paper display market by 2025.
- Growth Potential: Exponential, driven by increasing adoption in hypermarkets, supermarkets, and specialty stores worldwide.
Dominant Segment (Type): 3.1-6 Inch E-paper Display
- Key Drivers: Ideal size for e-readers, smart tags, and portable electronic devices.
- Market Share within E-paper Types: Estimated to command a market share of around 40% by 2025.
- Growth Potential: Steady, supported by the enduring popularity of e-readers and the burgeoning market for wearable and compact smart devices.
The dominance of Asia Pacific is further amplified by its role in the parent market for displays, with countries like South Korea and Taiwan being global leaders in display technology manufacturing. The growth potential in this region is further bolstered by its strong presence in the child market for IoT devices, where e-paper displays are finding increasing utility. Economic policies promoting export and local manufacturing, coupled with substantial investments in research and development, contribute to the region's leadership. The sheer volume of electronic devices produced and consumed within Asia Pacific ensures a sustained demand for monochrome e-paper displays across various applications and types.
Monochrome E-paper Display Product Landscape
The Monochrome E-paper Display product landscape is characterized by continuous innovation focused on enhancing performance and expanding applications. Key advancements include the development of faster refresh rates, enabling smoother scrolling and a more dynamic user experience, and increased pixel density for sharper text and graphics. Reduced power consumption remains a critical USP, allowing for battery-powered devices that can operate for weeks or months on a single charge. Current product offerings range from small, compact displays ideal for wearables and smart cards to larger formats suitable for signage and industrial applications. Technologies such as advanced electrophoretic ink formulations and improved driver circuitry are enabling higher contrast ratios and a wider grayscale range.
Key Drivers, Barriers & Challenges in Monochrome E-paper Display
Key Drivers: The Monochrome E-paper Display market is propelled by several key drivers. The escalating demand for energy-efficient and sustainable electronic solutions is a primary catalyst, aligning with global environmental concerns and corporate sustainability goals. The significant cost savings offered by e-paper displays, particularly in applications like electronic shelf labels, where they reduce the need for manual price updates and paper printing, is another major driver. Advancements in display technology, leading to improved refresh rates and image quality, are expanding the viable applications for e-paper. Furthermore, the growing adoption of the Internet of Things (IoT) ecosystem, where low-power, always-on displays are crucial, provides a substantial growth avenue.
Barriers & Challenges: Despite its advantages, the market faces several barriers and challenges. The relatively slower refresh rates compared to LCD and OLED displays limit their suitability for highly dynamic content or video playback, a key competitive pressure from other display technologies. The initial cost of e-paper displays can still be a barrier for some mass-market applications, although this is diminishing with scale. Supply chain disruptions, particularly for specialized components and raw materials, can impact production volumes and lead times. Regulatory hurdles related to electronic waste and product lifecycle management, while generally supportive of sustainability, can add complexity to market entry and product development. The competitive landscape, with established players continuously innovating in other display technologies, presents an ongoing challenge. For example, supply chain issues for rare earth materials in the broader display market could indirectly affect e-paper production.
Emerging Opportunities in Monochrome E-paper Display
Emerging opportunities in the Monochrome E-paper Display sector lie in the untapped potential within the industrial and professional sectors, beyond traditional consumer electronics. The integration of e-paper displays into smart building management systems for real-time information display, asset tracking, and environmental monitoring presents a significant growth avenue. The development of larger format e-paper displays for public transportation signage, advertising, and outdoor information boards offers substantial market expansion. Furthermore, the growing trend towards personalized electronics and the rise of smart, connected devices in healthcare, logistics, and education are creating new niches for e-paper's unique capabilities. The evolution of color e-paper technology, while still in its early stages, promises to unlock even broader application possibilities in the future.
Growth Accelerators in the Monochrome E-paper Display Industry
Several catalysts are accelerating long-term growth in the Monochrome E-paper Display industry. Continuous technological breakthroughs in microencapsulation techniques and advanced electrophoretic ink formulations are leading to displays with enhanced durability, wider operating temperature ranges, and improved color reproduction, even in monochrome. Strategic partnerships between e-paper manufacturers and major electronics brands are crucial for driving mass adoption and integration into a wider array of consumer and industrial products. Market expansion strategies focusing on developing regions with a growing need for cost-effective and energy-efficient electronic solutions will further boost growth. The increasing focus on circular economy principles and product longevity also favors e-paper's low-power, durable nature.
Key Players Shaping the Monochrome E-paper Display Market
- E Ink
- Liquavistar
- Plastic Logic
- Pervisive Displays
- LG Display
- Gamma Dynamics
- ITRI
- GooDisplay
- OED
- Wiwood
- IRIS
- FUJITSU
Notable Milestones in Monochrome E-paper Display Sector
- 2019: Introduction of significantly faster refresh rates by leading manufacturers, enhancing user experience in e-readers.
- 2020: Widespread adoption of e-paper for Electronic Shelf Labels (ESLs) in major retail chains, driven by cost savings and efficiency gains.
- 2021: Advancements in durable e-paper for industrial applications, including outdoor signage and smart industrial equipment.
- 2022: Increased investment in R&D for color e-paper technology by several key players, signaling future market evolution.
- 2023: Emergence of e-paper displays with enhanced connectivity features for seamless integration into IoT ecosystems.
- 2024: Significant improvements in manufacturing processes leading to reduced production costs for larger format e-paper displays.
In-Depth Monochrome E-paper Display Market Outlook
The future outlook for the Monochrome E-paper Display market is exceptionally bright, driven by a synergistic combination of technological innovation and expanding application horizons. The consistent improvements in performance metrics, coupled with a growing global emphasis on sustainability and energy efficiency, position e-paper as a pivotal display technology for the coming decade. Strategic partnerships and market expansion into nascent geographical regions and industry verticals will serve as potent growth accelerators. The parent market's strength and the burgeoning child market for low-power electronics create a fertile ground for e-paper’s continued ascent. Investors and industry stakeholders can anticipate sustained growth and emerging opportunities as e-paper moves beyond its traditional niches to become an indispensable component in a more connected and eco-conscious world.
Monochrome E-paper Display Segmentation
-
1. Application
- 1.1. E-Reader
- 1.2. Electronic Shelf Label
- 1.3. Other Applications
-
2. Types
- 2.1. 1-3 Inch E-paper Display
- 2.2. 3.1-6 Inch E-paper Display
- 2.3. 6.1-10 Inch E-paper Display
- 2.4. Over 10 Inch E-paper Display
Monochrome E-paper Display Segmentation By Geography
-
1. North America
- 1.1. United States
- 1.2. Canada
- 1.3. Mexico
-
2. South America
- 2.1. Brazil
- 2.2. Argentina
- 2.3. Rest of South America
-
3. Europe
- 3.1. United Kingdom
- 3.2. Germany
- 3.3. France
- 3.4. Italy
- 3.5. Spain
- 3.6. Russia
- 3.7. Benelux
- 3.8. Nordics
- 3.9. Rest of Europe
-
4. Middle East & Africa
- 4.1. Turkey
- 4.2. Israel
- 4.3. GCC
- 4.4. North Africa
- 4.5. South Africa
- 4.6. Rest of Middle East & Africa
-
5. Asia Pacific
- 5.1. China
- 5.2. India
- 5.3. Japan
- 5.4. South Korea
- 5.5. ASEAN
- 5.6. Oceania
- 5.7. Rest of Asia Pacific
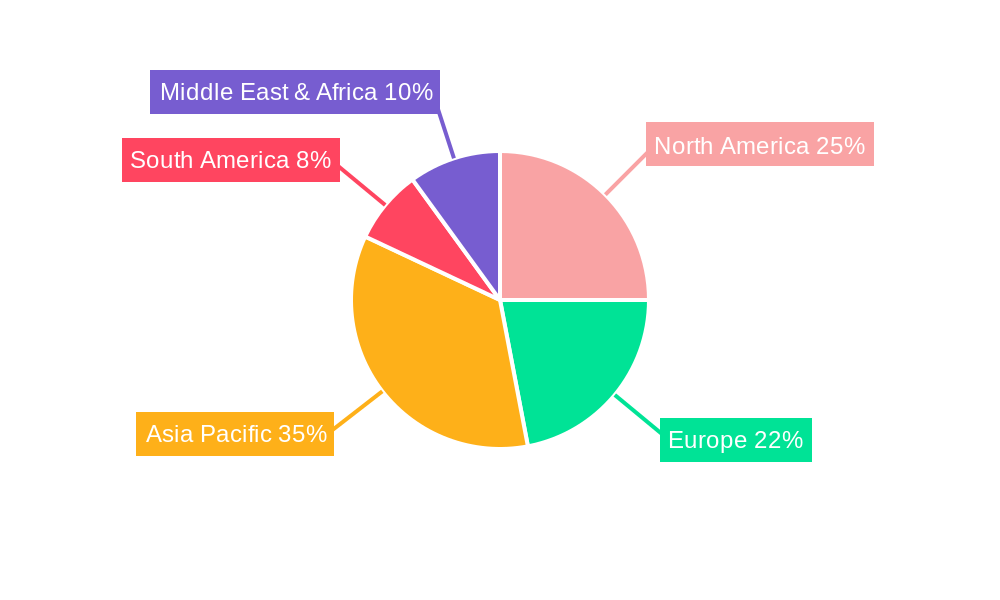
Monochrome E-paper Display Regional Market Share
Geographic Coverage of Monochrome E-paper Display
Monochrome E-paper Display REPORT HIGHLIGHTS
| Aspects | Details |
|---|---|
| Study Period | 2020-2034 |
| Base Year | 2025 |
| Estimated Year | 2026 |
| Forecast Period | 2026-2034 |
| Historical Period | 2020-2025 |
| Growth Rate | CAGR of 8.3% from 2020-2034 |
| Segmentation |
|
Table of Contents
- 1. Introduction
- 1.1. Research Scope
- 1.2. Market Segmentation
- 1.3. Research Methodology
- 1.4. Definitions and Assumptions
- 2. Executive Summary
- 2.1. Introduction
- 3. Market Dynamics
- 3.1. Introduction
- 3.2. Market Drivers
- 3.3. Market Restrains
- 3.4. Market Trends
- 4. Market Factor Analysis
- 4.1. Porters Five Forces
- 4.2. Supply/Value Chain
- 4.3. PESTEL analysis
- 4.4. Market Entropy
- 4.5. Patent/Trademark Analysis
- 5. Global Monochrome E-paper Display Analysis, Insights and Forecast, 2020-2032
- 5.1. Market Analysis, Insights and Forecast - by Application
- 5.1.1. E-Reader
- 5.1.2. Electronic Shelf Label
- 5.1.3. Other Applications
- 5.2. Market Analysis, Insights and Forecast - by Types
- 5.2.1. 1-3 Inch E-paper Display
- 5.2.2. 3.1-6 Inch E-paper Display
- 5.2.3. 6.1-10 Inch E-paper Display
- 5.2.4. Over 10 Inch E-paper Display
- 5.3. Market Analysis, Insights and Forecast - by Region
- 5.3.1. North America
- 5.3.2. South America
- 5.3.3. Europe
- 5.3.4. Middle East & Africa
- 5.3.5. Asia Pacific
- 5.1. Market Analysis, Insights and Forecast - by Application
- 6. North America Monochrome E-paper Display Analysis, Insights and Forecast, 2020-2032
- 6.1. Market Analysis, Insights and Forecast - by Application
- 6.1.1. E-Reader
- 6.1.2. Electronic Shelf Label
- 6.1.3. Other Applications
- 6.2. Market Analysis, Insights and Forecast - by Types
- 6.2.1. 1-3 Inch E-paper Display
- 6.2.2. 3.1-6 Inch E-paper Display
- 6.2.3. 6.1-10 Inch E-paper Display
- 6.2.4. Over 10 Inch E-paper Display
- 6.1. Market Analysis, Insights and Forecast - by Application
- 7. South America Monochrome E-paper Display Analysis, Insights and Forecast, 2020-2032
- 7.1. Market Analysis, Insights and Forecast - by Application
- 7.1.1. E-Reader
- 7.1.2. Electronic Shelf Label
- 7.1.3. Other Applications
- 7.2. Market Analysis, Insights and Forecast - by Types
- 7.2.1. 1-3 Inch E-paper Display
- 7.2.2. 3.1-6 Inch E-paper Display
- 7.2.3. 6.1-10 Inch E-paper Display
- 7.2.4. Over 10 Inch E-paper Display
- 7.1. Market Analysis, Insights and Forecast - by Application
- 8. Europe Monochrome E-paper Display Analysis, Insights and Forecast, 2020-2032
- 8.1. Market Analysis, Insights and Forecast - by Application
- 8.1.1. E-Reader
- 8.1.2. Electronic Shelf Label
- 8.1.3. Other Applications
- 8.2. Market Analysis, Insights and Forecast - by Types
- 8.2.1. 1-3 Inch E-paper Display
- 8.2.2. 3.1-6 Inch E-paper Display
- 8.2.3. 6.1-10 Inch E-paper Display
- 8.2.4. Over 10 Inch E-paper Display
- 8.1. Market Analysis, Insights and Forecast - by Application
- 9. Middle East & Africa Monochrome E-paper Display Analysis, Insights and Forecast, 2020-2032
- 9.1. Market Analysis, Insights and Forecast - by Application
- 9.1.1. E-Reader
- 9.1.2. Electronic Shelf Label
- 9.1.3. Other Applications
- 9.2. Market Analysis, Insights and Forecast - by Types
- 9.2.1. 1-3 Inch E-paper Display
- 9.2.2. 3.1-6 Inch E-paper Display
- 9.2.3. 6.1-10 Inch E-paper Display
- 9.2.4. Over 10 Inch E-paper Display
- 9.1. Market Analysis, Insights and Forecast - by Application
- 10. Asia Pacific Monochrome E-paper Display Analysis, Insights and Forecast, 2020-2032
- 10.1. Market Analysis, Insights and Forecast - by Application
- 10.1.1. E-Reader
- 10.1.2. Electronic Shelf Label
- 10.1.3. Other Applications
- 10.2. Market Analysis, Insights and Forecast - by Types
- 10.2.1. 1-3 Inch E-paper Display
- 10.2.2. 3.1-6 Inch E-paper Display
- 10.2.3. 6.1-10 Inch E-paper Display
- 10.2.4. Over 10 Inch E-paper Display
- 10.1. Market Analysis, Insights and Forecast - by Application
- 11. Competitive Analysis
- 11.1. Global Market Share Analysis 2025
- 11.2. Company Profiles
- 11.2.1 E Ink
- 11.2.1.1. Overview
- 11.2.1.2. Products
- 11.2.1.3. SWOT Analysis
- 11.2.1.4. Recent Developments
- 11.2.1.5. Financials (Based on Availability)
- 11.2.2 Liquavistar
- 11.2.2.1. Overview
- 11.2.2.2. Products
- 11.2.2.3. SWOT Analysis
- 11.2.2.4. Recent Developments
- 11.2.2.5. Financials (Based on Availability)
- 11.2.3 Plastic Logic
- 11.2.3.1. Overview
- 11.2.3.2. Products
- 11.2.3.3. SWOT Analysis
- 11.2.3.4. Recent Developments
- 11.2.3.5. Financials (Based on Availability)
- 11.2.4 Pervisive Displays
- 11.2.4.1. Overview
- 11.2.4.2. Products
- 11.2.4.3. SWOT Analysis
- 11.2.4.4. Recent Developments
- 11.2.4.5. Financials (Based on Availability)
- 11.2.5 LG Display
- 11.2.5.1. Overview
- 11.2.5.2. Products
- 11.2.5.3. SWOT Analysis
- 11.2.5.4. Recent Developments
- 11.2.5.5. Financials (Based on Availability)
- 11.2.6 Gamma Dynamics
- 11.2.6.1. Overview
- 11.2.6.2. Products
- 11.2.6.3. SWOT Analysis
- 11.2.6.4. Recent Developments
- 11.2.6.5. Financials (Based on Availability)
- 11.2.7 ITRI
- 11.2.7.1. Overview
- 11.2.7.2. Products
- 11.2.7.3. SWOT Analysis
- 11.2.7.4. Recent Developments
- 11.2.7.5. Financials (Based on Availability)
- 11.2.8 GooDisplay
- 11.2.8.1. Overview
- 11.2.8.2. Products
- 11.2.8.3. SWOT Analysis
- 11.2.8.4. Recent Developments
- 11.2.8.5. Financials (Based on Availability)
- 11.2.9 OED
- 11.2.9.1. Overview
- 11.2.9.2. Products
- 11.2.9.3. SWOT Analysis
- 11.2.9.4. Recent Developments
- 11.2.9.5. Financials (Based on Availability)
- 11.2.10 Wiwood
- 11.2.10.1. Overview
- 11.2.10.2. Products
- 11.2.10.3. SWOT Analysis
- 11.2.10.4. Recent Developments
- 11.2.10.5. Financials (Based on Availability)
- 11.2.11 IRIS
- 11.2.11.1. Overview
- 11.2.11.2. Products
- 11.2.11.3. SWOT Analysis
- 11.2.11.4. Recent Developments
- 11.2.11.5. Financials (Based on Availability)
- 11.2.12 FUJITSU
- 11.2.12.1. Overview
- 11.2.12.2. Products
- 11.2.12.3. SWOT Analysis
- 11.2.12.4. Recent Developments
- 11.2.12.5. Financials (Based on Availability)
- 11.2.1 E Ink
List of Figures
- Figure 1: Global Monochrome E-paper Display Revenue Breakdown (undefined, %) by Region 2025 & 2033
- Figure 2: Global Monochrome E-paper Display Volume Breakdown (K, %) by Region 2025 & 2033
- Figure 3: North America Monochrome E-paper Display Revenue (undefined), by Application 2025 & 2033
- Figure 4: North America Monochrome E-paper Display Volume (K), by Application 2025 & 2033
- Figure 5: North America Monochrome E-paper Display Revenue Share (%), by Application 2025 & 2033
- Figure 6: North America Monochrome E-paper Display Volume Share (%), by Application 2025 & 2033
- Figure 7: North America Monochrome E-paper Display Revenue (undefined), by Types 2025 & 2033
- Figure 8: North America Monochrome E-paper Display Volume (K), by Types 2025 & 2033
- Figure 9: North America Monochrome E-paper Display Revenue Share (%), by Types 2025 & 2033
- Figure 10: North America Monochrome E-paper Display Volume Share (%), by Types 2025 & 2033
- Figure 11: North America Monochrome E-paper Display Revenue (undefined), by Country 2025 & 2033
- Figure 12: North America Monochrome E-paper Display Volume (K), by Country 2025 & 2033
- Figure 13: North America Monochrome E-paper Display Revenue Share (%), by Country 2025 & 2033
- Figure 14: North America Monochrome E-paper Display Volume Share (%), by Country 2025 & 2033
- Figure 15: South America Monochrome E-paper Display Revenue (undefined), by Application 2025 & 2033
- Figure 16: South America Monochrome E-paper Display Volume (K), by Application 2025 & 2033
- Figure 17: South America Monochrome E-paper Display Revenue Share (%), by Application 2025 & 2033
- Figure 18: South America Monochrome E-paper Display Volume Share (%), by Application 2025 & 2033
- Figure 19: South America Monochrome E-paper Display Revenue (undefined), by Types 2025 & 2033
- Figure 20: South America Monochrome E-paper Display Volume (K), by Types 2025 & 2033
- Figure 21: South America Monochrome E-paper Display Revenue Share (%), by Types 2025 & 2033
- Figure 22: South America Monochrome E-paper Display Volume Share (%), by Types 2025 & 2033
- Figure 23: South America Monochrome E-paper Display Revenue (undefined), by Country 2025 & 2033
- Figure 24: South America Monochrome E-paper Display Volume (K), by Country 2025 & 2033
- Figure 25: South America Monochrome E-paper Display Revenue Share (%), by Country 2025 & 2033
- Figure 26: South America Monochrome E-paper Display Volume Share (%), by Country 2025 & 2033
- Figure 27: Europe Monochrome E-paper Display Revenue (undefined), by Application 2025 & 2033
- Figure 28: Europe Monochrome E-paper Display Volume (K), by Application 2025 & 2033
- Figure 29: Europe Monochrome E-paper Display Revenue Share (%), by Application 2025 & 2033
- Figure 30: Europe Monochrome E-paper Display Volume Share (%), by Application 2025 & 2033
- Figure 31: Europe Monochrome E-paper Display Revenue (undefined), by Types 2025 & 2033
- Figure 32: Europe Monochrome E-paper Display Volume (K), by Types 2025 & 2033
- Figure 33: Europe Monochrome E-paper Display Revenue Share (%), by Types 2025 & 2033
- Figure 34: Europe Monochrome E-paper Display Volume Share (%), by Types 2025 & 2033
- Figure 35: Europe Monochrome E-paper Display Revenue (undefined), by Country 2025 & 2033
- Figure 36: Europe Monochrome E-paper Display Volume (K), by Country 2025 & 2033
- Figure 37: Europe Monochrome E-paper Display Revenue Share (%), by Country 2025 & 2033
- Figure 38: Europe Monochrome E-paper Display Volume Share (%), by Country 2025 & 2033
- Figure 39: Middle East & Africa Monochrome E-paper Display Revenue (undefined), by Application 2025 & 2033
- Figure 40: Middle East & Africa Monochrome E-paper Display Volume (K), by Application 2025 & 2033
- Figure 41: Middle East & Africa Monochrome E-paper Display Revenue Share (%), by Application 2025 & 2033
- Figure 42: Middle East & Africa Monochrome E-paper Display Volume Share (%), by Application 2025 & 2033
- Figure 43: Middle East & Africa Monochrome E-paper Display Revenue (undefined), by Types 2025 & 2033
- Figure 44: Middle East & Africa Monochrome E-paper Display Volume (K), by Types 2025 & 2033
- Figure 45: Middle East & Africa Monochrome E-paper Display Revenue Share (%), by Types 2025 & 2033
- Figure 46: Middle East & Africa Monochrome E-paper Display Volume Share (%), by Types 2025 & 2033
- Figure 47: Middle East & Africa Monochrome E-paper Display Revenue (undefined), by Country 2025 & 2033
- Figure 48: Middle East & Africa Monochrome E-paper Display Volume (K), by Country 2025 & 2033
- Figure 49: Middle East & Africa Monochrome E-paper Display Revenue Share (%), by Country 2025 & 2033
- Figure 50: Middle East & Africa Monochrome E-paper Display Volume Share (%), by Country 2025 & 2033
- Figure 51: Asia Pacific Monochrome E-paper Display Revenue (undefined), by Application 2025 & 2033
- Figure 52: Asia Pacific Monochrome E-paper Display Volume (K), by Application 2025 & 2033
- Figure 53: Asia Pacific Monochrome E-paper Display Revenue Share (%), by Application 2025 & 2033
- Figure 54: Asia Pacific Monochrome E-paper Display Volume Share (%), by Application 2025 & 2033
- Figure 55: Asia Pacific Monochrome E-paper Display Revenue (undefined), by Types 2025 & 2033
- Figure 56: Asia Pacific Monochrome E-paper Display Volume (K), by Types 2025 & 2033
- Figure 57: Asia Pacific Monochrome E-paper Display Revenue Share (%), by Types 2025 & 2033
- Figure 58: Asia Pacific Monochrome E-paper Display Volume Share (%), by Types 2025 & 2033
- Figure 59: Asia Pacific Monochrome E-paper Display Revenue (undefined), by Country 2025 & 2033
- Figure 60: Asia Pacific Monochrome E-paper Display Volume (K), by Country 2025 & 2033
- Figure 61: Asia Pacific Monochrome E-paper Display Revenue Share (%), by Country 2025 & 2033
- Figure 62: Asia Pacific Monochrome E-paper Display Volume Share (%), by Country 2025 & 2033
List of Tables
- Table 1: Global Monochrome E-paper Display Revenue undefined Forecast, by Application 2020 & 2033
- Table 2: Global Monochrome E-paper Display Volume K Forecast, by Application 2020 & 2033
- Table 3: Global Monochrome E-paper Display Revenue undefined Forecast, by Types 2020 & 2033
- Table 4: Global Monochrome E-paper Display Volume K Forecast, by Types 2020 & 2033
- Table 5: Global Monochrome E-paper Display Revenue undefined Forecast, by Region 2020 & 2033
- Table 6: Global Monochrome E-paper Display Volume K Forecast, by Region 2020 & 2033
- Table 7: Global Monochrome E-paper Display Revenue undefined Forecast, by Application 2020 & 2033
- Table 8: Global Monochrome E-paper Display Volume K Forecast, by Application 2020 & 2033
- Table 9: Global Monochrome E-paper Display Revenue undefined Forecast, by Types 2020 & 2033
- Table 10: Global Monochrome E-paper Display Volume K Forecast, by Types 2020 & 2033
- Table 11: Global Monochrome E-paper Display Revenue undefined Forecast, by Country 2020 & 2033
- Table 12: Global Monochrome E-paper Display Volume K Forecast, by Country 2020 & 2033
- Table 13: United States Monochrome E-paper Display Revenue (undefined) Forecast, by Application 2020 & 2033
- Table 14: United States Monochrome E-paper Display Volume (K) Forecast, by Application 2020 & 2033
- Table 15: Canada Monochrome E-paper Display Revenue (undefined) Forecast, by Application 2020 & 2033
- Table 16: Canada Monochrome E-paper Display Volume (K) Forecast, by Application 2020 & 2033
- Table 17: Mexico Monochrome E-paper Display Revenue (undefined) Forecast, by Application 2020 & 2033
- Table 18: Mexico Monochrome E-paper Display Volume (K) Forecast, by Application 2020 & 2033
- Table 19: Global Monochrome E-paper Display Revenue undefined Forecast, by Application 2020 & 2033
- Table 20: Global Monochrome E-paper Display Volume K Forecast, by Application 2020 & 2033
- Table 21: Global Monochrome E-paper Display Revenue undefined Forecast, by Types 2020 & 2033
- Table 22: Global Monochrome E-paper Display Volume K Forecast, by Types 2020 & 2033
- Table 23: Global Monochrome E-paper Display Revenue undefined Forecast, by Country 2020 & 2033
- Table 24: Global Monochrome E-paper Display Volume K Forecast, by Country 2020 & 2033
- Table 25: Brazil Monochrome E-paper Display Revenue (undefined) Forecast, by Application 2020 & 2033
- Table 26: Brazil Monochrome E-paper Display Volume (K) Forecast, by Application 2020 & 2033
- Table 27: Argentina Monochrome E-paper Display Revenue (undefined) Forecast, by Application 2020 & 2033
- Table 28: Argentina Monochrome E-paper Display Volume (K) Forecast, by Application 2020 & 2033
- Table 29: Rest of South America Monochrome E-paper Display Revenue (undefined) Forecast, by Application 2020 & 2033
- Table 30: Rest of South America Monochrome E-paper Display Volume (K) Forecast, by Application 2020 & 2033
- Table 31: Global Monochrome E-paper Display Revenue undefined Forecast, by Application 2020 & 2033
- Table 32: Global Monochrome E-paper Display Volume K Forecast, by Application 2020 & 2033
- Table 33: Global Monochrome E-paper Display Revenue undefined Forecast, by Types 2020 & 2033
- Table 34: Global Monochrome E-paper Display Volume K Forecast, by Types 2020 & 2033
- Table 35: Global Monochrome E-paper Display Revenue undefined Forecast, by Country 2020 & 2033
- Table 36: Global Monochrome E-paper Display Volume K Forecast, by Country 2020 & 2033
- Table 37: United Kingdom Monochrome E-paper Display Revenue (undefined) Forecast, by Application 2020 & 2033
- Table 38: United Kingdom Monochrome E-paper Display Volume (K) Forecast, by Application 2020 & 2033
- Table 39: Germany Monochrome E-paper Display Revenue (undefined) Forecast, by Application 2020 & 2033
- Table 40: Germany Monochrome E-paper Display Volume (K) Forecast, by Application 2020 & 2033
- Table 41: France Monochrome E-paper Display Revenue (undefined) Forecast, by Application 2020 & 2033
- Table 42: France Monochrome E-paper Display Volume (K) Forecast, by Application 2020 & 2033
- Table 43: Italy Monochrome E-paper Display Revenue (undefined) Forecast, by Application 2020 & 2033
- Table 44: Italy Monochrome E-paper Display Volume (K) Forecast, by Application 2020 & 2033
- Table 45: Spain Monochrome E-paper Display Revenue (undefined) Forecast, by Application 2020 & 2033
- Table 46: Spain Monochrome E-paper Display Volume (K) Forecast, by Application 2020 & 2033
- Table 47: Russia Monochrome E-paper Display Revenue (undefined) Forecast, by Application 2020 & 2033
- Table 48: Russia Monochrome E-paper Display Volume (K) Forecast, by Application 2020 & 2033
- Table 49: Benelux Monochrome E-paper Display Revenue (undefined) Forecast, by Application 2020 & 2033
- Table 50: Benelux Monochrome E-paper Display Volume (K) Forecast, by Application 2020 & 2033
- Table 51: Nordics Monochrome E-paper Display Revenue (undefined) Forecast, by Application 2020 & 2033
- Table 52: Nordics Monochrome E-paper Display Volume (K) Forecast, by Application 2020 & 2033
- Table 53: Rest of Europe Monochrome E-paper Display Revenue (undefined) Forecast, by Application 2020 & 2033
- Table 54: Rest of Europe Monochrome E-paper Display Volume (K) Forecast, by Application 2020 & 2033
- Table 55: Global Monochrome E-paper Display Revenue undefined Forecast, by Application 2020 & 2033
- Table 56: Global Monochrome E-paper Display Volume K Forecast, by Application 2020 & 2033
- Table 57: Global Monochrome E-paper Display Revenue undefined Forecast, by Types 2020 & 2033
- Table 58: Global Monochrome E-paper Display Volume K Forecast, by Types 2020 & 2033
- Table 59: Global Monochrome E-paper Display Revenue undefined Forecast, by Country 2020 & 2033
- Table 60: Global Monochrome E-paper Display Volume K Forecast, by Country 2020 & 2033
- Table 61: Turkey Monochrome E-paper Display Revenue (undefined) Forecast, by Application 2020 & 2033
- Table 62: Turkey Monochrome E-paper Display Volume (K) Forecast, by Application 2020 & 2033
- Table 63: Israel Monochrome E-paper Display Revenue (undefined) Forecast, by Application 2020 & 2033
- Table 64: Israel Monochrome E-paper Display Volume (K) Forecast, by Application 2020 & 2033
- Table 65: GCC Monochrome E-paper Display Revenue (undefined) Forecast, by Application 2020 & 2033
- Table 66: GCC Monochrome E-paper Display Volume (K) Forecast, by Application 2020 & 2033
- Table 67: North Africa Monochrome E-paper Display Revenue (undefined) Forecast, by Application 2020 & 2033
- Table 68: North Africa Monochrome E-paper Display Volume (K) Forecast, by Application 2020 & 2033
- Table 69: South Africa Monochrome E-paper Display Revenue (undefined) Forecast, by Application 2020 & 2033
- Table 70: South Africa Monochrome E-paper Display Volume (K) Forecast, by Application 2020 & 2033
- Table 71: Rest of Middle East & Africa Monochrome E-paper Display Revenue (undefined) Forecast, by Application 2020 & 2033
- Table 72: Rest of Middle East & Africa Monochrome E-paper Display Volume (K) Forecast, by Application 2020 & 2033
- Table 73: Global Monochrome E-paper Display Revenue undefined Forecast, by Application 2020 & 2033
- Table 74: Global Monochrome E-paper Display Volume K Forecast, by Application 2020 & 2033
- Table 75: Global Monochrome E-paper Display Revenue undefined Forecast, by Types 2020 & 2033
- Table 76: Global Monochrome E-paper Display Volume K Forecast, by Types 2020 & 2033
- Table 77: Global Monochrome E-paper Display Revenue undefined Forecast, by Country 2020 & 2033
- Table 78: Global Monochrome E-paper Display Volume K Forecast, by Country 2020 & 2033
- Table 79: China Monochrome E-paper Display Revenue (undefined) Forecast, by Application 2020 & 2033
- Table 80: China Monochrome E-paper Display Volume (K) Forecast, by Application 2020 & 2033
- Table 81: India Monochrome E-paper Display Revenue (undefined) Forecast, by Application 2020 & 2033
- Table 82: India Monochrome E-paper Display Volume (K) Forecast, by Application 2020 & 2033
- Table 83: Japan Monochrome E-paper Display Revenue (undefined) Forecast, by Application 2020 & 2033
- Table 84: Japan Monochrome E-paper Display Volume (K) Forecast, by Application 2020 & 2033
- Table 85: South Korea Monochrome E-paper Display Revenue (undefined) Forecast, by Application 2020 & 2033
- Table 86: South Korea Monochrome E-paper Display Volume (K) Forecast, by Application 2020 & 2033
- Table 87: ASEAN Monochrome E-paper Display Revenue (undefined) Forecast, by Application 2020 & 2033
- Table 88: ASEAN Monochrome E-paper Display Volume (K) Forecast, by Application 2020 & 2033
- Table 89: Oceania Monochrome E-paper Display Revenue (undefined) Forecast, by Application 2020 & 2033
- Table 90: Oceania Monochrome E-paper Display Volume (K) Forecast, by Application 2020 & 2033
- Table 91: Rest of Asia Pacific Monochrome E-paper Display Revenue (undefined) Forecast, by Application 2020 & 2033
- Table 92: Rest of Asia Pacific Monochrome E-paper Display Volume (K) Forecast, by Application 2020 & 2033
Frequently Asked Questions
1. What is the projected Compound Annual Growth Rate (CAGR) of the Monochrome E-paper Display?
The projected CAGR is approximately 8.3%.
2. Which companies are prominent players in the Monochrome E-paper Display?
Key companies in the market include E Ink, Liquavistar, Plastic Logic, Pervisive Displays, LG Display, Gamma Dynamics, ITRI, GooDisplay, OED, Wiwood, IRIS, FUJITSU.
3. What are the main segments of the Monochrome E-paper Display?
The market segments include Application, Types.
4. Can you provide details about the market size?
The market size is estimated to be USD XXX N/A as of 2022.
5. What are some drivers contributing to market growth?
N/A
6. What are the notable trends driving market growth?
N/A
7. Are there any restraints impacting market growth?
N/A
8. Can you provide examples of recent developments in the market?
N/A
9. What pricing options are available for accessing the report?
Pricing options include single-user, multi-user, and enterprise licenses priced at USD 3350.00, USD 5025.00, and USD 6700.00 respectively.
10. Is the market size provided in terms of value or volume?
The market size is provided in terms of value, measured in N/A and volume, measured in K.
11. Are there any specific market keywords associated with the report?
Yes, the market keyword associated with the report is "Monochrome E-paper Display," which aids in identifying and referencing the specific market segment covered.
12. How do I determine which pricing option suits my needs best?
The pricing options vary based on user requirements and access needs. Individual users may opt for single-user licenses, while businesses requiring broader access may choose multi-user or enterprise licenses for cost-effective access to the report.
13. Are there any additional resources or data provided in the Monochrome E-paper Display report?
While the report offers comprehensive insights, it's advisable to review the specific contents or supplementary materials provided to ascertain if additional resources or data are available.
14. How can I stay updated on further developments or reports in the Monochrome E-paper Display?
To stay informed about further developments, trends, and reports in the Monochrome E-paper Display, consider subscribing to industry newsletters, following relevant companies and organizations, or regularly checking reputable industry news sources and publications.
Methodology
Step 1 - Identification of Relevant Samples Size from Population Database


Step 2 - Approaches for Defining Global Market Size (Value, Volume* & Price*)

Note*: In applicable scenarios
Step 3 - Data Sources
Primary Research
- Web Analytics
- Survey Reports
- Research Institute
- Latest Research Reports
- Opinion Leaders
Secondary Research
- Annual Reports
- White Paper
- Latest Press Release
- Industry Association
- Paid Database
- Investor Presentations

Step 4 - Data Triangulation
Involves using different sources of information in order to increase the validity of a study
These sources are likely to be stakeholders in a program - participants, other researchers, program staff, other community members, and so on.
Then we put all data in single framework & apply various statistical tools to find out the dynamic on the market.
During the analysis stage, feedback from the stakeholder groups would be compared to determine areas of agreement as well as areas of divergence