

Key Insights
The multi-fiber optic connector market is poised for significant expansion, projected to reach an estimated $250 million in 2025 and grow at an impressive compound annual growth rate (CAGR) of 12.8% through 2033. This robust growth is fueled by several key drivers, including the escalating demand for high-speed data transmission across telecommunications networks, the burgeoning adoption of 5G infrastructure, and the continuous expansion of data centers worldwide. The increasing need for increased bandwidth and reduced latency in applications ranging from cloud computing and artificial intelligence to the Internet of Things (IoT) is directly translating into a higher requirement for efficient multi-fiber connectivity solutions. Furthermore, advancements in connector technology, offering improved performance, reliability, and ease of installation, are actively contributing to market penetration and adoption. The market is witnessing a strong trend towards miniaturization and higher fiber density, enabling more data to be transmitted through smaller physical footprints, which is crucial for space-constrained environments.
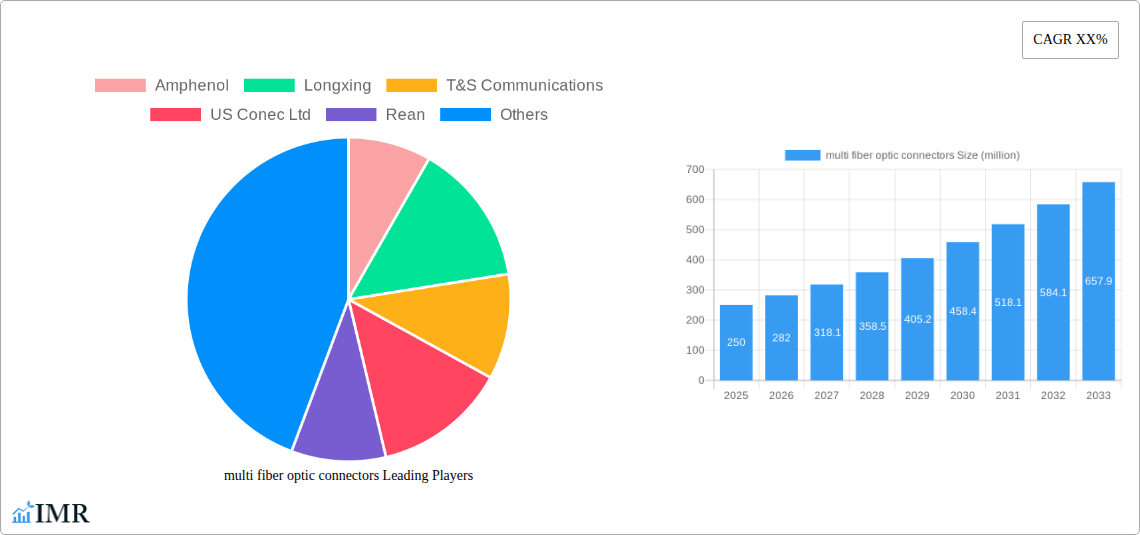
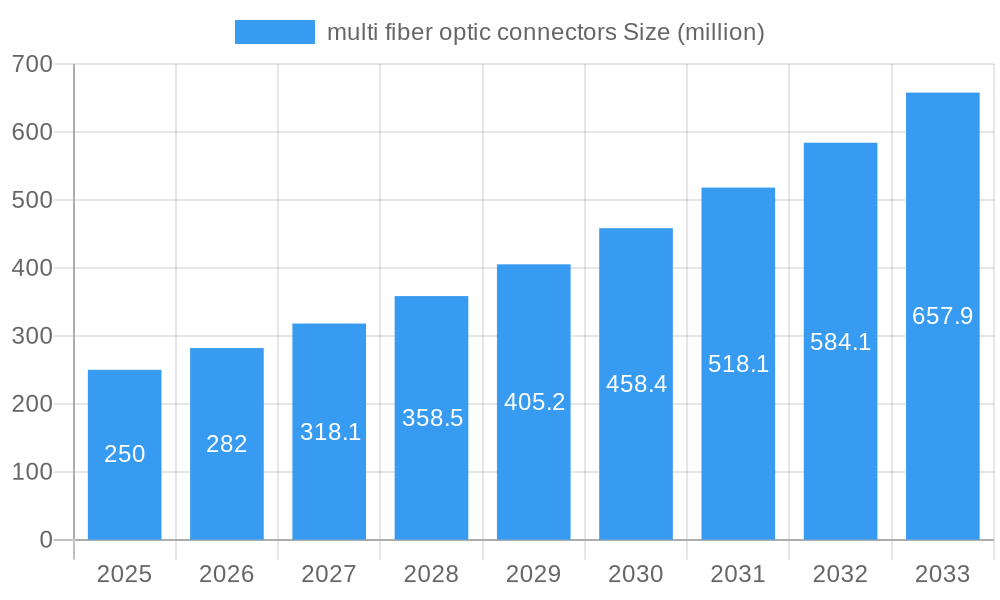
multi fiber optic connectors Market Size (In Million)
While the market demonstrates a healthy upward trajectory, certain restraints could influence its pace. The high initial cost of advanced multi-fiber connector systems and the need for specialized installation expertise can present a barrier for some smaller enterprises. Additionally, the ongoing development of alternative high-speed interconnect technologies could pose a competitive challenge. Nevertheless, the overwhelming demand for enhanced network capacity and the continuous innovation within the multi-fiber optic connector industry, including advancements in ferrule materials and alignment technologies, are expected to outweigh these challenges. Key application segments, such as telecommunications, data centers, and enterprise networking, are driving this demand, while innovations in connector types, including MPO/MTP and other multi-fiber configurations, are catering to these evolving needs. Leading companies like Amphenol, Longxing, and US Conec Ltd are at the forefront, driving innovation and market expansion across key regions like Asia Pacific and North America.
multi fiber optic connectors Company Market Share
This in-depth market research report provides a detailed analysis of the global multi-fiber optic connectors market, encompassing market dynamics, growth trends, competitive landscape, and future outlook. With a study period from 2019 to 2033, a base year of 2025, and a forecast period extending to 2033, this report offers invaluable insights for industry stakeholders. The report covers a global market size evolution, adoption rates, technological disruptions, and consumer behavior shifts, providing specific metrics like CAGR and market penetration for deeper understanding. We explore the parent and child markets for multi-fiber optic connectors, offering a holistic view of the industry's intricate ecosystem.
Multi Fiber Optic Connectors Market Dynamics & Structure
The global multi-fiber optic connectors market exhibits a moderate to high concentration, with key players continuously vying for market share through product innovation and strategic collaborations. Technological innovation, driven by the ever-increasing demand for higher bandwidth and faster data transmission in sectors like telecommunications, data centers, and 5G infrastructure, serves as a primary growth engine. Regulatory frameworks, particularly those promoting fiber-to-the-home (FTTH) initiatives and data security standards, further shape market development. Competitive product substitutes, though limited in the high-performance multi-fiber segment, still exert pressure, necessitating continuous advancements in connector technology. End-user demographics are shifting towards a greater demand for compact, high-density, and robust connector solutions, particularly from enterprise and hyperscale data centers. Mergers and acquisitions (M&A) trends are significant, with larger companies acquiring innovative smaller firms to expand their product portfolios and technological capabilities.
- Market Concentration: Dominated by a few key global players, but with increasing fragmentation in niche segments.
- Technological Innovation Drivers: Demand for higher speeds (400G, 800G, 1.2T Ethernet), miniaturization, and improved signal integrity.
- Regulatory Frameworks: Government initiatives for broadband expansion, data center efficiency standards, and sustainability mandates.
- Competitive Product Substitutes: Advanced single-fiber connectors for specific low-density applications; emerging optical switching technologies.
- End-User Demographics: Growth in data center deployments, enterprise network upgrades, and telecommunications infrastructure expansion.
- M&A Trends: Strategic acquisitions to gain access to advanced technologies and expand market reach; estimated 3-5 significant M&A deals annually in the last two years.
Multi Fiber Optic Connectors Growth Trends & Insights
The global multi-fiber optic connectors market is poised for significant expansion, fueled by an insatiable global appetite for data and the relentless evolution of digital infrastructure. The market size, estimated at $5,200 million in the base year 2025, is projected to reach $9,800 million by the end of the forecast period in 2033, exhibiting a Compound Annual Growth Rate (CAGR) of approximately 6.5%. This robust growth is underpinned by a steady increase in adoption rates across various critical sectors. The expansion of hyperscale data centers, driven by cloud computing, artificial intelligence, and big data analytics, is a primary demand driver, necessitating high-density, high-performance interconnect solutions. Furthermore, the ongoing global rollout of 5G networks and the subsequent surge in mobile data traffic are creating substantial opportunities for multi-fiber connectors in base stations and aggregation points. The increasing deployment of fiber-to-the-home (FTTH) initiatives worldwide, aimed at providing high-speed internet access to a wider population, also contributes significantly to market growth.
Technological disruptions continue to shape the market, with advancements in connector designs focusing on improved insertion loss, return loss, and overall reliability. The development of advanced materials and manufacturing processes is enabling the production of more compact and robust connectors, capable of withstanding harsher environmental conditions. Consumer behavior shifts, though less direct in the B2B connector market, manifest in the demand for more seamless and faster digital experiences, which directly translates to increased investment in the underlying fiber optic infrastructure. The penetration of multi-fiber connectors in enterprise networks is also on the rise as businesses upgrade their IT infrastructure to support higher data throughput and support the growing adoption of sophisticated applications like video conferencing and IoT. The growing trend towards network virtualization and software-defined networking further emphasizes the need for flexible and scalable fiber optic connectivity solutions. The increasing complexity of network architectures, particularly within data centers, necessitates the use of multi-fiber connectors to manage cable density and simplify installation and maintenance. The market also observes a growing demand for environmentally friendly and sustainable connector solutions, prompting manufacturers to explore eco-friendly materials and production methods. The shift from traditional copper cabling to fiber optics in many applications, especially for long-haul and high-bandwidth data transmission, is a fundamental growth accelerator that will continue to benefit the multi-fiber optic connectors market.
Dominant Regions, Countries, or Segments in Multi Fiber Optic Connectors
The dominance in the multi-fiber optic connectors market is multifaceted, with specific regions, countries, and application segments showcasing exceptional growth and consumption. North America, particularly the United States, stands out as a leading region, driven by its mature data center industry, significant investments in 5G deployment, and government initiatives promoting broadband expansion. The US market alone accounted for an estimated 30% of the global multi-fiber optic connectors market share in 2025, with a projected growth rate of 7.0% during the forecast period. This dominance is fueled by the presence of major hyperscale data center operators and technology companies constantly upgrading their infrastructure.
Application: The Data Center segment is undeniably the largest and most dominant application driving market growth. This segment is estimated to represent 45% of the total market revenue in 2025, with a projected CAGR of 7.2%. The insatiable demand for cloud services, AI, and big data analytics necessitates massive expansion of data center capacity, requiring high-density, high-performance multi-fiber connectivity. The Telecommunications segment, encompassing 5G infrastructure, FTTH, and core network deployments, is the second-largest application, holding an estimated 30% market share in 2025 and expected to grow at a CAGR of 6.5%.
Types: Within the types of multi-fiber optic connectors, MPO/MTP connectors are the most dominant, accounting for an estimated 60% of the market in 2025. Their high fiber count (12, 24, 48, 72 fibers) and compact design make them ideal for high-density applications in data centers and telecom equipment rooms. The market also sees growth in emerging types like QSFP and OSFP connectors used in high-speed networking equipment.
- Key Drivers (North America):
- Extensive hyperscale data center footprint.
- Aggressive 5G network deployment by major carriers.
- Government funding for broadband infrastructure upgrades.
- Strong presence of leading technology and telecom companies.
- Dominance Factors (Data Centers):
- Increasing demand for higher bandwidth (400G, 800G).
- Need for space-saving, high-density cabling solutions.
- Support for virtualization and software-defined networking.
- Growth in AI and machine learning workloads.
- Dominance Factors (MPO/MTP Connectors):
- Cost-effectiveness for high fiber counts compared to single-fiber solutions.
- Ease of deployment and management in dense environments.
- Compatibility with high-speed transceivers.
- Growth Potential: Significant untapped potential in emerging economies within Asia-Pacific and Latin America for FTTH and 5G rollouts.
Multi Fiber Optic Connectors Product Landscape
The multi-fiber optic connectors product landscape is characterized by continuous innovation aimed at enhancing performance, miniaturization, and ease of use. Manufacturers are focused on developing connectors with exceptionally low insertion loss and high return loss to ensure optimal signal integrity for high-speed data transmission. Key product innovations include improved ferrule designs, advanced polishing techniques, and robust housing materials that offer enhanced durability and environmental resistance. The integration of advanced lensing technologies and precision manufacturing processes ensures consistent performance across a high number of fibers within a single connector. These advancements are critical for supporting the growing bandwidth demands of 400G, 800G, and beyond in data centers and telecommunications networks. Unique selling propositions often lie in proprietary alignment mechanisms for superior performance, enhanced strain relief for increased cable longevity, and plug-and-play designs for simplified installation.
Key Drivers, Barriers & Challenges in Multi Fiber Optic Connectors
Key Drivers: The multi-fiber optic connectors market is propelled by several key forces. The exponential growth in data consumption, driven by cloud computing, AI, and the proliferation of connected devices, necessitates higher bandwidth and faster speeds, directly boosting demand for multi-fiber solutions. The ongoing global rollout of 5G networks and the expansion of fiber-to-the-home (FTTH) initiatives represent significant market catalysts. Furthermore, the increasing density requirements within data centers, driven by the need to maximize space utilization and reduce operational costs, strongly favor compact multi-fiber connectors. Technological advancements in transceiver technology and high-speed networking equipment also act as significant drivers, requiring compatible high-density fiber optic interconnects.
- Technological: Increasing demand for higher data rates (400GbE, 800GbE), need for miniaturization and density.
- Economic: Government investments in broadband infrastructure, hyperscale data center expansion, enterprise network upgrades.
- Policy-driven: Initiatives promoting digital transformation and connectivity.
Barriers & Challenges: Despite strong growth, the market faces several challenges. The high initial cost of advanced multi-fiber connectors and the associated installation equipment can be a barrier for smaller enterprises or in budget-constrained regions. The need for specialized skills and training for installation and termination of multi-fiber connectors can also pose a challenge. Supply chain disruptions, particularly for specialized components and raw materials, can impact production and lead times, leading to price volatility. The complexity of fault identification and troubleshooting in high-density fiber optic networks using multi-fiber connectors can also be a concern for end-users. Additionally, evolving industry standards and the interoperability between different connector types require continuous adaptation from manufacturers.
- Supply Chain: Vulnerability to disruptions in raw material sourcing and component manufacturing.
- Regulatory: Evolving standards and certification requirements can lead to increased compliance costs.
- Competitive Pressures: Intense competition among manufacturers, leading to price erosion in some segments.
- Technical Expertise: Requirement for skilled labor for installation and maintenance.
Emerging Opportunities in Multi Fiber Optic Connectors
Emerging opportunities in the multi-fiber optic connectors market are abundant, driven by technological advancements and evolving industry needs. The expansion of edge computing and the Internet of Things (IoT) creates new demand for high-density, robust connectors in distributed network architectures. The increasing adoption of structured cabling solutions in smart buildings and industrial automation also presents a significant growth avenue. Furthermore, the development of higher fiber count connectors (e.g., 96 or 144 fiber connectors) and advanced connector designs for specialized applications like high-performance computing and AI accelerators are emerging as key opportunities. The growing demand for sustainable and eco-friendly fiber optic solutions also opens doors for manufacturers focusing on green manufacturing processes and recyclable materials. The increasing use of fiber optics in automotive and aerospace industries for in-vehicle networking and avionics systems is another untapped market with significant potential.
Growth Accelerators in the Multi Fiber Optic Connectors Industry
Several key growth accelerators are poised to propel the multi-fiber optic connectors industry forward. The continued expansion of hyperscale data centers, driven by cloud computing and AI workloads, will remain a primary engine of growth. The relentless pace of 5G network deployments globally, coupled with the increasing demand for faster mobile broadband, will necessitate extensive fiber optic infrastructure upgrades, directly benefiting multi-fiber connector manufacturers. Strategic partnerships and collaborations between connector manufacturers, equipment vendors, and network operators are crucial for driving innovation and ensuring market adoption. The development and standardization of next-generation high-speed Ethernet standards (e.g., 800G, 1.6T) will spur the demand for advanced multi-fiber connector solutions capable of supporting these unprecedented data rates. Furthermore, increasing government investments in digital infrastructure and broadband access in developing economies present substantial market expansion opportunities. The growing trend of network densification within enterprises to support a higher number of connected devices and bandwidth-intensive applications will also contribute significantly to growth.
Key Players Shaping the Multi Fiber Optic Connectors Market
- Amphenol
- Longxing
- T&S Communications
- US Conec Ltd
- Rean
- Corning
- CommScope
- 3M
- Prysmian Group
- Sumitomo Electric Industries
Notable Milestones in Multi Fiber Optic Connectors Sector
- 2019: Introduction of 24-fiber MTP connectors by US Conec Ltd, offering increased density for data center applications.
- 2020: Amphenol launches a new series of compact, high-performance multi-fiber connectors designed for 5G infrastructure.
- 2021: T&S Communications expands its product line with advanced MPO connectors featuring improved environmental resistance.
- 2022: Longxing invests heavily in R&D for next-generation multi-fiber optic connector technologies supporting speeds beyond 800Gbps.
- 2023 (Early): Significant increase in M&A activity as larger players acquire smaller innovative companies in the multi-fiber connector space.
- 2023 (Mid): Industry-wide focus on sustainable manufacturing practices for fiber optic components, including connectors.
In-Depth Multi Fiber Optic Connectors Market Outlook
The future outlook for the multi-fiber optic connectors market is exceptionally bright, driven by sustained demand from critical growth sectors and ongoing technological advancements. The projected market size of $9,800 million by 2033 underscores a robust growth trajectory. Key accelerators like the insatiable demand for data, the widespread adoption of 5G, and the continuous expansion of hyperscale data centers will continue to fuel this expansion. Strategic opportunities lie in catering to the evolving needs of edge computing, industrial IoT, and the increasing use of fiber optics in emerging applications. Manufacturers that can offer high-density, high-performance, and cost-effective solutions, while also focusing on sustainability and ease of integration, will be best positioned to capitalize on the immense potential of this dynamic market. The ongoing investment in upgrading existing network infrastructure and building new high-capacity networks globally will ensure a steady demand for advanced multi-fiber optic connectors.
multi fiber optic connectors Segmentation
- 1. Application
- 2. Types
multi fiber optic connectors Segmentation By Geography
-
1. North America
- 1.1. United States
- 1.2. Canada
- 1.3. Mexico
-
2. South America
- 2.1. Brazil
- 2.2. Argentina
- 2.3. Rest of South America
-
3. Europe
- 3.1. United Kingdom
- 3.2. Germany
- 3.3. France
- 3.4. Italy
- 3.5. Spain
- 3.6. Russia
- 3.7. Benelux
- 3.8. Nordics
- 3.9. Rest of Europe
-
4. Middle East & Africa
- 4.1. Turkey
- 4.2. Israel
- 4.3. GCC
- 4.4. North Africa
- 4.5. South Africa
- 4.6. Rest of Middle East & Africa
-
5. Asia Pacific
- 5.1. China
- 5.2. India
- 5.3. Japan
- 5.4. South Korea
- 5.5. ASEAN
- 5.6. Oceania
- 5.7. Rest of Asia Pacific
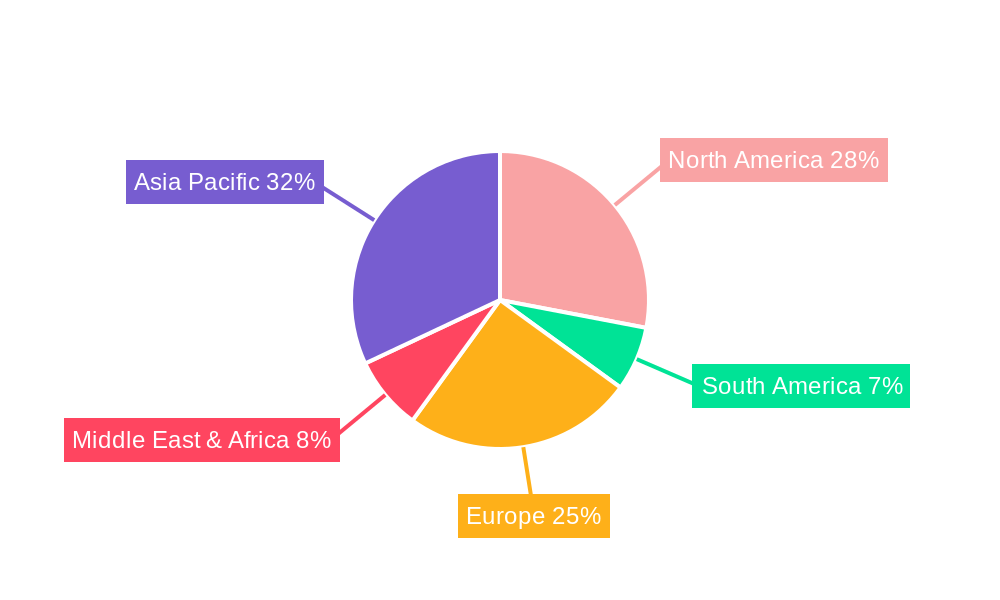
multi fiber optic connectors Regional Market Share
Geographic Coverage of multi fiber optic connectors
multi fiber optic connectors REPORT HIGHLIGHTS
| Aspects | Details |
|---|---|
| Study Period | 2020-2034 |
| Base Year | 2025 |
| Estimated Year | 2026 |
| Forecast Period | 2026-2034 |
| Historical Period | 2020-2025 |
| Growth Rate | CAGR of 12.8% from 2020-2034 |
| Segmentation |
|
Table of Contents
- 1. Introduction
- 1.1. Research Scope
- 1.2. Market Segmentation
- 1.3. Research Methodology
- 1.4. Definitions and Assumptions
- 2. Executive Summary
- 2.1. Introduction
- 3. Market Dynamics
- 3.1. Introduction
- 3.2. Market Drivers
- 3.3. Market Restrains
- 3.4. Market Trends
- 4. Market Factor Analysis
- 4.1. Porters Five Forces
- 4.2. Supply/Value Chain
- 4.3. PESTEL analysis
- 4.4. Market Entropy
- 4.5. Patent/Trademark Analysis
- 5. Global multi fiber optic connectors Analysis, Insights and Forecast, 2020-2032
- 5.1. Market Analysis, Insights and Forecast - by Application
- 5.2. Market Analysis, Insights and Forecast - by Types
- 5.3. Market Analysis, Insights and Forecast - by Region
- 5.3.1. North America
- 5.3.2. South America
- 5.3.3. Europe
- 5.3.4. Middle East & Africa
- 5.3.5. Asia Pacific
- 5.1. Market Analysis, Insights and Forecast - by Application
- 6. North America multi fiber optic connectors Analysis, Insights and Forecast, 2020-2032
- 6.1. Market Analysis, Insights and Forecast - by Application
- 6.2. Market Analysis, Insights and Forecast - by Types
- 6.1. Market Analysis, Insights and Forecast - by Application
- 7. South America multi fiber optic connectors Analysis, Insights and Forecast, 2020-2032
- 7.1. Market Analysis, Insights and Forecast - by Application
- 7.2. Market Analysis, Insights and Forecast - by Types
- 7.1. Market Analysis, Insights and Forecast - by Application
- 8. Europe multi fiber optic connectors Analysis, Insights and Forecast, 2020-2032
- 8.1. Market Analysis, Insights and Forecast - by Application
- 8.2. Market Analysis, Insights and Forecast - by Types
- 8.1. Market Analysis, Insights and Forecast - by Application
- 9. Middle East & Africa multi fiber optic connectors Analysis, Insights and Forecast, 2020-2032
- 9.1. Market Analysis, Insights and Forecast - by Application
- 9.2. Market Analysis, Insights and Forecast - by Types
- 9.1. Market Analysis, Insights and Forecast - by Application
- 10. Asia Pacific multi fiber optic connectors Analysis, Insights and Forecast, 2020-2032
- 10.1. Market Analysis, Insights and Forecast - by Application
- 10.2. Market Analysis, Insights and Forecast - by Types
- 10.1. Market Analysis, Insights and Forecast - by Application
- 11. Competitive Analysis
- 11.1. Global Market Share Analysis 2025
- 11.2. Company Profiles
- 11.2.1 Amphenol
- 11.2.1.1. Overview
- 11.2.1.2. Products
- 11.2.1.3. SWOT Analysis
- 11.2.1.4. Recent Developments
- 11.2.1.5. Financials (Based on Availability)
- 11.2.2 Longxing
- 11.2.2.1. Overview
- 11.2.2.2. Products
- 11.2.2.3. SWOT Analysis
- 11.2.2.4. Recent Developments
- 11.2.2.5. Financials (Based on Availability)
- 11.2.3 T&S Communications
- 11.2.3.1. Overview
- 11.2.3.2. Products
- 11.2.3.3. SWOT Analysis
- 11.2.3.4. Recent Developments
- 11.2.3.5. Financials (Based on Availability)
- 11.2.4 US Conec Ltd
- 11.2.4.1. Overview
- 11.2.4.2. Products
- 11.2.4.3. SWOT Analysis
- 11.2.4.4. Recent Developments
- 11.2.4.5. Financials (Based on Availability)
- 11.2.5 Rean
- 11.2.5.1. Overview
- 11.2.5.2. Products
- 11.2.5.3. SWOT Analysis
- 11.2.5.4. Recent Developments
- 11.2.5.5. Financials (Based on Availability)
- 11.2.1 Amphenol
List of Figures
- Figure 1: Global multi fiber optic connectors Revenue Breakdown (undefined, %) by Region 2025 & 2033
- Figure 2: Global multi fiber optic connectors Volume Breakdown (K, %) by Region 2025 & 2033
- Figure 3: North America multi fiber optic connectors Revenue (undefined), by Application 2025 & 2033
- Figure 4: North America multi fiber optic connectors Volume (K), by Application 2025 & 2033
- Figure 5: North America multi fiber optic connectors Revenue Share (%), by Application 2025 & 2033
- Figure 6: North America multi fiber optic connectors Volume Share (%), by Application 2025 & 2033
- Figure 7: North America multi fiber optic connectors Revenue (undefined), by Types 2025 & 2033
- Figure 8: North America multi fiber optic connectors Volume (K), by Types 2025 & 2033
- Figure 9: North America multi fiber optic connectors Revenue Share (%), by Types 2025 & 2033
- Figure 10: North America multi fiber optic connectors Volume Share (%), by Types 2025 & 2033
- Figure 11: North America multi fiber optic connectors Revenue (undefined), by Country 2025 & 2033
- Figure 12: North America multi fiber optic connectors Volume (K), by Country 2025 & 2033
- Figure 13: North America multi fiber optic connectors Revenue Share (%), by Country 2025 & 2033
- Figure 14: North America multi fiber optic connectors Volume Share (%), by Country 2025 & 2033
- Figure 15: South America multi fiber optic connectors Revenue (undefined), by Application 2025 & 2033
- Figure 16: South America multi fiber optic connectors Volume (K), by Application 2025 & 2033
- Figure 17: South America multi fiber optic connectors Revenue Share (%), by Application 2025 & 2033
- Figure 18: South America multi fiber optic connectors Volume Share (%), by Application 2025 & 2033
- Figure 19: South America multi fiber optic connectors Revenue (undefined), by Types 2025 & 2033
- Figure 20: South America multi fiber optic connectors Volume (K), by Types 2025 & 2033
- Figure 21: South America multi fiber optic connectors Revenue Share (%), by Types 2025 & 2033
- Figure 22: South America multi fiber optic connectors Volume Share (%), by Types 2025 & 2033
- Figure 23: South America multi fiber optic connectors Revenue (undefined), by Country 2025 & 2033
- Figure 24: South America multi fiber optic connectors Volume (K), by Country 2025 & 2033
- Figure 25: South America multi fiber optic connectors Revenue Share (%), by Country 2025 & 2033
- Figure 26: South America multi fiber optic connectors Volume Share (%), by Country 2025 & 2033
- Figure 27: Europe multi fiber optic connectors Revenue (undefined), by Application 2025 & 2033
- Figure 28: Europe multi fiber optic connectors Volume (K), by Application 2025 & 2033
- Figure 29: Europe multi fiber optic connectors Revenue Share (%), by Application 2025 & 2033
- Figure 30: Europe multi fiber optic connectors Volume Share (%), by Application 2025 & 2033
- Figure 31: Europe multi fiber optic connectors Revenue (undefined), by Types 2025 & 2033
- Figure 32: Europe multi fiber optic connectors Volume (K), by Types 2025 & 2033
- Figure 33: Europe multi fiber optic connectors Revenue Share (%), by Types 2025 & 2033
- Figure 34: Europe multi fiber optic connectors Volume Share (%), by Types 2025 & 2033
- Figure 35: Europe multi fiber optic connectors Revenue (undefined), by Country 2025 & 2033
- Figure 36: Europe multi fiber optic connectors Volume (K), by Country 2025 & 2033
- Figure 37: Europe multi fiber optic connectors Revenue Share (%), by Country 2025 & 2033
- Figure 38: Europe multi fiber optic connectors Volume Share (%), by Country 2025 & 2033
- Figure 39: Middle East & Africa multi fiber optic connectors Revenue (undefined), by Application 2025 & 2033
- Figure 40: Middle East & Africa multi fiber optic connectors Volume (K), by Application 2025 & 2033
- Figure 41: Middle East & Africa multi fiber optic connectors Revenue Share (%), by Application 2025 & 2033
- Figure 42: Middle East & Africa multi fiber optic connectors Volume Share (%), by Application 2025 & 2033
- Figure 43: Middle East & Africa multi fiber optic connectors Revenue (undefined), by Types 2025 & 2033
- Figure 44: Middle East & Africa multi fiber optic connectors Volume (K), by Types 2025 & 2033
- Figure 45: Middle East & Africa multi fiber optic connectors Revenue Share (%), by Types 2025 & 2033
- Figure 46: Middle East & Africa multi fiber optic connectors Volume Share (%), by Types 2025 & 2033
- Figure 47: Middle East & Africa multi fiber optic connectors Revenue (undefined), by Country 2025 & 2033
- Figure 48: Middle East & Africa multi fiber optic connectors Volume (K), by Country 2025 & 2033
- Figure 49: Middle East & Africa multi fiber optic connectors Revenue Share (%), by Country 2025 & 2033
- Figure 50: Middle East & Africa multi fiber optic connectors Volume Share (%), by Country 2025 & 2033
- Figure 51: Asia Pacific multi fiber optic connectors Revenue (undefined), by Application 2025 & 2033
- Figure 52: Asia Pacific multi fiber optic connectors Volume (K), by Application 2025 & 2033
- Figure 53: Asia Pacific multi fiber optic connectors Revenue Share (%), by Application 2025 & 2033
- Figure 54: Asia Pacific multi fiber optic connectors Volume Share (%), by Application 2025 & 2033
- Figure 55: Asia Pacific multi fiber optic connectors Revenue (undefined), by Types 2025 & 2033
- Figure 56: Asia Pacific multi fiber optic connectors Volume (K), by Types 2025 & 2033
- Figure 57: Asia Pacific multi fiber optic connectors Revenue Share (%), by Types 2025 & 2033
- Figure 58: Asia Pacific multi fiber optic connectors Volume Share (%), by Types 2025 & 2033
- Figure 59: Asia Pacific multi fiber optic connectors Revenue (undefined), by Country 2025 & 2033
- Figure 60: Asia Pacific multi fiber optic connectors Volume (K), by Country 2025 & 2033
- Figure 61: Asia Pacific multi fiber optic connectors Revenue Share (%), by Country 2025 & 2033
- Figure 62: Asia Pacific multi fiber optic connectors Volume Share (%), by Country 2025 & 2033
List of Tables
- Table 1: Global multi fiber optic connectors Revenue undefined Forecast, by Application 2020 & 2033
- Table 2: Global multi fiber optic connectors Volume K Forecast, by Application 2020 & 2033
- Table 3: Global multi fiber optic connectors Revenue undefined Forecast, by Types 2020 & 2033
- Table 4: Global multi fiber optic connectors Volume K Forecast, by Types 2020 & 2033
- Table 5: Global multi fiber optic connectors Revenue undefined Forecast, by Region 2020 & 2033
- Table 6: Global multi fiber optic connectors Volume K Forecast, by Region 2020 & 2033
- Table 7: Global multi fiber optic connectors Revenue undefined Forecast, by Application 2020 & 2033
- Table 8: Global multi fiber optic connectors Volume K Forecast, by Application 2020 & 2033
- Table 9: Global multi fiber optic connectors Revenue undefined Forecast, by Types 2020 & 2033
- Table 10: Global multi fiber optic connectors Volume K Forecast, by Types 2020 & 2033
- Table 11: Global multi fiber optic connectors Revenue undefined Forecast, by Country 2020 & 2033
- Table 12: Global multi fiber optic connectors Volume K Forecast, by Country 2020 & 2033
- Table 13: United States multi fiber optic connectors Revenue (undefined) Forecast, by Application 2020 & 2033
- Table 14: United States multi fiber optic connectors Volume (K) Forecast, by Application 2020 & 2033
- Table 15: Canada multi fiber optic connectors Revenue (undefined) Forecast, by Application 2020 & 2033
- Table 16: Canada multi fiber optic connectors Volume (K) Forecast, by Application 2020 & 2033
- Table 17: Mexico multi fiber optic connectors Revenue (undefined) Forecast, by Application 2020 & 2033
- Table 18: Mexico multi fiber optic connectors Volume (K) Forecast, by Application 2020 & 2033
- Table 19: Global multi fiber optic connectors Revenue undefined Forecast, by Application 2020 & 2033
- Table 20: Global multi fiber optic connectors Volume K Forecast, by Application 2020 & 2033
- Table 21: Global multi fiber optic connectors Revenue undefined Forecast, by Types 2020 & 2033
- Table 22: Global multi fiber optic connectors Volume K Forecast, by Types 2020 & 2033
- Table 23: Global multi fiber optic connectors Revenue undefined Forecast, by Country 2020 & 2033
- Table 24: Global multi fiber optic connectors Volume K Forecast, by Country 2020 & 2033
- Table 25: Brazil multi fiber optic connectors Revenue (undefined) Forecast, by Application 2020 & 2033
- Table 26: Brazil multi fiber optic connectors Volume (K) Forecast, by Application 2020 & 2033
- Table 27: Argentina multi fiber optic connectors Revenue (undefined) Forecast, by Application 2020 & 2033
- Table 28: Argentina multi fiber optic connectors Volume (K) Forecast, by Application 2020 & 2033
- Table 29: Rest of South America multi fiber optic connectors Revenue (undefined) Forecast, by Application 2020 & 2033
- Table 30: Rest of South America multi fiber optic connectors Volume (K) Forecast, by Application 2020 & 2033
- Table 31: Global multi fiber optic connectors Revenue undefined Forecast, by Application 2020 & 2033
- Table 32: Global multi fiber optic connectors Volume K Forecast, by Application 2020 & 2033
- Table 33: Global multi fiber optic connectors Revenue undefined Forecast, by Types 2020 & 2033
- Table 34: Global multi fiber optic connectors Volume K Forecast, by Types 2020 & 2033
- Table 35: Global multi fiber optic connectors Revenue undefined Forecast, by Country 2020 & 2033
- Table 36: Global multi fiber optic connectors Volume K Forecast, by Country 2020 & 2033
- Table 37: United Kingdom multi fiber optic connectors Revenue (undefined) Forecast, by Application 2020 & 2033
- Table 38: United Kingdom multi fiber optic connectors Volume (K) Forecast, by Application 2020 & 2033
- Table 39: Germany multi fiber optic connectors Revenue (undefined) Forecast, by Application 2020 & 2033
- Table 40: Germany multi fiber optic connectors Volume (K) Forecast, by Application 2020 & 2033
- Table 41: France multi fiber optic connectors Revenue (undefined) Forecast, by Application 2020 & 2033
- Table 42: France multi fiber optic connectors Volume (K) Forecast, by Application 2020 & 2033
- Table 43: Italy multi fiber optic connectors Revenue (undefined) Forecast, by Application 2020 & 2033
- Table 44: Italy multi fiber optic connectors Volume (K) Forecast, by Application 2020 & 2033
- Table 45: Spain multi fiber optic connectors Revenue (undefined) Forecast, by Application 2020 & 2033
- Table 46: Spain multi fiber optic connectors Volume (K) Forecast, by Application 2020 & 2033
- Table 47: Russia multi fiber optic connectors Revenue (undefined) Forecast, by Application 2020 & 2033
- Table 48: Russia multi fiber optic connectors Volume (K) Forecast, by Application 2020 & 2033
- Table 49: Benelux multi fiber optic connectors Revenue (undefined) Forecast, by Application 2020 & 2033
- Table 50: Benelux multi fiber optic connectors Volume (K) Forecast, by Application 2020 & 2033
- Table 51: Nordics multi fiber optic connectors Revenue (undefined) Forecast, by Application 2020 & 2033
- Table 52: Nordics multi fiber optic connectors Volume (K) Forecast, by Application 2020 & 2033
- Table 53: Rest of Europe multi fiber optic connectors Revenue (undefined) Forecast, by Application 2020 & 2033
- Table 54: Rest of Europe multi fiber optic connectors Volume (K) Forecast, by Application 2020 & 2033
- Table 55: Global multi fiber optic connectors Revenue undefined Forecast, by Application 2020 & 2033
- Table 56: Global multi fiber optic connectors Volume K Forecast, by Application 2020 & 2033
- Table 57: Global multi fiber optic connectors Revenue undefined Forecast, by Types 2020 & 2033
- Table 58: Global multi fiber optic connectors Volume K Forecast, by Types 2020 & 2033
- Table 59: Global multi fiber optic connectors Revenue undefined Forecast, by Country 2020 & 2033
- Table 60: Global multi fiber optic connectors Volume K Forecast, by Country 2020 & 2033
- Table 61: Turkey multi fiber optic connectors Revenue (undefined) Forecast, by Application 2020 & 2033
- Table 62: Turkey multi fiber optic connectors Volume (K) Forecast, by Application 2020 & 2033
- Table 63: Israel multi fiber optic connectors Revenue (undefined) Forecast, by Application 2020 & 2033
- Table 64: Israel multi fiber optic connectors Volume (K) Forecast, by Application 2020 & 2033
- Table 65: GCC multi fiber optic connectors Revenue (undefined) Forecast, by Application 2020 & 2033
- Table 66: GCC multi fiber optic connectors Volume (K) Forecast, by Application 2020 & 2033
- Table 67: North Africa multi fiber optic connectors Revenue (undefined) Forecast, by Application 2020 & 2033
- Table 68: North Africa multi fiber optic connectors Volume (K) Forecast, by Application 2020 & 2033
- Table 69: South Africa multi fiber optic connectors Revenue (undefined) Forecast, by Application 2020 & 2033
- Table 70: South Africa multi fiber optic connectors Volume (K) Forecast, by Application 2020 & 2033
- Table 71: Rest of Middle East & Africa multi fiber optic connectors Revenue (undefined) Forecast, by Application 2020 & 2033
- Table 72: Rest of Middle East & Africa multi fiber optic connectors Volume (K) Forecast, by Application 2020 & 2033
- Table 73: Global multi fiber optic connectors Revenue undefined Forecast, by Application 2020 & 2033
- Table 74: Global multi fiber optic connectors Volume K Forecast, by Application 2020 & 2033
- Table 75: Global multi fiber optic connectors Revenue undefined Forecast, by Types 2020 & 2033
- Table 76: Global multi fiber optic connectors Volume K Forecast, by Types 2020 & 2033
- Table 77: Global multi fiber optic connectors Revenue undefined Forecast, by Country 2020 & 2033
- Table 78: Global multi fiber optic connectors Volume K Forecast, by Country 2020 & 2033
- Table 79: China multi fiber optic connectors Revenue (undefined) Forecast, by Application 2020 & 2033
- Table 80: China multi fiber optic connectors Volume (K) Forecast, by Application 2020 & 2033
- Table 81: India multi fiber optic connectors Revenue (undefined) Forecast, by Application 2020 & 2033
- Table 82: India multi fiber optic connectors Volume (K) Forecast, by Application 2020 & 2033
- Table 83: Japan multi fiber optic connectors Revenue (undefined) Forecast, by Application 2020 & 2033
- Table 84: Japan multi fiber optic connectors Volume (K) Forecast, by Application 2020 & 2033
- Table 85: South Korea multi fiber optic connectors Revenue (undefined) Forecast, by Application 2020 & 2033
- Table 86: South Korea multi fiber optic connectors Volume (K) Forecast, by Application 2020 & 2033
- Table 87: ASEAN multi fiber optic connectors Revenue (undefined) Forecast, by Application 2020 & 2033
- Table 88: ASEAN multi fiber optic connectors Volume (K) Forecast, by Application 2020 & 2033
- Table 89: Oceania multi fiber optic connectors Revenue (undefined) Forecast, by Application 2020 & 2033
- Table 90: Oceania multi fiber optic connectors Volume (K) Forecast, by Application 2020 & 2033
- Table 91: Rest of Asia Pacific multi fiber optic connectors Revenue (undefined) Forecast, by Application 2020 & 2033
- Table 92: Rest of Asia Pacific multi fiber optic connectors Volume (K) Forecast, by Application 2020 & 2033
Frequently Asked Questions
1. What is the projected Compound Annual Growth Rate (CAGR) of the multi fiber optic connectors?
The projected CAGR is approximately 12.8%.
2. Which companies are prominent players in the multi fiber optic connectors?
Key companies in the market include Amphenol, Longxing, T&S Communications, US Conec Ltd, Rean.
3. What are the main segments of the multi fiber optic connectors?
The market segments include Application, Types.
4. Can you provide details about the market size?
The market size is estimated to be USD XXX N/A as of 2022.
5. What are some drivers contributing to market growth?
N/A
6. What are the notable trends driving market growth?
N/A
7. Are there any restraints impacting market growth?
N/A
8. Can you provide examples of recent developments in the market?
N/A
9. What pricing options are available for accessing the report?
Pricing options include single-user, multi-user, and enterprise licenses priced at USD 4350.00, USD 6525.00, and USD 8700.00 respectively.
10. Is the market size provided in terms of value or volume?
The market size is provided in terms of value, measured in N/A and volume, measured in K.
11. Are there any specific market keywords associated with the report?
Yes, the market keyword associated with the report is "multi fiber optic connectors," which aids in identifying and referencing the specific market segment covered.
12. How do I determine which pricing option suits my needs best?
The pricing options vary based on user requirements and access needs. Individual users may opt for single-user licenses, while businesses requiring broader access may choose multi-user or enterprise licenses for cost-effective access to the report.
13. Are there any additional resources or data provided in the multi fiber optic connectors report?
While the report offers comprehensive insights, it's advisable to review the specific contents or supplementary materials provided to ascertain if additional resources or data are available.
14. How can I stay updated on further developments or reports in the multi fiber optic connectors?
To stay informed about further developments, trends, and reports in the multi fiber optic connectors, consider subscribing to industry newsletters, following relevant companies and organizations, or regularly checking reputable industry news sources and publications.
Methodology
Step 1 - Identification of Relevant Samples Size from Population Database


Step 2 - Approaches for Defining Global Market Size (Value, Volume* & Price*)

Note*: In applicable scenarios
Step 3 - Data Sources
Primary Research
- Web Analytics
- Survey Reports
- Research Institute
- Latest Research Reports
- Opinion Leaders
Secondary Research
- Annual Reports
- White Paper
- Latest Press Release
- Industry Association
- Paid Database
- Investor Presentations

Step 4 - Data Triangulation
Involves using different sources of information in order to increase the validity of a study
These sources are likely to be stakeholders in a program - participants, other researchers, program staff, other community members, and so on.
Then we put all data in single framework & apply various statistical tools to find out the dynamic on the market.
During the analysis stage, feedback from the stakeholder groups would be compared to determine areas of agreement as well as areas of divergence