

Key Insights
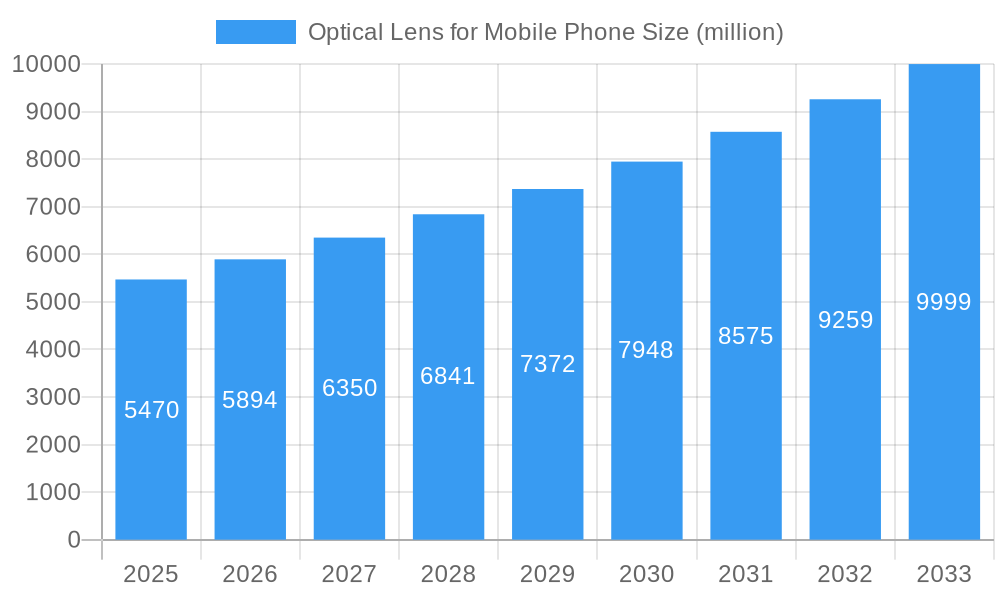
The global market for Optical Lenses for Mobile Phones is poised for significant expansion, projected to reach USD 5.47 billion by 2025. This growth is underpinned by a robust Compound Annual Growth Rate (CAGR) of 7.8%, indicating sustained upward momentum throughout the forecast period (2025-2033). The proliferation of smartphones, with their increasing demand for advanced camera functionalities, is a primary driver. Consumers are seeking higher resolution, improved low-light performance, and enhanced optical zoom capabilities, all of which necessitate sophisticated lens technologies. The evolution of multi-lens camera systems, including wide-angle, ultra-wide-angle, and telephoto lenses, further fuels market demand. Innovation in lens materials, such as the increasing adoption of plastic lenses for their lightweight and cost-effectiveness, alongside advancements in lens coatings to reduce glare and improve light transmission, are also key contributors to market growth. The miniaturization trend in mobile devices also presents opportunities for compact yet high-performance optical lens solutions.
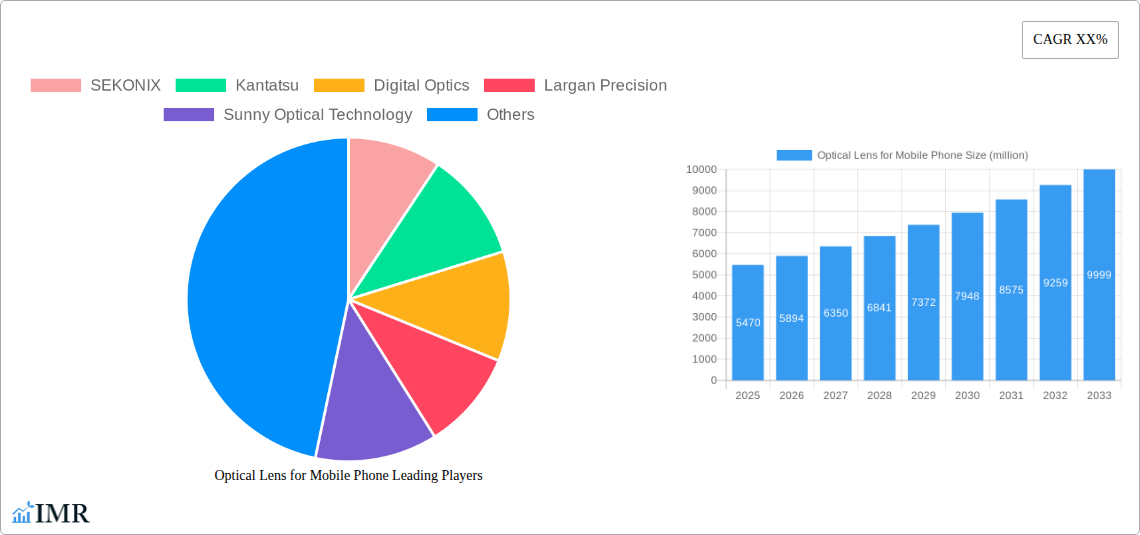
Optical Lens for Mobile Phone Market Size (In Billion)
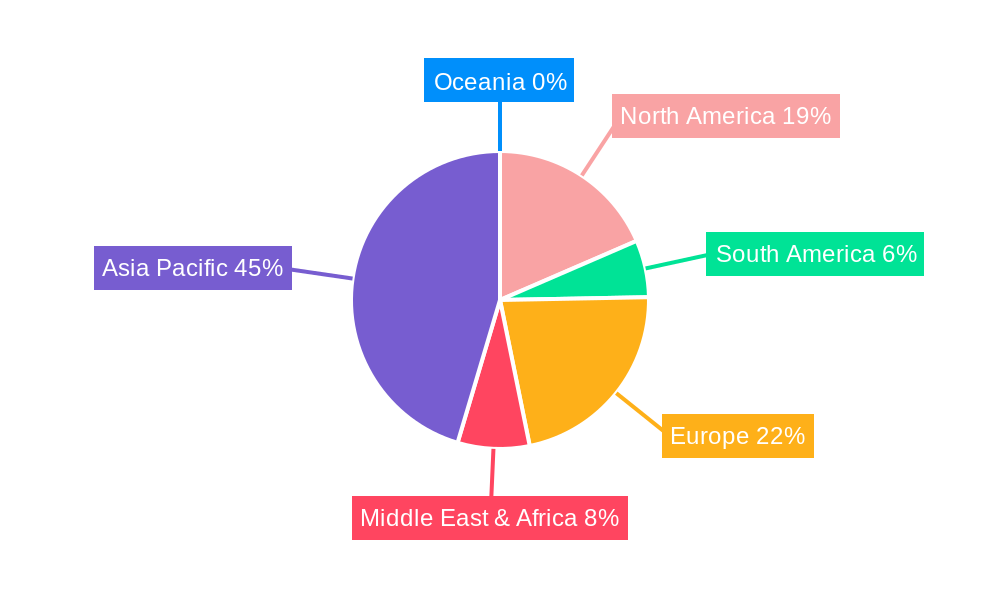
The market segmentation by application reveals a strong emphasis on both front and rear lenses, reflecting the dual importance of selfie cameras and primary imaging systems in modern smartphones. Within types, the 6P-8P lens segment is expected to dominate, followed by the 9P-10P and above categories, signifying a trend towards more complex, high-performance lens assemblies. The "Below 5P" segment will likely see a gradual decline as smartphone manufacturers prioritize superior imaging quality. Geographically, Asia Pacific, particularly China, is expected to lead the market, driven by its massive smartphone manufacturing base and high consumer adoption rates. North America and Europe will remain significant markets, influenced by premium smartphone segment growth and a demand for advanced imaging features. Key players like Largan Precision, Sunny Optical Technology, and Genius Electronic Optical (GSEO) are at the forefront of innovation, investing heavily in research and development to meet the evolving demands of the mobile industry.
Optical Lens for Mobile Phone Company Market Share
This in-depth market research report provides a definitive analysis of the Optical Lens for Mobile Phone Market, offering critical insights into its structure, dynamics, growth trends, and future outlook. Covering the historical period from 2019 to 2024 and projecting growth through 2033, this report is an indispensable resource for industry professionals, investors, and strategists seeking to navigate this rapidly evolving landscape.
Optical Lens for Mobile Phone Market Dynamics & Structure
The global optical lens for mobile phone market is characterized by a moderate level of concentration, with a few key players like Largan Precision, Sunny Optical Technology, and Genius Electronic Optical (GSEO) holding significant market share. Technological innovation is the primary driver, fueled by the relentless demand for enhanced mobile photography capabilities, including higher resolutions, improved low-light performance, and advanced optical zoom. The development of sophisticated lens structures, such as 7-element and 9-element lenses, and the integration of specialized coatings are key areas of innovation. Regulatory frameworks primarily revolve around product safety, environmental compliance, and intellectual property rights, with no significant overarching barriers. Competitive product substitutes are limited, given the specialized nature of mobile phone optics, though advancements in sensor technology can indirectly influence lens requirements. End-user demographics are broad, encompassing all mobile phone users, with a growing segment of photography enthusiasts demanding premium imaging experiences. Mergers and acquisitions (M&A) are moderately active, as companies seek to consolidate market share, acquire cutting-edge technologies, or expand their geographical reach. For instance, the historical period saw several strategic acquisitions aimed at bolstering R&D capabilities in advanced optics and manufacturing processes. The overall market structure is evolving towards greater specialization and integration, with a focus on delivering compact yet powerful optical solutions.
Optical Lens for Mobile Phone Growth Trends & Insights
The optical lens for mobile phone market is poised for substantial growth, driven by escalating smartphone penetration globally and the continuous upgrade cycle of mobile devices. The market size is projected to witness a Compound Annual Growth Rate (CAGR) of approximately xx% during the forecast period (2025-2033), reaching an estimated value of $xx billion in 2025. This expansion is largely attributed to the increasing adoption of multi-lens camera systems, where smartphones are now commonly equipped with two, three, or even four rear lenses, each serving a specific purpose like wide-angle, ultra-wide-angle, telephoto, and macro photography. Furthermore, the integration of advanced computational photography techniques necessitates higher quality optical components to capture the raw data effectively. Consumer behavior has significantly shifted towards prioritizing camera quality as a key purchasing decision, directly impacting the demand for sophisticated optical lenses. The market penetration of high-end lens configurations (e.g., 9P-10P and 10P Above) is expected to rise, driven by the desire for professional-grade photography from mobile devices. Technological disruptions, such as the development of thinner and more powerful lenses, plastic-hybrid optics, and miniature zoom modules, are continuously reshaping the product landscape and driving adoption rates. The historical period (2019-2024) has already demonstrated a robust upward trend, with annual market growth rates averaging around xx%. The estimated market size in 2025 is projected to be around $xx billion, highlighting the significant economic scale of this sector.
Dominant Regions, Countries, or Segments in Optical Lens for Mobile Phone
The Rear Lens segment within the optical lens for mobile phone market is currently the dominant driver of market growth, propelled by the increasing complexity and consumer demand for advanced mobile photography. This segment is projected to continue its leadership throughout the forecast period, reaching an estimated market size of $xx billion by 2025. The dominance of rear lenses stems from the arms race among smartphone manufacturers to equip their devices with superior camera systems capable of capturing high-resolution images and videos in diverse conditions. Key drivers for this dominance include:
- Technological Advancements in Multi-Lens Systems: The widespread adoption of dual, triple, and quad-camera setups for wide-angle, ultra-wide, telephoto, and macro functionalities directly increases the demand for multiple rear lenses per device.
- Consumer Prioritization of Camera Quality: In major markets like Asia-Pacific and North America, smartphone camera performance is a crucial factor influencing purchasing decisions. This fuels continuous innovation and demand for premium rear lens modules.
- Integration of Advanced Features: Features such as optical zoom, periscope lenses, and enhanced low-light capabilities are exclusively incorporated into rear camera systems, necessitating more sophisticated and higher-count pixel lenses.
Among the Types of optical lenses, the 6P-8P segment currently holds a significant market share, driven by its optimal balance of optical performance and manufacturing cost for mainstream smartphone applications. However, the 9P-10P and 10P Above segments are experiencing the fastest growth rates, indicating a strong shift towards higher-element count lenses to achieve superior image quality and advanced optical functionalities. This trend is particularly evident in premium smartphone models.
Geographically, Asia-Pacific stands out as the dominant region, accounting for over xx% of the global optical lens for mobile phone market share in 2025. This dominance is underpinned by:
- Manufacturing Hub: Countries like China and South Korea are major manufacturing centers for smartphones and their components, including optical lenses, leading to a high concentration of demand and production.
- High Smartphone Penetration: The region boasts the highest smartphone penetration rates globally, with a vast consumer base actively upgrading their devices.
- Rapid Technological Adoption: Consumers in Asia-Pacific are early adopters of new mobile technologies, including advanced camera features, driving the demand for premium optical solutions.
- Economic Policies and Infrastructure: Favorable government policies supporting the electronics manufacturing sector and robust supply chain infrastructure further bolster the region's dominance.
Optical Lens for Mobile Phone Product Landscape
The optical lens for mobile phone product landscape is characterized by continuous innovation focused on miniaturization, increased element counts, and enhanced optical performance. Companies are developing advanced lens solutions with higher pixel counts, such as 9P-10P and even 10P Above configurations, to improve image clarity, reduce aberrations, and enable features like enhanced optical zoom. The integration of aspherical elements, specialized coatings for reduced glare and improved light transmission, and the use of high-refractive index plastics are key technological advancements. Unique selling propositions often lie in achieving superior image quality comparable to dedicated cameras, enabling professional-grade photography and videography directly from smartphones.
Key Drivers, Barriers & Challenges in Optical Lens for Mobile Phone
Key Drivers:
- Increasing Demand for High-Quality Mobile Photography: The smartphone has become the primary camera for most consumers, driving the need for advanced imaging capabilities.
- Technological Advancements: Innovations in lens design, materials, and manufacturing processes enable higher performance in smaller form factors.
- Growth of Multi-Lens Camera Systems: The proliferation of dual, triple, and quad-camera setups directly increases the demand for multiple, specialized lenses.
- Rising Smartphone Penetration: Growing adoption of smartphones, especially in emerging economies, expands the overall market.
Key Barriers & Challenges:
- Manufacturing Complexity and Cost: Producing high-element count, precision lenses is capital-intensive and requires stringent quality control.
- Miniaturization Demands: Fitting increasingly complex optical systems into ever-thinner smartphone designs presents significant engineering challenges.
- Supply Chain Disruptions: Geopolitical events, raw material availability, and logistics can impact the efficient production and delivery of lenses.
- Intense Competition: The market is highly competitive, putting pressure on pricing and profit margins.
- Rapid Technological Obsolescence: The fast pace of smartphone innovation means lens technologies can become outdated quickly.
Emerging Opportunities in Optical Lens for Mobile Phone
Emerging opportunities in the optical lens for mobile phone sector lie in the development of advanced periscope lens systems for significantly enhanced optical zoom capabilities without increasing device thickness. The integration of liquid lens technology for rapid autofocus and variable aperture control also presents a significant growth avenue. Furthermore, the expanding augmented reality (AR) and virtual reality (VR) markets will create demand for specialized optical modules within mobile devices, potentially for advanced depth sensing and immersive experiences. Untapped markets in developing regions, where smartphone adoption is still growing, represent a substantial opportunity for market penetration.
Growth Accelerators in the Optical Lens for Mobile Phone Industry
Growth accelerators for the optical lens for mobile phone industry are primarily technological breakthroughs and strategic market expansion. The continuous refinement of manufacturing processes for higher-element count lenses (e.g., 9P-10P and above) is a key accelerator, enabling smartphone manufacturers to offer premium imaging features. Strategic partnerships between lens manufacturers and smartphone brands, fostering co-development and early integration of new optical technologies, also significantly boost growth. Furthermore, the expansion of the foldable smartphone market, which requires highly durable and compact optical solutions, represents another significant growth catalyst.
Key Players Shaping the Optical Lens for Mobile Phone Market
- SEKONIX
- Kantatsu
- Digital Optics
- Largan Precision
- Sunny Optical Technology
- Genius Electronic Optical (GSEO)
- Asia Optical
- AAC
- Ofilm Group
- NEWMAX
- AOET
- Lianchuang Electronic Technology
Notable Milestones in Optical Lens for Mobile Phone Sector
- 2019: Introduction of the first 7-element lenses in mainstream flagship smartphones, significantly improving image quality.
- 2020: Widespread adoption of 5-lens rear camera modules in premium devices.
- 2021: Advancements in periscope lens technology enabling 5x and 10x optical zoom in commercial smartphones.
- 2022: Increased use of plastic-hybrid lenses to reduce size and weight while maintaining optical performance.
- 2023: Emergence of 9-element and 10-element lenses in high-end devices, pushing the boundaries of mobile photography.
- 2024: Growing integration of computational photography enablers through advanced lens design and materials.
In-Depth Optical Lens for Mobile Phone Market Outlook
The future outlook for the optical lens for mobile phone market is exceptionally promising, driven by an unwavering consumer demand for superior mobile imaging experiences and ongoing technological advancements. The market is expected to witness sustained growth, propelled by the increasing adoption of advanced lens configurations, periscope zoom systems, and novel optical technologies for AR/VR applications. Strategic collaborations between key players and ongoing R&D investments will be crucial in unlocking new frontiers in mobile optics, solidifying the smartphone's position as a primary photography and videography tool.
Optical Lens for Mobile Phone Segmentation
-
1. Application
- 1.1. Front Lens
- 1.2. Rear Lens
-
2. Types
- 2.1. Below 5P
- 2.2. 6P-8P
- 2.3. 9P-10P
- 2.4. 10P Above
Optical Lens for Mobile Phone Segmentation By Geography
-
1. North America
- 1.1. United States
- 1.2. Canada
- 1.3. Mexico
-
2. South America
- 2.1. Brazil
- 2.2. Argentina
- 2.3. Rest of South America
-
3. Europe
- 3.1. United Kingdom
- 3.2. Germany
- 3.3. France
- 3.4. Italy
- 3.5. Spain
- 3.6. Russia
- 3.7. Benelux
- 3.8. Nordics
- 3.9. Rest of Europe
-
4. Middle East & Africa
- 4.1. Turkey
- 4.2. Israel
- 4.3. GCC
- 4.4. North Africa
- 4.5. South Africa
- 4.6. Rest of Middle East & Africa
-
5. Asia Pacific
- 5.1. China
- 5.2. India
- 5.3. Japan
- 5.4. South Korea
- 5.5. ASEAN
- 5.6. Oceania
- 5.7. Rest of Asia Pacific
Optical Lens for Mobile Phone Regional Market Share
Geographic Coverage of Optical Lens for Mobile Phone
Optical Lens for Mobile Phone REPORT HIGHLIGHTS
| Aspects | Details |
|---|---|
| Study Period | 2020-2034 |
| Base Year | 2025 |
| Estimated Year | 2026 |
| Forecast Period | 2026-2034 |
| Historical Period | 2020-2025 |
| Growth Rate | CAGR of 7.8% from 2020-2034 |
| Segmentation |
|
Table of Contents
- 1. Introduction
- 1.1. Research Scope
- 1.2. Market Segmentation
- 1.3. Research Methodology
- 1.4. Definitions and Assumptions
- 2. Executive Summary
- 2.1. Introduction
- 3. Market Dynamics
- 3.1. Introduction
- 3.2. Market Drivers
- 3.3. Market Restrains
- 3.4. Market Trends
- 4. Market Factor Analysis
- 4.1. Porters Five Forces
- 4.2. Supply/Value Chain
- 4.3. PESTEL analysis
- 4.4. Market Entropy
- 4.5. Patent/Trademark Analysis
- 5. Global Optical Lens for Mobile Phone Analysis, Insights and Forecast, 2020-2032
- 5.1. Market Analysis, Insights and Forecast - by Application
- 5.1.1. Front Lens
- 5.1.2. Rear Lens
- 5.2. Market Analysis, Insights and Forecast - by Types
- 5.2.1. Below 5P
- 5.2.2. 6P-8P
- 5.2.3. 9P-10P
- 5.2.4. 10P Above
- 5.3. Market Analysis, Insights and Forecast - by Region
- 5.3.1. North America
- 5.3.2. South America
- 5.3.3. Europe
- 5.3.4. Middle East & Africa
- 5.3.5. Asia Pacific
- 5.1. Market Analysis, Insights and Forecast - by Application
- 6. North America Optical Lens for Mobile Phone Analysis, Insights and Forecast, 2020-2032
- 6.1. Market Analysis, Insights and Forecast - by Application
- 6.1.1. Front Lens
- 6.1.2. Rear Lens
- 6.2. Market Analysis, Insights and Forecast - by Types
- 6.2.1. Below 5P
- 6.2.2. 6P-8P
- 6.2.3. 9P-10P
- 6.2.4. 10P Above
- 6.1. Market Analysis, Insights and Forecast - by Application
- 7. South America Optical Lens for Mobile Phone Analysis, Insights and Forecast, 2020-2032
- 7.1. Market Analysis, Insights and Forecast - by Application
- 7.1.1. Front Lens
- 7.1.2. Rear Lens
- 7.2. Market Analysis, Insights and Forecast - by Types
- 7.2.1. Below 5P
- 7.2.2. 6P-8P
- 7.2.3. 9P-10P
- 7.2.4. 10P Above
- 7.1. Market Analysis, Insights and Forecast - by Application
- 8. Europe Optical Lens for Mobile Phone Analysis, Insights and Forecast, 2020-2032
- 8.1. Market Analysis, Insights and Forecast - by Application
- 8.1.1. Front Lens
- 8.1.2. Rear Lens
- 8.2. Market Analysis, Insights and Forecast - by Types
- 8.2.1. Below 5P
- 8.2.2. 6P-8P
- 8.2.3. 9P-10P
- 8.2.4. 10P Above
- 8.1. Market Analysis, Insights and Forecast - by Application
- 9. Middle East & Africa Optical Lens for Mobile Phone Analysis, Insights and Forecast, 2020-2032
- 9.1. Market Analysis, Insights and Forecast - by Application
- 9.1.1. Front Lens
- 9.1.2. Rear Lens
- 9.2. Market Analysis, Insights and Forecast - by Types
- 9.2.1. Below 5P
- 9.2.2. 6P-8P
- 9.2.3. 9P-10P
- 9.2.4. 10P Above
- 9.1. Market Analysis, Insights and Forecast - by Application
- 10. Asia Pacific Optical Lens for Mobile Phone Analysis, Insights and Forecast, 2020-2032
- 10.1. Market Analysis, Insights and Forecast - by Application
- 10.1.1. Front Lens
- 10.1.2. Rear Lens
- 10.2. Market Analysis, Insights and Forecast - by Types
- 10.2.1. Below 5P
- 10.2.2. 6P-8P
- 10.2.3. 9P-10P
- 10.2.4. 10P Above
- 10.1. Market Analysis, Insights and Forecast - by Application
- 11. Competitive Analysis
- 11.1. Global Market Share Analysis 2025
- 11.2. Company Profiles
- 11.2.1 SEKONIX
- 11.2.1.1. Overview
- 11.2.1.2. Products
- 11.2.1.3. SWOT Analysis
- 11.2.1.4. Recent Developments
- 11.2.1.5. Financials (Based on Availability)
- 11.2.2 Kantatsu
- 11.2.2.1. Overview
- 11.2.2.2. Products
- 11.2.2.3. SWOT Analysis
- 11.2.2.4. Recent Developments
- 11.2.2.5. Financials (Based on Availability)
- 11.2.3 Digital Optics
- 11.2.3.1. Overview
- 11.2.3.2. Products
- 11.2.3.3. SWOT Analysis
- 11.2.3.4. Recent Developments
- 11.2.3.5. Financials (Based on Availability)
- 11.2.4 Largan Precision
- 11.2.4.1. Overview
- 11.2.4.2. Products
- 11.2.4.3. SWOT Analysis
- 11.2.4.4. Recent Developments
- 11.2.4.5. Financials (Based on Availability)
- 11.2.5 Sunny Optical Technology
- 11.2.5.1. Overview
- 11.2.5.2. Products
- 11.2.5.3. SWOT Analysis
- 11.2.5.4. Recent Developments
- 11.2.5.5. Financials (Based on Availability)
- 11.2.6 Genius Electronic Optical (GSEO)
- 11.2.6.1. Overview
- 11.2.6.2. Products
- 11.2.6.3. SWOT Analysis
- 11.2.6.4. Recent Developments
- 11.2.6.5. Financials (Based on Availability)
- 11.2.7 Asia Optical
- 11.2.7.1. Overview
- 11.2.7.2. Products
- 11.2.7.3. SWOT Analysis
- 11.2.7.4. Recent Developments
- 11.2.7.5. Financials (Based on Availability)
- 11.2.8 AAC
- 11.2.8.1. Overview
- 11.2.8.2. Products
- 11.2.8.3. SWOT Analysis
- 11.2.8.4. Recent Developments
- 11.2.8.5. Financials (Based on Availability)
- 11.2.9 Ofilm Group
- 11.2.9.1. Overview
- 11.2.9.2. Products
- 11.2.9.3. SWOT Analysis
- 11.2.9.4. Recent Developments
- 11.2.9.5. Financials (Based on Availability)
- 11.2.10 NEWMAX
- 11.2.10.1. Overview
- 11.2.10.2. Products
- 11.2.10.3. SWOT Analysis
- 11.2.10.4. Recent Developments
- 11.2.10.5. Financials (Based on Availability)
- 11.2.11 AOET
- 11.2.11.1. Overview
- 11.2.11.2. Products
- 11.2.11.3. SWOT Analysis
- 11.2.11.4. Recent Developments
- 11.2.11.5. Financials (Based on Availability)
- 11.2.12 Lianchuang Electronic Technology
- 11.2.12.1. Overview
- 11.2.12.2. Products
- 11.2.12.3. SWOT Analysis
- 11.2.12.4. Recent Developments
- 11.2.12.5. Financials (Based on Availability)
- 11.2.1 SEKONIX
List of Figures
- Figure 1: Global Optical Lens for Mobile Phone Revenue Breakdown (undefined, %) by Region 2025 & 2033
- Figure 2: Global Optical Lens for Mobile Phone Volume Breakdown (K, %) by Region 2025 & 2033
- Figure 3: North America Optical Lens for Mobile Phone Revenue (undefined), by Application 2025 & 2033
- Figure 4: North America Optical Lens for Mobile Phone Volume (K), by Application 2025 & 2033
- Figure 5: North America Optical Lens for Mobile Phone Revenue Share (%), by Application 2025 & 2033
- Figure 6: North America Optical Lens for Mobile Phone Volume Share (%), by Application 2025 & 2033
- Figure 7: North America Optical Lens for Mobile Phone Revenue (undefined), by Types 2025 & 2033
- Figure 8: North America Optical Lens for Mobile Phone Volume (K), by Types 2025 & 2033
- Figure 9: North America Optical Lens for Mobile Phone Revenue Share (%), by Types 2025 & 2033
- Figure 10: North America Optical Lens for Mobile Phone Volume Share (%), by Types 2025 & 2033
- Figure 11: North America Optical Lens for Mobile Phone Revenue (undefined), by Country 2025 & 2033
- Figure 12: North America Optical Lens for Mobile Phone Volume (K), by Country 2025 & 2033
- Figure 13: North America Optical Lens for Mobile Phone Revenue Share (%), by Country 2025 & 2033
- Figure 14: North America Optical Lens for Mobile Phone Volume Share (%), by Country 2025 & 2033
- Figure 15: South America Optical Lens for Mobile Phone Revenue (undefined), by Application 2025 & 2033
- Figure 16: South America Optical Lens for Mobile Phone Volume (K), by Application 2025 & 2033
- Figure 17: South America Optical Lens for Mobile Phone Revenue Share (%), by Application 2025 & 2033
- Figure 18: South America Optical Lens for Mobile Phone Volume Share (%), by Application 2025 & 2033
- Figure 19: South America Optical Lens for Mobile Phone Revenue (undefined), by Types 2025 & 2033
- Figure 20: South America Optical Lens for Mobile Phone Volume (K), by Types 2025 & 2033
- Figure 21: South America Optical Lens for Mobile Phone Revenue Share (%), by Types 2025 & 2033
- Figure 22: South America Optical Lens for Mobile Phone Volume Share (%), by Types 2025 & 2033
- Figure 23: South America Optical Lens for Mobile Phone Revenue (undefined), by Country 2025 & 2033
- Figure 24: South America Optical Lens for Mobile Phone Volume (K), by Country 2025 & 2033
- Figure 25: South America Optical Lens for Mobile Phone Revenue Share (%), by Country 2025 & 2033
- Figure 26: South America Optical Lens for Mobile Phone Volume Share (%), by Country 2025 & 2033
- Figure 27: Europe Optical Lens for Mobile Phone Revenue (undefined), by Application 2025 & 2033
- Figure 28: Europe Optical Lens for Mobile Phone Volume (K), by Application 2025 & 2033
- Figure 29: Europe Optical Lens for Mobile Phone Revenue Share (%), by Application 2025 & 2033
- Figure 30: Europe Optical Lens for Mobile Phone Volume Share (%), by Application 2025 & 2033
- Figure 31: Europe Optical Lens for Mobile Phone Revenue (undefined), by Types 2025 & 2033
- Figure 32: Europe Optical Lens for Mobile Phone Volume (K), by Types 2025 & 2033
- Figure 33: Europe Optical Lens for Mobile Phone Revenue Share (%), by Types 2025 & 2033
- Figure 34: Europe Optical Lens for Mobile Phone Volume Share (%), by Types 2025 & 2033
- Figure 35: Europe Optical Lens for Mobile Phone Revenue (undefined), by Country 2025 & 2033
- Figure 36: Europe Optical Lens for Mobile Phone Volume (K), by Country 2025 & 2033
- Figure 37: Europe Optical Lens for Mobile Phone Revenue Share (%), by Country 2025 & 2033
- Figure 38: Europe Optical Lens for Mobile Phone Volume Share (%), by Country 2025 & 2033
- Figure 39: Middle East & Africa Optical Lens for Mobile Phone Revenue (undefined), by Application 2025 & 2033
- Figure 40: Middle East & Africa Optical Lens for Mobile Phone Volume (K), by Application 2025 & 2033
- Figure 41: Middle East & Africa Optical Lens for Mobile Phone Revenue Share (%), by Application 2025 & 2033
- Figure 42: Middle East & Africa Optical Lens for Mobile Phone Volume Share (%), by Application 2025 & 2033
- Figure 43: Middle East & Africa Optical Lens for Mobile Phone Revenue (undefined), by Types 2025 & 2033
- Figure 44: Middle East & Africa Optical Lens for Mobile Phone Volume (K), by Types 2025 & 2033
- Figure 45: Middle East & Africa Optical Lens for Mobile Phone Revenue Share (%), by Types 2025 & 2033
- Figure 46: Middle East & Africa Optical Lens for Mobile Phone Volume Share (%), by Types 2025 & 2033
- Figure 47: Middle East & Africa Optical Lens for Mobile Phone Revenue (undefined), by Country 2025 & 2033
- Figure 48: Middle East & Africa Optical Lens for Mobile Phone Volume (K), by Country 2025 & 2033
- Figure 49: Middle East & Africa Optical Lens for Mobile Phone Revenue Share (%), by Country 2025 & 2033
- Figure 50: Middle East & Africa Optical Lens for Mobile Phone Volume Share (%), by Country 2025 & 2033
- Figure 51: Asia Pacific Optical Lens for Mobile Phone Revenue (undefined), by Application 2025 & 2033
- Figure 52: Asia Pacific Optical Lens for Mobile Phone Volume (K), by Application 2025 & 2033
- Figure 53: Asia Pacific Optical Lens for Mobile Phone Revenue Share (%), by Application 2025 & 2033
- Figure 54: Asia Pacific Optical Lens for Mobile Phone Volume Share (%), by Application 2025 & 2033
- Figure 55: Asia Pacific Optical Lens for Mobile Phone Revenue (undefined), by Types 2025 & 2033
- Figure 56: Asia Pacific Optical Lens for Mobile Phone Volume (K), by Types 2025 & 2033
- Figure 57: Asia Pacific Optical Lens for Mobile Phone Revenue Share (%), by Types 2025 & 2033
- Figure 58: Asia Pacific Optical Lens for Mobile Phone Volume Share (%), by Types 2025 & 2033
- Figure 59: Asia Pacific Optical Lens for Mobile Phone Revenue (undefined), by Country 2025 & 2033
- Figure 60: Asia Pacific Optical Lens for Mobile Phone Volume (K), by Country 2025 & 2033
- Figure 61: Asia Pacific Optical Lens for Mobile Phone Revenue Share (%), by Country 2025 & 2033
- Figure 62: Asia Pacific Optical Lens for Mobile Phone Volume Share (%), by Country 2025 & 2033
List of Tables
- Table 1: Global Optical Lens for Mobile Phone Revenue undefined Forecast, by Application 2020 & 2033
- Table 2: Global Optical Lens for Mobile Phone Volume K Forecast, by Application 2020 & 2033
- Table 3: Global Optical Lens for Mobile Phone Revenue undefined Forecast, by Types 2020 & 2033
- Table 4: Global Optical Lens for Mobile Phone Volume K Forecast, by Types 2020 & 2033
- Table 5: Global Optical Lens for Mobile Phone Revenue undefined Forecast, by Region 2020 & 2033
- Table 6: Global Optical Lens for Mobile Phone Volume K Forecast, by Region 2020 & 2033
- Table 7: Global Optical Lens for Mobile Phone Revenue undefined Forecast, by Application 2020 & 2033
- Table 8: Global Optical Lens for Mobile Phone Volume K Forecast, by Application 2020 & 2033
- Table 9: Global Optical Lens for Mobile Phone Revenue undefined Forecast, by Types 2020 & 2033
- Table 10: Global Optical Lens for Mobile Phone Volume K Forecast, by Types 2020 & 2033
- Table 11: Global Optical Lens for Mobile Phone Revenue undefined Forecast, by Country 2020 & 2033
- Table 12: Global Optical Lens for Mobile Phone Volume K Forecast, by Country 2020 & 2033
- Table 13: United States Optical Lens for Mobile Phone Revenue (undefined) Forecast, by Application 2020 & 2033
- Table 14: United States Optical Lens for Mobile Phone Volume (K) Forecast, by Application 2020 & 2033
- Table 15: Canada Optical Lens for Mobile Phone Revenue (undefined) Forecast, by Application 2020 & 2033
- Table 16: Canada Optical Lens for Mobile Phone Volume (K) Forecast, by Application 2020 & 2033
- Table 17: Mexico Optical Lens for Mobile Phone Revenue (undefined) Forecast, by Application 2020 & 2033
- Table 18: Mexico Optical Lens for Mobile Phone Volume (K) Forecast, by Application 2020 & 2033
- Table 19: Global Optical Lens for Mobile Phone Revenue undefined Forecast, by Application 2020 & 2033
- Table 20: Global Optical Lens for Mobile Phone Volume K Forecast, by Application 2020 & 2033
- Table 21: Global Optical Lens for Mobile Phone Revenue undefined Forecast, by Types 2020 & 2033
- Table 22: Global Optical Lens for Mobile Phone Volume K Forecast, by Types 2020 & 2033
- Table 23: Global Optical Lens for Mobile Phone Revenue undefined Forecast, by Country 2020 & 2033
- Table 24: Global Optical Lens for Mobile Phone Volume K Forecast, by Country 2020 & 2033
- Table 25: Brazil Optical Lens for Mobile Phone Revenue (undefined) Forecast, by Application 2020 & 2033
- Table 26: Brazil Optical Lens for Mobile Phone Volume (K) Forecast, by Application 2020 & 2033
- Table 27: Argentina Optical Lens for Mobile Phone Revenue (undefined) Forecast, by Application 2020 & 2033
- Table 28: Argentina Optical Lens for Mobile Phone Volume (K) Forecast, by Application 2020 & 2033
- Table 29: Rest of South America Optical Lens for Mobile Phone Revenue (undefined) Forecast, by Application 2020 & 2033
- Table 30: Rest of South America Optical Lens for Mobile Phone Volume (K) Forecast, by Application 2020 & 2033
- Table 31: Global Optical Lens for Mobile Phone Revenue undefined Forecast, by Application 2020 & 2033
- Table 32: Global Optical Lens for Mobile Phone Volume K Forecast, by Application 2020 & 2033
- Table 33: Global Optical Lens for Mobile Phone Revenue undefined Forecast, by Types 2020 & 2033
- Table 34: Global Optical Lens for Mobile Phone Volume K Forecast, by Types 2020 & 2033
- Table 35: Global Optical Lens for Mobile Phone Revenue undefined Forecast, by Country 2020 & 2033
- Table 36: Global Optical Lens for Mobile Phone Volume K Forecast, by Country 2020 & 2033
- Table 37: United Kingdom Optical Lens for Mobile Phone Revenue (undefined) Forecast, by Application 2020 & 2033
- Table 38: United Kingdom Optical Lens for Mobile Phone Volume (K) Forecast, by Application 2020 & 2033
- Table 39: Germany Optical Lens for Mobile Phone Revenue (undefined) Forecast, by Application 2020 & 2033
- Table 40: Germany Optical Lens for Mobile Phone Volume (K) Forecast, by Application 2020 & 2033
- Table 41: France Optical Lens for Mobile Phone Revenue (undefined) Forecast, by Application 2020 & 2033
- Table 42: France Optical Lens for Mobile Phone Volume (K) Forecast, by Application 2020 & 2033
- Table 43: Italy Optical Lens for Mobile Phone Revenue (undefined) Forecast, by Application 2020 & 2033
- Table 44: Italy Optical Lens for Mobile Phone Volume (K) Forecast, by Application 2020 & 2033
- Table 45: Spain Optical Lens for Mobile Phone Revenue (undefined) Forecast, by Application 2020 & 2033
- Table 46: Spain Optical Lens for Mobile Phone Volume (K) Forecast, by Application 2020 & 2033
- Table 47: Russia Optical Lens for Mobile Phone Revenue (undefined) Forecast, by Application 2020 & 2033
- Table 48: Russia Optical Lens for Mobile Phone Volume (K) Forecast, by Application 2020 & 2033
- Table 49: Benelux Optical Lens for Mobile Phone Revenue (undefined) Forecast, by Application 2020 & 2033
- Table 50: Benelux Optical Lens for Mobile Phone Volume (K) Forecast, by Application 2020 & 2033
- Table 51: Nordics Optical Lens for Mobile Phone Revenue (undefined) Forecast, by Application 2020 & 2033
- Table 52: Nordics Optical Lens for Mobile Phone Volume (K) Forecast, by Application 2020 & 2033
- Table 53: Rest of Europe Optical Lens for Mobile Phone Revenue (undefined) Forecast, by Application 2020 & 2033
- Table 54: Rest of Europe Optical Lens for Mobile Phone Volume (K) Forecast, by Application 2020 & 2033
- Table 55: Global Optical Lens for Mobile Phone Revenue undefined Forecast, by Application 2020 & 2033
- Table 56: Global Optical Lens for Mobile Phone Volume K Forecast, by Application 2020 & 2033
- Table 57: Global Optical Lens for Mobile Phone Revenue undefined Forecast, by Types 2020 & 2033
- Table 58: Global Optical Lens for Mobile Phone Volume K Forecast, by Types 2020 & 2033
- Table 59: Global Optical Lens for Mobile Phone Revenue undefined Forecast, by Country 2020 & 2033
- Table 60: Global Optical Lens for Mobile Phone Volume K Forecast, by Country 2020 & 2033
- Table 61: Turkey Optical Lens for Mobile Phone Revenue (undefined) Forecast, by Application 2020 & 2033
- Table 62: Turkey Optical Lens for Mobile Phone Volume (K) Forecast, by Application 2020 & 2033
- Table 63: Israel Optical Lens for Mobile Phone Revenue (undefined) Forecast, by Application 2020 & 2033
- Table 64: Israel Optical Lens for Mobile Phone Volume (K) Forecast, by Application 2020 & 2033
- Table 65: GCC Optical Lens for Mobile Phone Revenue (undefined) Forecast, by Application 2020 & 2033
- Table 66: GCC Optical Lens for Mobile Phone Volume (K) Forecast, by Application 2020 & 2033
- Table 67: North Africa Optical Lens for Mobile Phone Revenue (undefined) Forecast, by Application 2020 & 2033
- Table 68: North Africa Optical Lens for Mobile Phone Volume (K) Forecast, by Application 2020 & 2033
- Table 69: South Africa Optical Lens for Mobile Phone Revenue (undefined) Forecast, by Application 2020 & 2033
- Table 70: South Africa Optical Lens for Mobile Phone Volume (K) Forecast, by Application 2020 & 2033
- Table 71: Rest of Middle East & Africa Optical Lens for Mobile Phone Revenue (undefined) Forecast, by Application 2020 & 2033
- Table 72: Rest of Middle East & Africa Optical Lens for Mobile Phone Volume (K) Forecast, by Application 2020 & 2033
- Table 73: Global Optical Lens for Mobile Phone Revenue undefined Forecast, by Application 2020 & 2033
- Table 74: Global Optical Lens for Mobile Phone Volume K Forecast, by Application 2020 & 2033
- Table 75: Global Optical Lens for Mobile Phone Revenue undefined Forecast, by Types 2020 & 2033
- Table 76: Global Optical Lens for Mobile Phone Volume K Forecast, by Types 2020 & 2033
- Table 77: Global Optical Lens for Mobile Phone Revenue undefined Forecast, by Country 2020 & 2033
- Table 78: Global Optical Lens for Mobile Phone Volume K Forecast, by Country 2020 & 2033
- Table 79: China Optical Lens for Mobile Phone Revenue (undefined) Forecast, by Application 2020 & 2033
- Table 80: China Optical Lens for Mobile Phone Volume (K) Forecast, by Application 2020 & 2033
- Table 81: India Optical Lens for Mobile Phone Revenue (undefined) Forecast, by Application 2020 & 2033
- Table 82: India Optical Lens for Mobile Phone Volume (K) Forecast, by Application 2020 & 2033
- Table 83: Japan Optical Lens for Mobile Phone Revenue (undefined) Forecast, by Application 2020 & 2033
- Table 84: Japan Optical Lens for Mobile Phone Volume (K) Forecast, by Application 2020 & 2033
- Table 85: South Korea Optical Lens for Mobile Phone Revenue (undefined) Forecast, by Application 2020 & 2033
- Table 86: South Korea Optical Lens for Mobile Phone Volume (K) Forecast, by Application 2020 & 2033
- Table 87: ASEAN Optical Lens for Mobile Phone Revenue (undefined) Forecast, by Application 2020 & 2033
- Table 88: ASEAN Optical Lens for Mobile Phone Volume (K) Forecast, by Application 2020 & 2033
- Table 89: Oceania Optical Lens for Mobile Phone Revenue (undefined) Forecast, by Application 2020 & 2033
- Table 90: Oceania Optical Lens for Mobile Phone Volume (K) Forecast, by Application 2020 & 2033
- Table 91: Rest of Asia Pacific Optical Lens for Mobile Phone Revenue (undefined) Forecast, by Application 2020 & 2033
- Table 92: Rest of Asia Pacific Optical Lens for Mobile Phone Volume (K) Forecast, by Application 2020 & 2033
Frequently Asked Questions
1. What is the projected Compound Annual Growth Rate (CAGR) of the Optical Lens for Mobile Phone?
The projected CAGR is approximately 7.8%.
2. Which companies are prominent players in the Optical Lens for Mobile Phone?
Key companies in the market include SEKONIX, Kantatsu, Digital Optics, Largan Precision, Sunny Optical Technology, Genius Electronic Optical (GSEO), Asia Optical, AAC, Ofilm Group, NEWMAX, AOET, Lianchuang Electronic Technology.
3. What are the main segments of the Optical Lens for Mobile Phone?
The market segments include Application, Types.
4. Can you provide details about the market size?
The market size is estimated to be USD XXX N/A as of 2022.
5. What are some drivers contributing to market growth?
N/A
6. What are the notable trends driving market growth?
N/A
7. Are there any restraints impacting market growth?
N/A
8. Can you provide examples of recent developments in the market?
N/A
9. What pricing options are available for accessing the report?
Pricing options include single-user, multi-user, and enterprise licenses priced at USD 3350.00, USD 5025.00, and USD 6700.00 respectively.
10. Is the market size provided in terms of value or volume?
The market size is provided in terms of value, measured in N/A and volume, measured in K.
11. Are there any specific market keywords associated with the report?
Yes, the market keyword associated with the report is "Optical Lens for Mobile Phone," which aids in identifying and referencing the specific market segment covered.
12. How do I determine which pricing option suits my needs best?
The pricing options vary based on user requirements and access needs. Individual users may opt for single-user licenses, while businesses requiring broader access may choose multi-user or enterprise licenses for cost-effective access to the report.
13. Are there any additional resources or data provided in the Optical Lens for Mobile Phone report?
While the report offers comprehensive insights, it's advisable to review the specific contents or supplementary materials provided to ascertain if additional resources or data are available.
14. How can I stay updated on further developments or reports in the Optical Lens for Mobile Phone?
To stay informed about further developments, trends, and reports in the Optical Lens for Mobile Phone, consider subscribing to industry newsletters, following relevant companies and organizations, or regularly checking reputable industry news sources and publications.
Methodology
Step 1 - Identification of Relevant Samples Size from Population Database


Step 2 - Approaches for Defining Global Market Size (Value, Volume* & Price*)

Note*: In applicable scenarios
Step 3 - Data Sources
Primary Research
- Web Analytics
- Survey Reports
- Research Institute
- Latest Research Reports
- Opinion Leaders
Secondary Research
- Annual Reports
- White Paper
- Latest Press Release
- Industry Association
- Paid Database
- Investor Presentations

Step 4 - Data Triangulation
Involves using different sources of information in order to increase the validity of a study
These sources are likely to be stakeholders in a program - participants, other researchers, program staff, other community members, and so on.
Then we put all data in single framework & apply various statistical tools to find out the dynamic on the market.
During the analysis stage, feedback from the stakeholder groups would be compared to determine areas of agreement as well as areas of divergence