

Key Insights
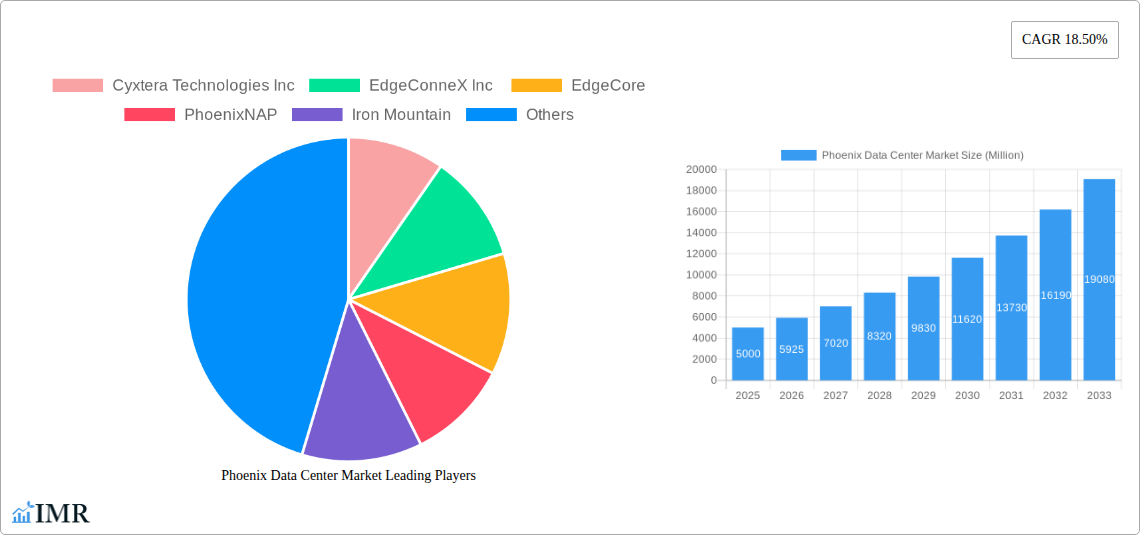
The Phoenix data center market is experiencing robust growth, fueled by increasing cloud adoption, the rise of big data analytics, and the expanding need for edge computing infrastructure. The market's Compound Annual Growth Rate (CAGR) of 18.50% from 2019 to 2024 suggests a significant expansion, and this momentum is expected to continue throughout the forecast period (2025-2033). Several factors contribute to this growth. The surge in demand for digital services across diverse sectors, including cloud & IT, telecom, media & entertainment, and BFSI (Banking, Financial Services, and Insurance), is driving the need for robust and scalable data center infrastructure in Phoenix. The city’s advantageous geographic location, favorable business climate, and access to skilled labor also contribute to its attractiveness as a data center hub. Furthermore, the market is segmented by data center size (small to mega), tier type, absorption rate (utilized vs. non-utilized), colocation type (retail, wholesale, hyperscale), and end-user industry. The hyperscale segment, driven by major cloud providers, is likely experiencing the most significant growth.
Key players such as Cyxtera Technologies, EdgeConneX, and Digital Realty Trust are actively investing in and expanding their Phoenix data center capacity to meet the surging demand. However, challenges remain. Land availability and rising energy costs could potentially constrain market growth. Furthermore, ensuring sufficient power supply and effective cooling solutions are critical factors that companies must address to maintain operational efficiency and meet sustainability standards. Despite these challenges, the long-term outlook for the Phoenix data center market remains positive, with continued growth expected as digital transformation continues to accelerate across industries. Competition among providers is intense, driving innovation and pushing down prices for certain segments, ultimately benefiting end-users.
Phoenix Data Center Market: A Comprehensive Market Report (2019-2033)
This comprehensive report provides a detailed analysis of the Phoenix data center market, encompassing market dynamics, growth trends, key players, and future outlook. With a study period spanning 2019-2033, a base year of 2025, and a forecast period of 2025-2033, this report is an invaluable resource for industry professionals seeking insights into this rapidly expanding sector. The report segments the market by DC size (Small, Medium, Large, Massive, Mega), Tier type (Tier 1, Tier 2, Tier 3, Tier 4), Absorption (Utilized, Non-Utilized), Colocation type (Retail, Wholesale, Hyperscale), and End User (Cloud & IT, Telecom, Media & Entertainment, Government, BFSI, Manufacturing, E-Commerce, Other End User). The total market size in 2025 is estimated to be xx Million.
Phoenix Data Center Market Dynamics & Structure
The Phoenix data center market is characterized by a moderately concentrated landscape with several large players vying for market share. Technological innovation, particularly in areas like AI and 5G, is a key driver, demanding increased capacity and advanced infrastructure. Favorable regulatory frameworks in Arizona, coupled with tax incentives, further stimulate growth. The market sees competition from alternative solutions like cloud computing, but data centers remain crucial for many applications needing low latency and high security. Mergers and acquisitions (M&A) activity is significant, with larger players consolidating their market position. Recent M&A deals, estimated at xx Million in value during 2024, have contributed to increased market consolidation.
- Market Concentration: Moderately concentrated, with the top 5 players holding approximately xx% market share in 2024.
- Technological Innovation: Driven by advancements in AI, 5G, and edge computing, necessitating higher-capacity and more sophisticated data center infrastructure.
- Regulatory Framework: Favorable regulatory environment and tax incentives in Arizona stimulate investment.
- Competitive Substitutes: Cloud computing presents competition, but on-premise data centers remain essential for specific applications.
- End-User Demographics: Significant demand from Cloud & IT, followed by Telecom and Media & Entertainment sectors.
- M&A Trends: Increasing M&A activity points towards market consolidation and expansion by major players.
Phoenix Data Center Market Growth Trends & Insights
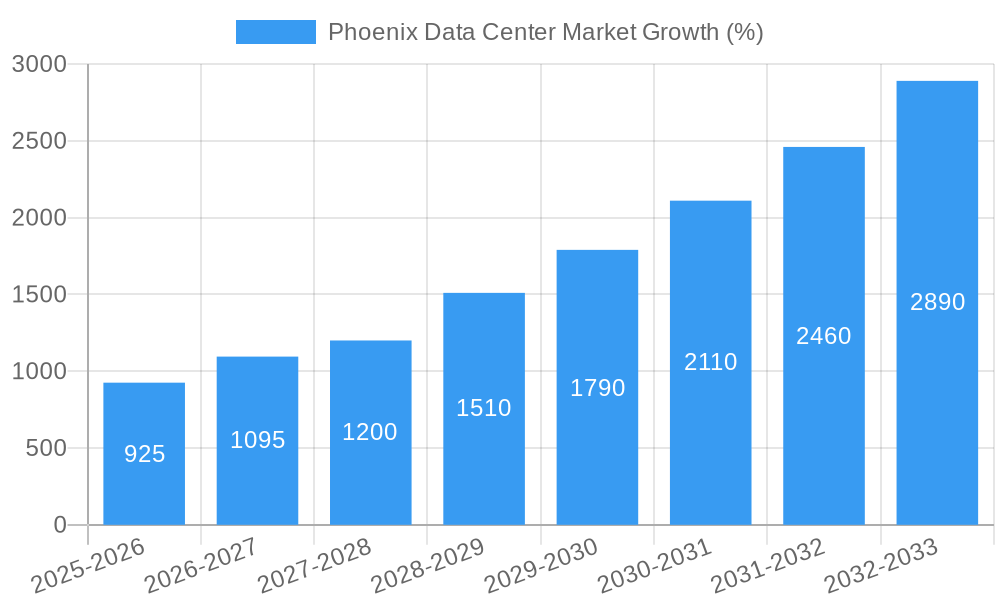
The Phoenix data center market is experiencing robust growth, driven by the region's burgeoning technology sector and favorable business environment. The market size has witnessed a Compound Annual Growth Rate (CAGR) of xx% during the historical period (2019-2024), reaching xx Million in 2024. This growth is expected to continue during the forecast period (2025-2033), with a projected CAGR of xx%, reaching xx Million by 2033. This expansion is fueled by the increasing adoption of cloud computing, the rise of big data analytics, and the growing demand for low-latency applications. Consumer behavior shifts towards digital services further accelerates the demand for data center capacity. Technological disruptions, like the adoption of hyperscale data centers, are shaping the market landscape. Market penetration of utilized capacity is approximately xx% in 2025, expected to increase to xx% by 2033.
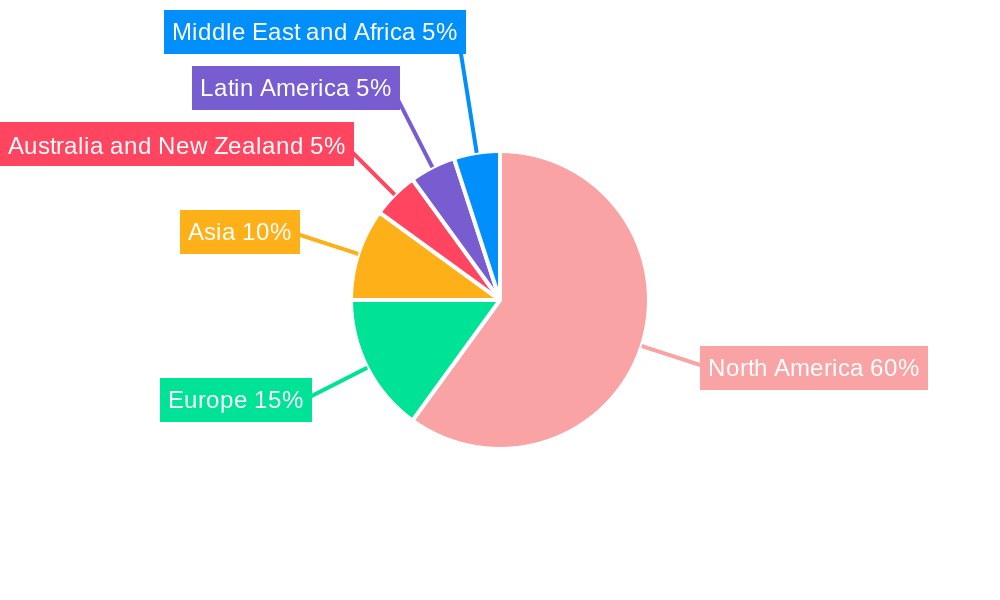
Dominant Regions, Countries, or Segments in Phoenix Data Center Market
The Phoenix metropolitan area is the dominant region within the Arizona data center market. Within the market segmentation, the Large and Mega data center size categories are showing the fastest growth, driven by hyperscale deployments. The Utilized absorption segment dominates, highlighting high demand. Retail colocation accounts for a significant portion of the market, while hyperscale is experiencing rapid growth. The Cloud & IT sector is the leading end-user, followed by Telecom and Media & Entertainment.
- Key Drivers:
- Robust economic growth in Phoenix.
- Favorable government policies and tax incentives.
- Abundant renewable energy resources.
- Strong fiber optic infrastructure.
- Dominance Factors:
- High demand from major technology companies.
- Strategic location with access to major transportation routes.
- Availability of land and power resources.
Phoenix Data Center Market Product Landscape
The Phoenix data center market offers a range of products and services, from basic colocation space to highly customized, fully managed solutions. Innovations focus on increased efficiency, sustainability, and resilience. Products often incorporate advanced features like advanced cooling systems, high-density power infrastructure, and robust security measures. Unique selling propositions include guaranteed uptime, flexible capacity options, and specialized services catering to specific industry needs. Technological advancements in automation and AI are further enhancing efficiency and reliability.
Key Drivers, Barriers & Challenges in Phoenix Data Center Market
Key Drivers: Strong economic growth in Arizona, increasing demand for cloud services, and government incentives are key drivers. The growing adoption of AI and 5G also fuels the demand for advanced data center infrastructure.
Key Challenges: Limited land availability and the rising cost of energy pose significant challenges. Competition from other data center hubs and the need to address sustainability concerns are additional factors impacting market growth. Supply chain disruptions, particularly in securing critical components, can lead to project delays and cost overruns. Regulatory hurdles could also create barriers. Increased competition could reduce profit margins.
Emerging Opportunities in Phoenix Data Center Market
Emerging opportunities lie in providing specialized services catering to specific industry needs, such as edge computing and AI/ML deployments. Expansion into untapped markets, like the growing manufacturing and BFSI sectors, presents significant potential. The adoption of sustainable practices and renewable energy sources offers a unique opportunity for differentiation and competitive advantage.
Growth Accelerators in the Phoenix Data Center Market Industry
Long-term growth will be accelerated by continued technological advancements in areas like AI and edge computing, driving demand for more sophisticated data center infrastructure. Strategic partnerships between data center providers and cloud service providers will fuel further market expansion. Furthermore, the focus on sustainability and environmentally friendly solutions presents a significant growth catalyst.
Key Players Shaping the Phoenix Data Center Market Market
- Cyxtera Technologies Inc
- EdgeConneX Inc
- EdgeCore
- PhoenixNAP
- Iron Mountain
- DataBank
- Evocative
- CyrusOne
- Expedient
- Flexential
- Cogent
- Evoque
- Vantage Data Center
- H5 Data centers
- Digital Realty Trust Inc
Notable Milestones in Phoenix Data Center Market Sector
- November 2022: STACK Infrastructure announces plans for a massive new 230-megawatt data center campus in downtown Phoenix, totaling 1.78 million square feet.
- October 2022: Aligned Data Centers acquires two additional plots of land in Phoenix, expanding its sustainable mega campus.
In-Depth Phoenix Data Center Market Market Outlook
The Phoenix data center market is poised for continued robust growth, driven by the aforementioned factors. Strategic investments in infrastructure, coupled with a focus on sustainability and innovation, will be crucial for success. The market presents significant opportunities for data center providers to capitalize on the increasing demand for cloud services, AI, and other emerging technologies. The focus on long-term partnerships and sustainable practices will be key differentiators in this competitive market.
Phoenix Data Center Market Segmentation
-
1. DC Size
- 1.1. Small
- 1.2. Medium
- 1.3. Large
- 1.4. Massive
- 1.5. Mega
-
2. Tier Type
- 2.1. Tier 1 & 2
- 2.2. Tier 3
- 2.3. Tier 4
-
3. Absorption
-
3.1. Utilized
-
3.1.1. By Colocation Type
- 3.1.1.1. Retail
- 3.1.1.2. Wholesale
- 3.1.1.3. Hyperscale
-
3.1.2. By End User
- 3.1.2.1. Cloud & IT
- 3.1.2.2. Telecom
- 3.1.2.3. Media & Entertainment
- 3.1.2.4. Government
- 3.1.2.5. BFSI
- 3.1.2.6. Manufacturing
- 3.1.2.7. E-Commerce
- 3.1.2.8. Other End User
-
3.1.1. By Colocation Type
- 3.2. Non-Utilized
-
3.1. Utilized
Phoenix Data Center Market Segmentation By Geography
-
1. North America
- 1.1. United States
- 1.2. Canada
- 1.3. Mexico
-
2. South America
- 2.1. Brazil
- 2.2. Argentina
- 2.3. Rest of South America
-
3. Europe
- 3.1. United Kingdom
- 3.2. Germany
- 3.3. France
- 3.4. Italy
- 3.5. Spain
- 3.6. Russia
- 3.7. Benelux
- 3.8. Nordics
- 3.9. Rest of Europe
-
4. Middle East & Africa
- 4.1. Turkey
- 4.2. Israel
- 4.3. GCC
- 4.4. North Africa
- 4.5. South Africa
- 4.6. Rest of Middle East & Africa
-
5. Asia Pacific
- 5.1. China
- 5.2. India
- 5.3. Japan
- 5.4. South Korea
- 5.5. ASEAN
- 5.6. Oceania
- 5.7. Rest of Asia Pacific
Phoenix Data Center Market REPORT HIGHLIGHTS
| Aspects | Details |
|---|---|
| Study Period | 2019-2033 |
| Base Year | 2024 |
| Estimated Year | 2025 |
| Forecast Period | 2025-2033 |
| Historical Period | 2019-2024 |
| Growth Rate | CAGR of 18.50% from 2019-2033 |
| Segmentation |
|
Table of Contents
- 1. Introduction
- 1.1. Research Scope
- 1.2. Market Segmentation
- 1.3. Research Methodology
- 1.4. Definitions and Assumptions
- 2. Executive Summary
- 2.1. Introduction
- 3. Market Dynamics
- 3.1. Introduction
- 3.2. Market Drivers
- 3.2.1. Growing Adoption of Cloud Services is expected to flourish the market; Increasing Growth in Wholesale Datacenter Multi-tenant Spaces to propel demand (albeit from a lower base); Increased Emphasis on Compliance with Data Regulations and Cost-Effective Nature of Multi-tenant Facilities to Drive Adoption among SME's
- 3.3. Market Restrains
- 3.3.1. Dependence on Regulatory Landscape & Stringent Security Requirements
- 3.4. Market Trends
- 3.4.1. Cloud computing is anticipated to hold a significant share
- 4. Market Factor Analysis
- 4.1. Porters Five Forces
- 4.2. Supply/Value Chain
- 4.3. PESTEL analysis
- 4.4. Market Entropy
- 4.5. Patent/Trademark Analysis
- 5. Global Phoenix Data Center Market Analysis, Insights and Forecast, 2019-2031
- 5.1. Market Analysis, Insights and Forecast - by DC Size
- 5.1.1. Small
- 5.1.2. Medium
- 5.1.3. Large
- 5.1.4. Massive
- 5.1.5. Mega
- 5.2. Market Analysis, Insights and Forecast - by Tier Type
- 5.2.1. Tier 1 & 2
- 5.2.2. Tier 3
- 5.2.3. Tier 4
- 5.3. Market Analysis, Insights and Forecast - by Absorption
- 5.3.1. Utilized
- 5.3.1.1. By Colocation Type
- 5.3.1.1.1. Retail
- 5.3.1.1.2. Wholesale
- 5.3.1.1.3. Hyperscale
- 5.3.1.2. By End User
- 5.3.1.2.1. Cloud & IT
- 5.3.1.2.2. Telecom
- 5.3.1.2.3. Media & Entertainment
- 5.3.1.2.4. Government
- 5.3.1.2.5. BFSI
- 5.3.1.2.6. Manufacturing
- 5.3.1.2.7. E-Commerce
- 5.3.1.2.8. Other End User
- 5.3.1.1. By Colocation Type
- 5.3.2. Non-Utilized
- 5.3.1. Utilized
- 5.4. Market Analysis, Insights and Forecast - by Region
- 5.4.1. North America
- 5.4.2. South America
- 5.4.3. Europe
- 5.4.4. Middle East & Africa
- 5.4.5. Asia Pacific
- 5.1. Market Analysis, Insights and Forecast - by DC Size
- 6. North America Phoenix Data Center Market Analysis, Insights and Forecast, 2019-2031
- 6.1. Market Analysis, Insights and Forecast - by DC Size
- 6.1.1. Small
- 6.1.2. Medium
- 6.1.3. Large
- 6.1.4. Massive
- 6.1.5. Mega
- 6.2. Market Analysis, Insights and Forecast - by Tier Type
- 6.2.1. Tier 1 & 2
- 6.2.2. Tier 3
- 6.2.3. Tier 4
- 6.3. Market Analysis, Insights and Forecast - by Absorption
- 6.3.1. Utilized
- 6.3.1.1. By Colocation Type
- 6.3.1.1.1. Retail
- 6.3.1.1.2. Wholesale
- 6.3.1.1.3. Hyperscale
- 6.3.1.2. By End User
- 6.3.1.2.1. Cloud & IT
- 6.3.1.2.2. Telecom
- 6.3.1.2.3. Media & Entertainment
- 6.3.1.2.4. Government
- 6.3.1.2.5. BFSI
- 6.3.1.2.6. Manufacturing
- 6.3.1.2.7. E-Commerce
- 6.3.1.2.8. Other End User
- 6.3.1.1. By Colocation Type
- 6.3.2. Non-Utilized
- 6.3.1. Utilized
- 6.1. Market Analysis, Insights and Forecast - by DC Size
- 7. South America Phoenix Data Center Market Analysis, Insights and Forecast, 2019-2031
- 7.1. Market Analysis, Insights and Forecast - by DC Size
- 7.1.1. Small
- 7.1.2. Medium
- 7.1.3. Large
- 7.1.4. Massive
- 7.1.5. Mega
- 7.2. Market Analysis, Insights and Forecast - by Tier Type
- 7.2.1. Tier 1 & 2
- 7.2.2. Tier 3
- 7.2.3. Tier 4
- 7.3. Market Analysis, Insights and Forecast - by Absorption
- 7.3.1. Utilized
- 7.3.1.1. By Colocation Type
- 7.3.1.1.1. Retail
- 7.3.1.1.2. Wholesale
- 7.3.1.1.3. Hyperscale
- 7.3.1.2. By End User
- 7.3.1.2.1. Cloud & IT
- 7.3.1.2.2. Telecom
- 7.3.1.2.3. Media & Entertainment
- 7.3.1.2.4. Government
- 7.3.1.2.5. BFSI
- 7.3.1.2.6. Manufacturing
- 7.3.1.2.7. E-Commerce
- 7.3.1.2.8. Other End User
- 7.3.1.1. By Colocation Type
- 7.3.2. Non-Utilized
- 7.3.1. Utilized
- 7.1. Market Analysis, Insights and Forecast - by DC Size
- 8. Europe Phoenix Data Center Market Analysis, Insights and Forecast, 2019-2031
- 8.1. Market Analysis, Insights and Forecast - by DC Size
- 8.1.1. Small
- 8.1.2. Medium
- 8.1.3. Large
- 8.1.4. Massive
- 8.1.5. Mega
- 8.2. Market Analysis, Insights and Forecast - by Tier Type
- 8.2.1. Tier 1 & 2
- 8.2.2. Tier 3
- 8.2.3. Tier 4
- 8.3. Market Analysis, Insights and Forecast - by Absorption
- 8.3.1. Utilized
- 8.3.1.1. By Colocation Type
- 8.3.1.1.1. Retail
- 8.3.1.1.2. Wholesale
- 8.3.1.1.3. Hyperscale
- 8.3.1.2. By End User
- 8.3.1.2.1. Cloud & IT
- 8.3.1.2.2. Telecom
- 8.3.1.2.3. Media & Entertainment
- 8.3.1.2.4. Government
- 8.3.1.2.5. BFSI
- 8.3.1.2.6. Manufacturing
- 8.3.1.2.7. E-Commerce
- 8.3.1.2.8. Other End User
- 8.3.1.1. By Colocation Type
- 8.3.2. Non-Utilized
- 8.3.1. Utilized
- 8.1. Market Analysis, Insights and Forecast - by DC Size
- 9. Middle East & Africa Phoenix Data Center Market Analysis, Insights and Forecast, 2019-2031
- 9.1. Market Analysis, Insights and Forecast - by DC Size
- 9.1.1. Small
- 9.1.2. Medium
- 9.1.3. Large
- 9.1.4. Massive
- 9.1.5. Mega
- 9.2. Market Analysis, Insights and Forecast - by Tier Type
- 9.2.1. Tier 1 & 2
- 9.2.2. Tier 3
- 9.2.3. Tier 4
- 9.3. Market Analysis, Insights and Forecast - by Absorption
- 9.3.1. Utilized
- 9.3.1.1. By Colocation Type
- 9.3.1.1.1. Retail
- 9.3.1.1.2. Wholesale
- 9.3.1.1.3. Hyperscale
- 9.3.1.2. By End User
- 9.3.1.2.1. Cloud & IT
- 9.3.1.2.2. Telecom
- 9.3.1.2.3. Media & Entertainment
- 9.3.1.2.4. Government
- 9.3.1.2.5. BFSI
- 9.3.1.2.6. Manufacturing
- 9.3.1.2.7. E-Commerce
- 9.3.1.2.8. Other End User
- 9.3.1.1. By Colocation Type
- 9.3.2. Non-Utilized
- 9.3.1. Utilized
- 9.1. Market Analysis, Insights and Forecast - by DC Size
- 10. Asia Pacific Phoenix Data Center Market Analysis, Insights and Forecast, 2019-2031
- 10.1. Market Analysis, Insights and Forecast - by DC Size
- 10.1.1. Small
- 10.1.2. Medium
- 10.1.3. Large
- 10.1.4. Massive
- 10.1.5. Mega
- 10.2. Market Analysis, Insights and Forecast - by Tier Type
- 10.2.1. Tier 1 & 2
- 10.2.2. Tier 3
- 10.2.3. Tier 4
- 10.3. Market Analysis, Insights and Forecast - by Absorption
- 10.3.1. Utilized
- 10.3.1.1. By Colocation Type
- 10.3.1.1.1. Retail
- 10.3.1.1.2. Wholesale
- 10.3.1.1.3. Hyperscale
- 10.3.1.2. By End User
- 10.3.1.2.1. Cloud & IT
- 10.3.1.2.2. Telecom
- 10.3.1.2.3. Media & Entertainment
- 10.3.1.2.4. Government
- 10.3.1.2.5. BFSI
- 10.3.1.2.6. Manufacturing
- 10.3.1.2.7. E-Commerce
- 10.3.1.2.8. Other End User
- 10.3.1.1. By Colocation Type
- 10.3.2. Non-Utilized
- 10.3.1. Utilized
- 10.1. Market Analysis, Insights and Forecast - by DC Size
- 11. North America Phoenix Data Center Market Analysis, Insights and Forecast, 2019-2031
- 11.1. Market Analysis, Insights and Forecast - By Country/Sub-region
- 11.1.1.
- 12. Europe Phoenix Data Center Market Analysis, Insights and Forecast, 2019-2031
- 12.1. Market Analysis, Insights and Forecast - By Country/Sub-region
- 12.1.1.
- 13. Asia Phoenix Data Center Market Analysis, Insights and Forecast, 2019-2031
- 13.1. Market Analysis, Insights and Forecast - By Country/Sub-region
- 13.1.1.
- 14. Australia and New Zealand Phoenix Data Center Market Analysis, Insights and Forecast, 2019-2031
- 14.1. Market Analysis, Insights and Forecast - By Country/Sub-region
- 14.1.1.
- 15. Latin America Phoenix Data Center Market Analysis, Insights and Forecast, 2019-2031
- 15.1. Market Analysis, Insights and Forecast - By Country/Sub-region
- 15.1.1.
- 16. Middle East and Africa Phoenix Data Center Market Analysis, Insights and Forecast, 2019-2031
- 16.1. Market Analysis, Insights and Forecast - By Country/Sub-region
- 16.1.1.
- 17. Competitive Analysis
- 17.1. Global Market Share Analysis 2024
- 17.2. Company Profiles
- 17.2.1 Cyxtera Technologies Inc
- 17.2.1.1. Overview
- 17.2.1.2. Products
- 17.2.1.3. SWOT Analysis
- 17.2.1.4. Recent Developments
- 17.2.1.5. Financials (Based on Availability)
- 17.2.2 EdgeConneX Inc
- 17.2.2.1. Overview
- 17.2.2.2. Products
- 17.2.2.3. SWOT Analysis
- 17.2.2.4. Recent Developments
- 17.2.2.5. Financials (Based on Availability)
- 17.2.3 EdgeCore
- 17.2.3.1. Overview
- 17.2.3.2. Products
- 17.2.3.3. SWOT Analysis
- 17.2.3.4. Recent Developments
- 17.2.3.5. Financials (Based on Availability)
- 17.2.4 PhoenixNAP
- 17.2.4.1. Overview
- 17.2.4.2. Products
- 17.2.4.3. SWOT Analysis
- 17.2.4.4. Recent Developments
- 17.2.4.5. Financials (Based on Availability)
- 17.2.5 Iron Mountain
- 17.2.5.1. Overview
- 17.2.5.2. Products
- 17.2.5.3. SWOT Analysis
- 17.2.5.4. Recent Developments
- 17.2.5.5. Financials (Based on Availability)
- 17.2.6 DataBank
- 17.2.6.1. Overview
- 17.2.6.2. Products
- 17.2.6.3. SWOT Analysis
- 17.2.6.4. Recent Developments
- 17.2.6.5. Financials (Based on Availability)
- 17.2.7 Evocative
- 17.2.7.1. Overview
- 17.2.7.2. Products
- 17.2.7.3. SWOT Analysis
- 17.2.7.4. Recent Developments
- 17.2.7.5. Financials (Based on Availability)
- 17.2.8 CyrusOne
- 17.2.8.1. Overview
- 17.2.8.2. Products
- 17.2.8.3. SWOT Analysis
- 17.2.8.4. Recent Developments
- 17.2.8.5. Financials (Based on Availability)
- 17.2.9 Expedient
- 17.2.9.1. Overview
- 17.2.9.2. Products
- 17.2.9.3. SWOT Analysis
- 17.2.9.4. Recent Developments
- 17.2.9.5. Financials (Based on Availability)
- 17.2.10 Flexential
- 17.2.10.1. Overview
- 17.2.10.2. Products
- 17.2.10.3. SWOT Analysis
- 17.2.10.4. Recent Developments
- 17.2.10.5. Financials (Based on Availability)
- 17.2.11 Cogent
- 17.2.11.1. Overview
- 17.2.11.2. Products
- 17.2.11.3. SWOT Analysis
- 17.2.11.4. Recent Developments
- 17.2.11.5. Financials (Based on Availability)
- 17.2.12 Evoque
- 17.2.12.1. Overview
- 17.2.12.2. Products
- 17.2.12.3. SWOT Analysis
- 17.2.12.4. Recent Developments
- 17.2.12.5. Financials (Based on Availability)
- 17.2.13 Vantage Data Center
- 17.2.13.1. Overview
- 17.2.13.2. Products
- 17.2.13.3. SWOT Analysis
- 17.2.13.4. Recent Developments
- 17.2.13.5. Financials (Based on Availability)
- 17.2.14 H5 Data centers
- 17.2.14.1. Overview
- 17.2.14.2. Products
- 17.2.14.3. SWOT Analysis
- 17.2.14.4. Recent Developments
- 17.2.14.5. Financials (Based on Availability)
- 17.2.15 Digital Realty Trust Inc
- 17.2.15.1. Overview
- 17.2.15.2. Products
- 17.2.15.3. SWOT Analysis
- 17.2.15.4. Recent Developments
- 17.2.15.5. Financials (Based on Availability)
- 17.2.1 Cyxtera Technologies Inc
List of Figures
- Figure 1: Global Phoenix Data Center Market Revenue Breakdown (Million, %) by Region 2024 & 2032
- Figure 2: North America Phoenix Data Center Market Revenue (Million), by Country 2024 & 2032
- Figure 3: North America Phoenix Data Center Market Revenue Share (%), by Country 2024 & 2032
- Figure 4: Europe Phoenix Data Center Market Revenue (Million), by Country 2024 & 2032
- Figure 5: Europe Phoenix Data Center Market Revenue Share (%), by Country 2024 & 2032
- Figure 6: Asia Phoenix Data Center Market Revenue (Million), by Country 2024 & 2032
- Figure 7: Asia Phoenix Data Center Market Revenue Share (%), by Country 2024 & 2032
- Figure 8: Australia and New Zealand Phoenix Data Center Market Revenue (Million), by Country 2024 & 2032
- Figure 9: Australia and New Zealand Phoenix Data Center Market Revenue Share (%), by Country 2024 & 2032
- Figure 10: Latin America Phoenix Data Center Market Revenue (Million), by Country 2024 & 2032
- Figure 11: Latin America Phoenix Data Center Market Revenue Share (%), by Country 2024 & 2032
- Figure 12: Middle East and Africa Phoenix Data Center Market Revenue (Million), by Country 2024 & 2032
- Figure 13: Middle East and Africa Phoenix Data Center Market Revenue Share (%), by Country 2024 & 2032
- Figure 14: North America Phoenix Data Center Market Revenue (Million), by DC Size 2024 & 2032
- Figure 15: North America Phoenix Data Center Market Revenue Share (%), by DC Size 2024 & 2032
- Figure 16: North America Phoenix Data Center Market Revenue (Million), by Tier Type 2024 & 2032
- Figure 17: North America Phoenix Data Center Market Revenue Share (%), by Tier Type 2024 & 2032
- Figure 18: North America Phoenix Data Center Market Revenue (Million), by Absorption 2024 & 2032
- Figure 19: North America Phoenix Data Center Market Revenue Share (%), by Absorption 2024 & 2032
- Figure 20: North America Phoenix Data Center Market Revenue (Million), by Country 2024 & 2032
- Figure 21: North America Phoenix Data Center Market Revenue Share (%), by Country 2024 & 2032
- Figure 22: South America Phoenix Data Center Market Revenue (Million), by DC Size 2024 & 2032
- Figure 23: South America Phoenix Data Center Market Revenue Share (%), by DC Size 2024 & 2032
- Figure 24: South America Phoenix Data Center Market Revenue (Million), by Tier Type 2024 & 2032
- Figure 25: South America Phoenix Data Center Market Revenue Share (%), by Tier Type 2024 & 2032
- Figure 26: South America Phoenix Data Center Market Revenue (Million), by Absorption 2024 & 2032
- Figure 27: South America Phoenix Data Center Market Revenue Share (%), by Absorption 2024 & 2032
- Figure 28: South America Phoenix Data Center Market Revenue (Million), by Country 2024 & 2032
- Figure 29: South America Phoenix Data Center Market Revenue Share (%), by Country 2024 & 2032
- Figure 30: Europe Phoenix Data Center Market Revenue (Million), by DC Size 2024 & 2032
- Figure 31: Europe Phoenix Data Center Market Revenue Share (%), by DC Size 2024 & 2032
- Figure 32: Europe Phoenix Data Center Market Revenue (Million), by Tier Type 2024 & 2032
- Figure 33: Europe Phoenix Data Center Market Revenue Share (%), by Tier Type 2024 & 2032
- Figure 34: Europe Phoenix Data Center Market Revenue (Million), by Absorption 2024 & 2032
- Figure 35: Europe Phoenix Data Center Market Revenue Share (%), by Absorption 2024 & 2032
- Figure 36: Europe Phoenix Data Center Market Revenue (Million), by Country 2024 & 2032
- Figure 37: Europe Phoenix Data Center Market Revenue Share (%), by Country 2024 & 2032
- Figure 38: Middle East & Africa Phoenix Data Center Market Revenue (Million), by DC Size 2024 & 2032
- Figure 39: Middle East & Africa Phoenix Data Center Market Revenue Share (%), by DC Size 2024 & 2032
- Figure 40: Middle East & Africa Phoenix Data Center Market Revenue (Million), by Tier Type 2024 & 2032
- Figure 41: Middle East & Africa Phoenix Data Center Market Revenue Share (%), by Tier Type 2024 & 2032
- Figure 42: Middle East & Africa Phoenix Data Center Market Revenue (Million), by Absorption 2024 & 2032
- Figure 43: Middle East & Africa Phoenix Data Center Market Revenue Share (%), by Absorption 2024 & 2032
- Figure 44: Middle East & Africa Phoenix Data Center Market Revenue (Million), by Country 2024 & 2032
- Figure 45: Middle East & Africa Phoenix Data Center Market Revenue Share (%), by Country 2024 & 2032
- Figure 46: Asia Pacific Phoenix Data Center Market Revenue (Million), by DC Size 2024 & 2032
- Figure 47: Asia Pacific Phoenix Data Center Market Revenue Share (%), by DC Size 2024 & 2032
- Figure 48: Asia Pacific Phoenix Data Center Market Revenue (Million), by Tier Type 2024 & 2032
- Figure 49: Asia Pacific Phoenix Data Center Market Revenue Share (%), by Tier Type 2024 & 2032
- Figure 50: Asia Pacific Phoenix Data Center Market Revenue (Million), by Absorption 2024 & 2032
- Figure 51: Asia Pacific Phoenix Data Center Market Revenue Share (%), by Absorption 2024 & 2032
- Figure 52: Asia Pacific Phoenix Data Center Market Revenue (Million), by Country 2024 & 2032
- Figure 53: Asia Pacific Phoenix Data Center Market Revenue Share (%), by Country 2024 & 2032
List of Tables
- Table 1: Global Phoenix Data Center Market Revenue Million Forecast, by Region 2019 & 2032
- Table 2: Global Phoenix Data Center Market Revenue Million Forecast, by DC Size 2019 & 2032
- Table 3: Global Phoenix Data Center Market Revenue Million Forecast, by Tier Type 2019 & 2032
- Table 4: Global Phoenix Data Center Market Revenue Million Forecast, by Absorption 2019 & 2032
- Table 5: Global Phoenix Data Center Market Revenue Million Forecast, by Region 2019 & 2032
- Table 6: Global Phoenix Data Center Market Revenue Million Forecast, by Country 2019 & 2032
- Table 7: Phoenix Data Center Market Revenue (Million) Forecast, by Application 2019 & 2032
- Table 8: Global Phoenix Data Center Market Revenue Million Forecast, by Country 2019 & 2032
- Table 9: Phoenix Data Center Market Revenue (Million) Forecast, by Application 2019 & 2032
- Table 10: Global Phoenix Data Center Market Revenue Million Forecast, by Country 2019 & 2032
- Table 11: Phoenix Data Center Market Revenue (Million) Forecast, by Application 2019 & 2032
- Table 12: Global Phoenix Data Center Market Revenue Million Forecast, by Country 2019 & 2032
- Table 13: Phoenix Data Center Market Revenue (Million) Forecast, by Application 2019 & 2032
- Table 14: Global Phoenix Data Center Market Revenue Million Forecast, by Country 2019 & 2032
- Table 15: Phoenix Data Center Market Revenue (Million) Forecast, by Application 2019 & 2032
- Table 16: Global Phoenix Data Center Market Revenue Million Forecast, by Country 2019 & 2032
- Table 17: Phoenix Data Center Market Revenue (Million) Forecast, by Application 2019 & 2032
- Table 18: Global Phoenix Data Center Market Revenue Million Forecast, by DC Size 2019 & 2032
- Table 19: Global Phoenix Data Center Market Revenue Million Forecast, by Tier Type 2019 & 2032
- Table 20: Global Phoenix Data Center Market Revenue Million Forecast, by Absorption 2019 & 2032
- Table 21: Global Phoenix Data Center Market Revenue Million Forecast, by Country 2019 & 2032
- Table 22: United States Phoenix Data Center Market Revenue (Million) Forecast, by Application 2019 & 2032
- Table 23: Canada Phoenix Data Center Market Revenue (Million) Forecast, by Application 2019 & 2032
- Table 24: Mexico Phoenix Data Center Market Revenue (Million) Forecast, by Application 2019 & 2032
- Table 25: Global Phoenix Data Center Market Revenue Million Forecast, by DC Size 2019 & 2032
- Table 26: Global Phoenix Data Center Market Revenue Million Forecast, by Tier Type 2019 & 2032
- Table 27: Global Phoenix Data Center Market Revenue Million Forecast, by Absorption 2019 & 2032
- Table 28: Global Phoenix Data Center Market Revenue Million Forecast, by Country 2019 & 2032
- Table 29: Brazil Phoenix Data Center Market Revenue (Million) Forecast, by Application 2019 & 2032
- Table 30: Argentina Phoenix Data Center Market Revenue (Million) Forecast, by Application 2019 & 2032
- Table 31: Rest of South America Phoenix Data Center Market Revenue (Million) Forecast, by Application 2019 & 2032
- Table 32: Global Phoenix Data Center Market Revenue Million Forecast, by DC Size 2019 & 2032
- Table 33: Global Phoenix Data Center Market Revenue Million Forecast, by Tier Type 2019 & 2032
- Table 34: Global Phoenix Data Center Market Revenue Million Forecast, by Absorption 2019 & 2032
- Table 35: Global Phoenix Data Center Market Revenue Million Forecast, by Country 2019 & 2032
- Table 36: United Kingdom Phoenix Data Center Market Revenue (Million) Forecast, by Application 2019 & 2032
- Table 37: Germany Phoenix Data Center Market Revenue (Million) Forecast, by Application 2019 & 2032
- Table 38: France Phoenix Data Center Market Revenue (Million) Forecast, by Application 2019 & 2032
- Table 39: Italy Phoenix Data Center Market Revenue (Million) Forecast, by Application 2019 & 2032
- Table 40: Spain Phoenix Data Center Market Revenue (Million) Forecast, by Application 2019 & 2032
- Table 41: Russia Phoenix Data Center Market Revenue (Million) Forecast, by Application 2019 & 2032
- Table 42: Benelux Phoenix Data Center Market Revenue (Million) Forecast, by Application 2019 & 2032
- Table 43: Nordics Phoenix Data Center Market Revenue (Million) Forecast, by Application 2019 & 2032
- Table 44: Rest of Europe Phoenix Data Center Market Revenue (Million) Forecast, by Application 2019 & 2032
- Table 45: Global Phoenix Data Center Market Revenue Million Forecast, by DC Size 2019 & 2032
- Table 46: Global Phoenix Data Center Market Revenue Million Forecast, by Tier Type 2019 & 2032
- Table 47: Global Phoenix Data Center Market Revenue Million Forecast, by Absorption 2019 & 2032
- Table 48: Global Phoenix Data Center Market Revenue Million Forecast, by Country 2019 & 2032
- Table 49: Turkey Phoenix Data Center Market Revenue (Million) Forecast, by Application 2019 & 2032
- Table 50: Israel Phoenix Data Center Market Revenue (Million) Forecast, by Application 2019 & 2032
- Table 51: GCC Phoenix Data Center Market Revenue (Million) Forecast, by Application 2019 & 2032
- Table 52: North Africa Phoenix Data Center Market Revenue (Million) Forecast, by Application 2019 & 2032
- Table 53: South Africa Phoenix Data Center Market Revenue (Million) Forecast, by Application 2019 & 2032
- Table 54: Rest of Middle East & Africa Phoenix Data Center Market Revenue (Million) Forecast, by Application 2019 & 2032
- Table 55: Global Phoenix Data Center Market Revenue Million Forecast, by DC Size 2019 & 2032
- Table 56: Global Phoenix Data Center Market Revenue Million Forecast, by Tier Type 2019 & 2032
- Table 57: Global Phoenix Data Center Market Revenue Million Forecast, by Absorption 2019 & 2032
- Table 58: Global Phoenix Data Center Market Revenue Million Forecast, by Country 2019 & 2032
- Table 59: China Phoenix Data Center Market Revenue (Million) Forecast, by Application 2019 & 2032
- Table 60: India Phoenix Data Center Market Revenue (Million) Forecast, by Application 2019 & 2032
- Table 61: Japan Phoenix Data Center Market Revenue (Million) Forecast, by Application 2019 & 2032
- Table 62: South Korea Phoenix Data Center Market Revenue (Million) Forecast, by Application 2019 & 2032
- Table 63: ASEAN Phoenix Data Center Market Revenue (Million) Forecast, by Application 2019 & 2032
- Table 64: Oceania Phoenix Data Center Market Revenue (Million) Forecast, by Application 2019 & 2032
- Table 65: Rest of Asia Pacific Phoenix Data Center Market Revenue (Million) Forecast, by Application 2019 & 2032
Frequently Asked Questions
1. What is the projected Compound Annual Growth Rate (CAGR) of the Phoenix Data Center Market?
The projected CAGR is approximately 18.50%.
2. Which companies are prominent players in the Phoenix Data Center Market?
Key companies in the market include Cyxtera Technologies Inc, EdgeConneX Inc , EdgeCore, PhoenixNAP, Iron Mountain, DataBank, Evocative, CyrusOne, Expedient, Flexential, Cogent, Evoque, Vantage Data Center, H5 Data centers, Digital Realty Trust Inc.
3. What are the main segments of the Phoenix Data Center Market?
The market segments include DC Size, Tier Type, Absorption.
4. Can you provide details about the market size?
The market size is estimated to be USD XX Million as of 2022.
5. What are some drivers contributing to market growth?
Growing Adoption of Cloud Services is expected to flourish the market; Increasing Growth in Wholesale Datacenter Multi-tenant Spaces to propel demand (albeit from a lower base); Increased Emphasis on Compliance with Data Regulations and Cost-Effective Nature of Multi-tenant Facilities to Drive Adoption among SME's.
6. What are the notable trends driving market growth?
Cloud computing is anticipated to hold a significant share.
7. Are there any restraints impacting market growth?
Dependence on Regulatory Landscape & Stringent Security Requirements.
8. Can you provide examples of recent developments in the market?
November 2022: STACK Infrastructure Plans Massive New Data Centre Campus in Downtown Phoenix. STACK Infrastructure will build a 230-megawatt campus with 1.78 million square feet of data centers, continuing the developer's global expansion. This 50-acre campus will help meet the demand for cloud capacity in the rapidly growing Phoenix market.
9. What pricing options are available for accessing the report?
Pricing options include single-user, multi-user, and enterprise licenses priced at USD 3800, USD 4500, and USD 5800 respectively.
10. Is the market size provided in terms of value or volume?
The market size is provided in terms of value, measured in Million.
11. Are there any specific market keywords associated with the report?
Yes, the market keyword associated with the report is "Phoenix Data Center Market," which aids in identifying and referencing the specific market segment covered.
12. How do I determine which pricing option suits my needs best?
The pricing options vary based on user requirements and access needs. Individual users may opt for single-user licenses, while businesses requiring broader access may choose multi-user or enterprise licenses for cost-effective access to the report.
13. Are there any additional resources or data provided in the Phoenix Data Center Market report?
While the report offers comprehensive insights, it's advisable to review the specific contents or supplementary materials provided to ascertain if additional resources or data are available.
14. How can I stay updated on further developments or reports in the Phoenix Data Center Market?
To stay informed about further developments, trends, and reports in the Phoenix Data Center Market, consider subscribing to industry newsletters, following relevant companies and organizations, or regularly checking reputable industry news sources and publications.
Methodology
Step 1 - Identification of Relevant Samples Size from Population Database


Step 2 - Approaches for Defining Global Market Size (Value, Volume* & Price*)

Note*: In applicable scenarios
Step 3 - Data Sources
Primary Research
- Web Analytics
- Survey Reports
- Research Institute
- Latest Research Reports
- Opinion Leaders
Secondary Research
- Annual Reports
- White Paper
- Latest Press Release
- Industry Association
- Paid Database
- Investor Presentations

Step 4 - Data Triangulation
Involves using different sources of information in order to increase the validity of a study
These sources are likely to be stakeholders in a program - participants, other researchers, program staff, other community members, and so on.
Then we put all data in single framework & apply various statistical tools to find out the dynamic on the market.
During the analysis stage, feedback from the stakeholder groups would be compared to determine areas of agreement as well as areas of divergence
