

Key Insights
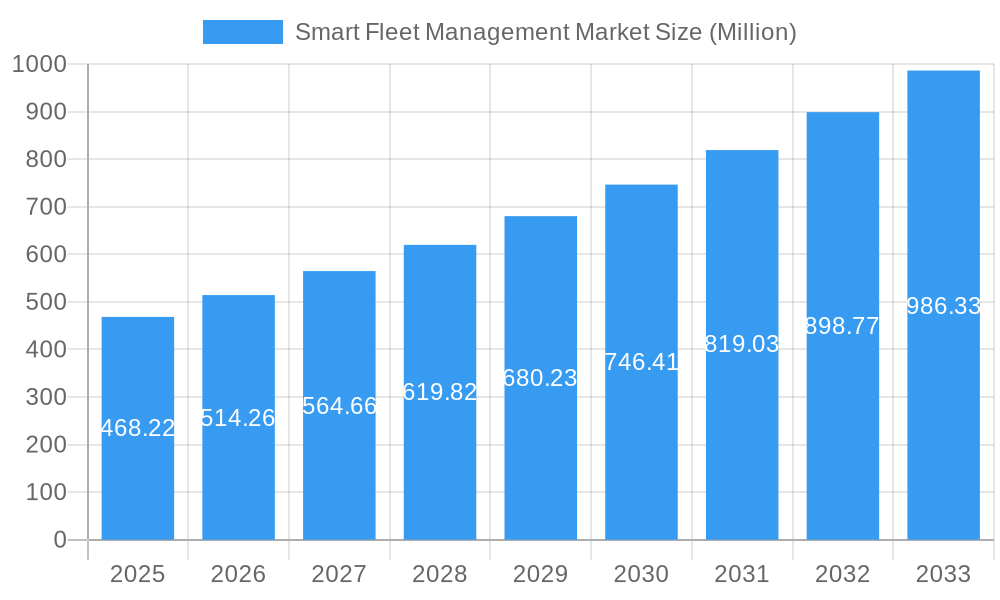
The global smart fleet management market is experiencing robust growth, projected to reach \$468.22 million in 2025 and exhibiting a Compound Annual Growth Rate (CAGR) of 9.50% from 2025 to 2033. This expansion is driven by several key factors. The increasing need for enhanced operational efficiency and cost reduction within transportation and logistics sectors is a primary driver. Businesses are increasingly adopting telematics and IoT-enabled solutions to optimize routes, reduce fuel consumption, improve driver safety, and enhance overall fleet productivity. Furthermore, stringent government regulations regarding vehicle emissions and driver behavior are compelling businesses to invest in smart fleet management systems that comply with these mandates. Technological advancements, such as the development of more sophisticated sensors, improved data analytics capabilities, and the integration of Artificial Intelligence (AI) and machine learning (ML) algorithms, are further fueling market growth. The rise of subscription-based SaaS models is also making these technologies more accessible to businesses of all sizes.
Smart Fleet Management Market Market Size (In Million)
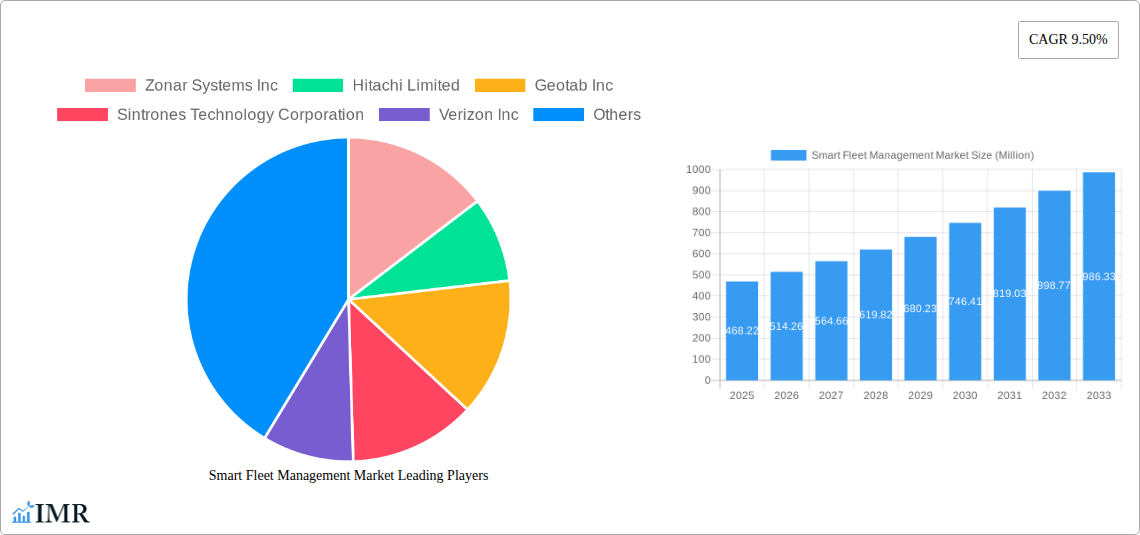
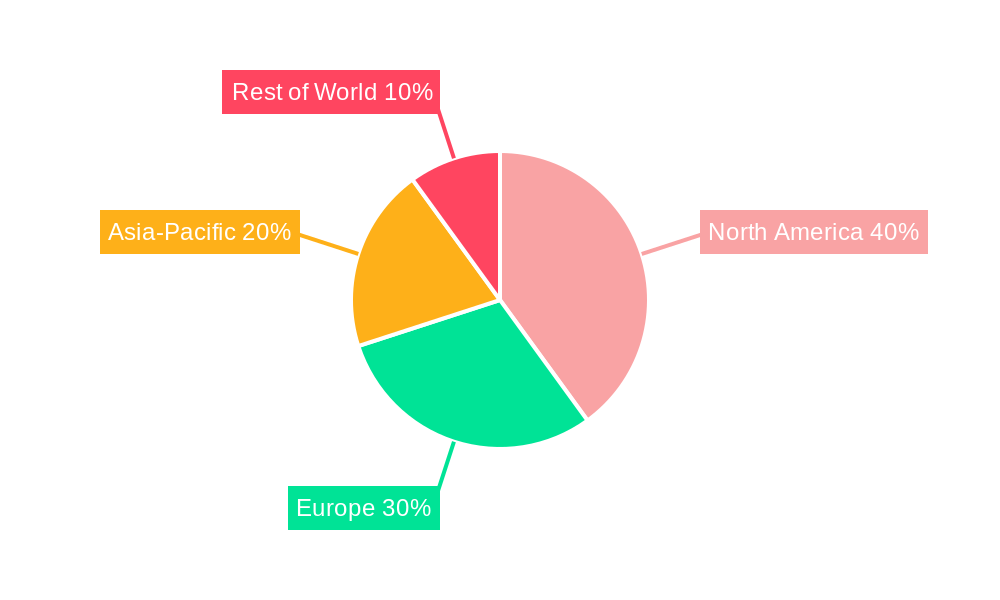
Competition in the smart fleet management market is intense, with established players like Zonar Systems Inc, Hitachi Limited, Geotab Inc, and Samsara Inc competing alongside emerging technology providers. These companies are constantly innovating to offer comprehensive solutions encompassing vehicle tracking, driver behavior monitoring, maintenance scheduling, and fuel management. The market is segmented geographically, with North America and Europe currently holding significant market shares, owing to higher technological adoption rates and well-established transportation infrastructure. However, developing economies in Asia-Pacific and other regions are poised for significant growth, driven by rapid urbanization and expanding logistics networks. Future growth will be shaped by factors such as the increasing adoption of electric and autonomous vehicles, further advancements in data analytics and predictive maintenance, and the integration of smart fleet management with other enterprise resource planning (ERP) systems. The market's trajectory indicates a sustained period of growth, with continued investment in innovative solutions and expansion into new geographical markets.
Smart Fleet Management Market Company Market Share
Smart Fleet Management Market: A Comprehensive Report (2019-2033)
This comprehensive report provides an in-depth analysis of the Smart Fleet Management Market, encompassing market dynamics, growth trends, regional insights, and key player analysis. With a study period spanning 2019-2033, a base year of 2025, and a forecast period from 2025-2033, this report serves as an essential resource for industry professionals, investors, and strategists seeking to navigate this rapidly evolving landscape. The parent market is Transportation and Logistics, while the child market is Fleet Management. The market size is predicted to reach xx Million by 2033.
Smart Fleet Management Market Dynamics & Structure
The Smart Fleet Management market is characterized by moderate concentration, with several major players vying for market share. Technological innovation, particularly in areas like AI, IoT, and advanced analytics, is a key driver, pushing the market towards more efficient and data-driven solutions. Regulatory frameworks concerning data privacy and vehicle safety are significant considerations, influencing product development and adoption. The market also experiences competition from traditional fleet management methods, although these are increasingly being replaced by technologically superior alternatives. M&A activity within the sector has been steadily increasing, with approximately xx deals recorded between 2019 and 2024, indicating consolidation and expansion strategies.
- Market Concentration: Moderately concentrated, with the top 5 players holding approximately xx% of the market share in 2024.
- Technological Innovation: AI-powered predictive maintenance, real-time tracking and monitoring, and advanced analytics are driving market growth.
- Regulatory Frameworks: Compliance with data privacy regulations (e.g., GDPR, CCPA) and safety standards (e.g., ELD mandate) is crucial.
- Competitive Substitutes: Traditional fleet management systems and manual tracking methods pose a threat, but their market share is declining.
- End-User Demographics: Growth is driven by large fleets in transportation, logistics, and construction, with increasing adoption by smaller businesses.
- M&A Trends: Significant increase in M&A activity between 2019 and 2024, suggesting market consolidation and expansion. The average deal size was approximately xx Million.
Smart Fleet Management Market Growth Trends & Insights
The Smart Fleet Management market has experienced substantial growth during the historical period (2019-2024), with a Compound Annual Growth Rate (CAGR) of xx%. This growth is attributable to several factors, including the increasing adoption of connected vehicles, rising fuel costs, the need for enhanced operational efficiency, and stringent government regulations promoting safety and emission reduction. Market penetration increased from xx% in 2019 to xx% in 2024. Technological advancements, such as the integration of Artificial Intelligence (AI) for predictive maintenance and route optimization, are accelerating this growth. Consumer behavior shifts towards data-driven decision-making and the demand for real-time visibility into fleet operations further contribute to market expansion. The market is predicted to maintain a strong growth trajectory throughout the forecast period (2025-2033), driven by continued technological innovation and increasing industry adoption. We project a CAGR of xx% between 2025 and 2033, with the market size expected to reach xx Million by 2033.
Dominant Regions, Countries, or Segments in Smart Fleet Management Market
North America currently holds the dominant position in the Smart Fleet Management market, accounting for approximately xx% of the global market share in 2024. This dominance can be attributed to several factors, including:
- Early Adoption of Technology: A higher rate of technology adoption across various industries, leading to increased demand for smart fleet management solutions.
- Stringent Regulations: Government regulations promoting safety and emission reductions are driving the adoption of smart fleet solutions.
- Well-Developed Infrastructure: Robust telecommunications infrastructure provides strong support for the deployment of connected vehicle technologies.
- High Spending Capacity: Relatively high spending capacity across businesses, particularly in the logistics and transportation sectors, allows for significant investment in smart fleet management systems.
Europe and Asia-Pacific are also experiencing significant growth, with substantial market expansion predicted in the coming years. The growth is being driven by government initiatives promoting digitization in transportation, expanding smart city infrastructure and increasing demand for efficient logistics solutions.
Smart Fleet Management Market Product Landscape
Smart fleet management solutions have evolved significantly, offering a range of features including real-time GPS tracking, fuel monitoring, driver behavior analysis, preventative maintenance scheduling, and advanced analytics dashboards. These solutions utilize various technologies like IoT sensors, telematics devices, and cloud-based platforms to provide comprehensive data-driven insights. Key advancements include the integration of AI for predictive maintenance and route optimization, enhancing efficiency and reducing operational costs. Unique selling propositions often focus on ease of use, customizable dashboards, comprehensive reporting features, and seamless integration with existing fleet management systems.
Key Drivers, Barriers & Challenges in Smart Fleet Management Market
Key Drivers:
- Increasing demand for improved fleet efficiency and cost reduction.
- Stringent government regulations concerning safety and emissions.
- Growing adoption of connected vehicles and IoT technologies.
- Rise in the adoption of telematics and analytics.
Key Challenges and Restraints:
- High initial investment costs associated with implementation.
- Concerns regarding data security and privacy.
- Integration complexities with existing systems within an organization.
- Dependence on reliable network connectivity for optimal functioning. Lack of connectivity in remote areas limits adoption in certain sectors.
Emerging Opportunities in Smart Fleet Management Market
- Expansion into developing markets with growing transportation sectors.
- Integration of smart fleet management with other technologies like autonomous driving.
- Development of specialized solutions for specific industries like construction or agriculture.
- Growing demand for data-driven insights and predictive analytics.
Growth Accelerators in the Smart Fleet Management Market Industry
Strategic partnerships between technology providers and fleet operators are creating synergies leading to greater innovation and faster market penetration. Furthermore, continuous technological advancements, particularly in AI and machine learning, provide opportunities for developing more sophisticated and efficient fleet management solutions. Finally, expanding into underserved markets and focusing on niche industry solutions will further drive market growth.
Key Players Shaping the Smart Fleet Management Market Market
- Zonar Systems Inc
- Hitachi Limited
- Geotab Inc
- Sintrones Technology Corporation
- Verizon Inc
- Teletrac Navman US Limited
- Inseego Corporation
- Sierra Wireless Inc
- Samsara Inc
- Continental AG
- List Not Exhaustive
Notable Milestones in Smart Fleet Management Market Sector
- June 2024: AsianBulk Logistics (ABL) adopts Spinergie's smart fleet management solution to optimize global transshipment operations.
- April 2024: Seaward Services implements Spinergie's solution across its offshore wind operations fleet.
In-Depth Smart Fleet Management Market Outlook
The Smart Fleet Management market is poised for significant growth in the coming years, driven by ongoing technological advancements, increased regulatory pressure, and a growing focus on operational efficiency across various industries. The integration of AI and machine learning will further enhance the capabilities of these systems, leading to more accurate predictive analytics and optimized fleet operations. Strategic partnerships and the exploration of untapped markets will also contribute to the market's sustained expansion, presenting lucrative opportunities for both established players and emerging companies. The market will witness an increased focus on data security and privacy regulations, shaping product development and adoption strategies.
Smart Fleet Management Market Segmentation
-
1. Transporation Mode
- 1.1. Marine
- 1.2. Rolling Stock
- 1.3. Automotive
- 1.4. Other Modes
-
2. Solution
- 2.1. Tracking and Monitoring
- 2.2. Route Optimization
- 2.3. ADAS
- 2.4. Remote Diagnostics
- 2.5. Telematics
- 2.6. Other Solutions
-
3. Hardware
- 3.1. Onboard Diagnostics (OBD)
- 3.2. Cameras
- 3.3. Sensors
- 3.4. GPS Devices
Smart Fleet Management Market Segmentation By Geography
- 1. North America
- 2. Europe
- 3. Asia
- 4. Latin America
- 5. Middle East and Africa
Smart Fleet Management Market Regional Market Share
Geographic Coverage of Smart Fleet Management Market
Smart Fleet Management Market REPORT HIGHLIGHTS
| Aspects | Details |
|---|---|
| Study Period | 2020-2034 |
| Base Year | 2025 |
| Estimated Year | 2026 |
| Forecast Period | 2026-2034 |
| Historical Period | 2020-2025 |
| Growth Rate | CAGR of 9.50% from 2020-2034 |
| Segmentation |
|
Table of Contents
- 1. Introduction
- 1.1. Research Scope
- 1.2. Market Segmentation
- 1.3. Research Objective
- 1.4. Definitions and Assumptions
- 2. Executive Summary
- 2.1. Market Snapshot
- 3. Market Dynamics
- 3.1. Market Drivers
- 3.2. Market Restrains
- 3.3. Market Trends
- 3.4. Market Opportunities
- 4. Market Factor Analysis
- 4.1. Porters Five Forces
- 4.1.1. Bargaining Power of Suppliers
- 4.1.2. Bargaining Power of Buyers
- 4.1.3. Threat of New Entrants
- 4.1.4. Threat of Substitutes
- 4.1.5. Competitive Rivalry
- 4.2. PESTEL analysis
- 4.3. BCG Analysis
- 4.3.1. Stars (High Growth, High Market Share)
- 4.3.2. Cash Cows (Low Growth, High Market Share)
- 4.3.3. Question Mark (High Growth, Low Market Share)
- 4.3.4. Dogs (Low Growth, Low Market Share)
- 4.4. Ansoff Matrix Analysis
- 4.5. Supply Chain Analysis
- 4.6. Regulatory Landscape
- 4.7. Current Market Potential and Opportunity Assessment (TAM–SAM–SOM Framework)
- 4.8. IMR Analyst Note
- 4.1. Porters Five Forces
- 5. Market Analysis, Insights and Forecast 2021-2033
- 5.1. Market Analysis, Insights and Forecast - by Transporation Mode
- 5.1.1. Marine
- 5.1.2. Rolling Stock
- 5.1.3. Automotive
- 5.1.4. Other Modes
- 5.2. Market Analysis, Insights and Forecast - by Solution
- 5.2.1. Tracking and Monitoring
- 5.2.2. Route Optimization
- 5.2.3. ADAS
- 5.2.4. Remote Diagnostics
- 5.2.5. Telematics
- 5.2.6. Other Solutions
- 5.3. Market Analysis, Insights and Forecast - by Hardware
- 5.3.1. Onboard Diagnostics (OBD)
- 5.3.2. Cameras
- 5.3.3. Sensors
- 5.3.4. GPS Devices
- 5.4. Market Analysis, Insights and Forecast - by Region
- 5.4.1. North America
- 5.4.2. Europe
- 5.4.3. Asia
- 5.4.4. Latin America
- 5.4.5. Middle East and Africa
- 5.1. Market Analysis, Insights and Forecast - by Transporation Mode
- 6. Global Smart Fleet Management Market Analysis, Insights and Forecast, 2021-2033
- 6.1. Market Analysis, Insights and Forecast - by Transporation Mode
- 6.1.1. Marine
- 6.1.2. Rolling Stock
- 6.1.3. Automotive
- 6.1.4. Other Modes
- 6.2. Market Analysis, Insights and Forecast - by Solution
- 6.2.1. Tracking and Monitoring
- 6.2.2. Route Optimization
- 6.2.3. ADAS
- 6.2.4. Remote Diagnostics
- 6.2.5. Telematics
- 6.2.6. Other Solutions
- 6.3. Market Analysis, Insights and Forecast - by Hardware
- 6.3.1. Onboard Diagnostics (OBD)
- 6.3.2. Cameras
- 6.3.3. Sensors
- 6.3.4. GPS Devices
- 6.1. Market Analysis, Insights and Forecast - by Transporation Mode
- 7. North America Smart Fleet Management Market Analysis, Insights and Forecast, 2020-2032
- 7.1. Market Analysis, Insights and Forecast - by Transporation Mode
- 7.1.1. Marine
- 7.1.2. Rolling Stock
- 7.1.3. Automotive
- 7.1.4. Other Modes
- 7.2. Market Analysis, Insights and Forecast - by Solution
- 7.2.1. Tracking and Monitoring
- 7.2.2. Route Optimization
- 7.2.3. ADAS
- 7.2.4. Remote Diagnostics
- 7.2.5. Telematics
- 7.2.6. Other Solutions
- 7.3. Market Analysis, Insights and Forecast - by Hardware
- 7.3.1. Onboard Diagnostics (OBD)
- 7.3.2. Cameras
- 7.3.3. Sensors
- 7.3.4. GPS Devices
- 7.1. Market Analysis, Insights and Forecast - by Transporation Mode
- 8. Europe Smart Fleet Management Market Analysis, Insights and Forecast, 2020-2032
- 8.1. Market Analysis, Insights and Forecast - by Transporation Mode
- 8.1.1. Marine
- 8.1.2. Rolling Stock
- 8.1.3. Automotive
- 8.1.4. Other Modes
- 8.2. Market Analysis, Insights and Forecast - by Solution
- 8.2.1. Tracking and Monitoring
- 8.2.2. Route Optimization
- 8.2.3. ADAS
- 8.2.4. Remote Diagnostics
- 8.2.5. Telematics
- 8.2.6. Other Solutions
- 8.3. Market Analysis, Insights and Forecast - by Hardware
- 8.3.1. Onboard Diagnostics (OBD)
- 8.3.2. Cameras
- 8.3.3. Sensors
- 8.3.4. GPS Devices
- 8.1. Market Analysis, Insights and Forecast - by Transporation Mode
- 9. Asia Smart Fleet Management Market Analysis, Insights and Forecast, 2020-2032
- 9.1. Market Analysis, Insights and Forecast - by Transporation Mode
- 9.1.1. Marine
- 9.1.2. Rolling Stock
- 9.1.3. Automotive
- 9.1.4. Other Modes
- 9.2. Market Analysis, Insights and Forecast - by Solution
- 9.2.1. Tracking and Monitoring
- 9.2.2. Route Optimization
- 9.2.3. ADAS
- 9.2.4. Remote Diagnostics
- 9.2.5. Telematics
- 9.2.6. Other Solutions
- 9.3. Market Analysis, Insights and Forecast - by Hardware
- 9.3.1. Onboard Diagnostics (OBD)
- 9.3.2. Cameras
- 9.3.3. Sensors
- 9.3.4. GPS Devices
- 9.1. Market Analysis, Insights and Forecast - by Transporation Mode
- 10. Latin America Smart Fleet Management Market Analysis, Insights and Forecast, 2020-2032
- 10.1. Market Analysis, Insights and Forecast - by Transporation Mode
- 10.1.1. Marine
- 10.1.2. Rolling Stock
- 10.1.3. Automotive
- 10.1.4. Other Modes
- 10.2. Market Analysis, Insights and Forecast - by Solution
- 10.2.1. Tracking and Monitoring
- 10.2.2. Route Optimization
- 10.2.3. ADAS
- 10.2.4. Remote Diagnostics
- 10.2.5. Telematics
- 10.2.6. Other Solutions
- 10.3. Market Analysis, Insights and Forecast - by Hardware
- 10.3.1. Onboard Diagnostics (OBD)
- 10.3.2. Cameras
- 10.3.3. Sensors
- 10.3.4. GPS Devices
- 10.1. Market Analysis, Insights and Forecast - by Transporation Mode
- 11. Middle East and Africa Smart Fleet Management Market Analysis, Insights and Forecast, 2020-2032
- 11.1. Market Analysis, Insights and Forecast - by Transporation Mode
- 11.1.1. Marine
- 11.1.2. Rolling Stock
- 11.1.3. Automotive
- 11.1.4. Other Modes
- 11.2. Market Analysis, Insights and Forecast - by Solution
- 11.2.1. Tracking and Monitoring
- 11.2.2. Route Optimization
- 11.2.3. ADAS
- 11.2.4. Remote Diagnostics
- 11.2.5. Telematics
- 11.2.6. Other Solutions
- 11.3. Market Analysis, Insights and Forecast - by Hardware
- 11.3.1. Onboard Diagnostics (OBD)
- 11.3.2. Cameras
- 11.3.3. Sensors
- 11.3.4. GPS Devices
- 11.1. Market Analysis, Insights and Forecast - by Transporation Mode
- 12. Competitive Analysis
- 12.1. Company Profiles
- 12.1.1 Zonar Systems Inc
- 12.1.1.1. Company Overview
- 12.1.1.2. Products
- 12.1.1.3. Company Financials
- 12.1.1.4. SWOT Analysis
- 12.1.2 Hitachi Limited
- 12.1.2.1. Company Overview
- 12.1.2.2. Products
- 12.1.2.3. Company Financials
- 12.1.2.4. SWOT Analysis
- 12.1.3 Geotab Inc
- 12.1.3.1. Company Overview
- 12.1.3.2. Products
- 12.1.3.3. Company Financials
- 12.1.3.4. SWOT Analysis
- 12.1.4 Sintrones Technology Corporation
- 12.1.4.1. Company Overview
- 12.1.4.2. Products
- 12.1.4.3. Company Financials
- 12.1.4.4. SWOT Analysis
- 12.1.5 Verizon Inc
- 12.1.5.1. Company Overview
- 12.1.5.2. Products
- 12.1.5.3. Company Financials
- 12.1.5.4. SWOT Analysis
- 12.1.6 Teletrac Navman US Limited
- 12.1.6.1. Company Overview
- 12.1.6.2. Products
- 12.1.6.3. Company Financials
- 12.1.6.4. SWOT Analysis
- 12.1.7 Inseego Corporation
- 12.1.7.1. Company Overview
- 12.1.7.2. Products
- 12.1.7.3. Company Financials
- 12.1.7.4. SWOT Analysis
- 12.1.8 Sierra Wireless Inc
- 12.1.8.1. Company Overview
- 12.1.8.2. Products
- 12.1.8.3. Company Financials
- 12.1.8.4. SWOT Analysis
- 12.1.9 Samsara Inc
- 12.1.9.1. Company Overview
- 12.1.9.2. Products
- 12.1.9.3. Company Financials
- 12.1.9.4. SWOT Analysis
- 12.1.10 Continental AG*List Not Exhaustive
- 12.1.10.1. Company Overview
- 12.1.10.2. Products
- 12.1.10.3. Company Financials
- 12.1.10.4. SWOT Analysis
- 12.1.1 Zonar Systems Inc
- 12.2. Market Entropy
- 12.2.1 Company's Key Areas Served
- 12.2.2 Recent Developments
- 12.3. Company Market Share Analysis 2025
- 12.3.1 Top 5 Companies Market Share Analysis
- 12.3.2 Top 3 Companies Market Share Analysis
- 12.4. List of Potential Customers
- 13. Research Methodology
List of Figures
- Figure 1: Global Smart Fleet Management Market Revenue Breakdown (Million, %) by Region 2025 & 2033
- Figure 2: Global Smart Fleet Management Market Volume Breakdown (Billion, %) by Region 2025 & 2033
- Figure 3: North America Smart Fleet Management Market Revenue (Million), by Transporation Mode 2025 & 2033
- Figure 4: North America Smart Fleet Management Market Volume (Billion), by Transporation Mode 2025 & 2033
- Figure 5: North America Smart Fleet Management Market Revenue Share (%), by Transporation Mode 2025 & 2033
- Figure 6: North America Smart Fleet Management Market Volume Share (%), by Transporation Mode 2025 & 2033
- Figure 7: North America Smart Fleet Management Market Revenue (Million), by Solution 2025 & 2033
- Figure 8: North America Smart Fleet Management Market Volume (Billion), by Solution 2025 & 2033
- Figure 9: North America Smart Fleet Management Market Revenue Share (%), by Solution 2025 & 2033
- Figure 10: North America Smart Fleet Management Market Volume Share (%), by Solution 2025 & 2033
- Figure 11: North America Smart Fleet Management Market Revenue (Million), by Hardware 2025 & 2033
- Figure 12: North America Smart Fleet Management Market Volume (Billion), by Hardware 2025 & 2033
- Figure 13: North America Smart Fleet Management Market Revenue Share (%), by Hardware 2025 & 2033
- Figure 14: North America Smart Fleet Management Market Volume Share (%), by Hardware 2025 & 2033
- Figure 15: North America Smart Fleet Management Market Revenue (Million), by Country 2025 & 2033
- Figure 16: North America Smart Fleet Management Market Volume (Billion), by Country 2025 & 2033
- Figure 17: North America Smart Fleet Management Market Revenue Share (%), by Country 2025 & 2033
- Figure 18: North America Smart Fleet Management Market Volume Share (%), by Country 2025 & 2033
- Figure 19: Europe Smart Fleet Management Market Revenue (Million), by Transporation Mode 2025 & 2033
- Figure 20: Europe Smart Fleet Management Market Volume (Billion), by Transporation Mode 2025 & 2033
- Figure 21: Europe Smart Fleet Management Market Revenue Share (%), by Transporation Mode 2025 & 2033
- Figure 22: Europe Smart Fleet Management Market Volume Share (%), by Transporation Mode 2025 & 2033
- Figure 23: Europe Smart Fleet Management Market Revenue (Million), by Solution 2025 & 2033
- Figure 24: Europe Smart Fleet Management Market Volume (Billion), by Solution 2025 & 2033
- Figure 25: Europe Smart Fleet Management Market Revenue Share (%), by Solution 2025 & 2033
- Figure 26: Europe Smart Fleet Management Market Volume Share (%), by Solution 2025 & 2033
- Figure 27: Europe Smart Fleet Management Market Revenue (Million), by Hardware 2025 & 2033
- Figure 28: Europe Smart Fleet Management Market Volume (Billion), by Hardware 2025 & 2033
- Figure 29: Europe Smart Fleet Management Market Revenue Share (%), by Hardware 2025 & 2033
- Figure 30: Europe Smart Fleet Management Market Volume Share (%), by Hardware 2025 & 2033
- Figure 31: Europe Smart Fleet Management Market Revenue (Million), by Country 2025 & 2033
- Figure 32: Europe Smart Fleet Management Market Volume (Billion), by Country 2025 & 2033
- Figure 33: Europe Smart Fleet Management Market Revenue Share (%), by Country 2025 & 2033
- Figure 34: Europe Smart Fleet Management Market Volume Share (%), by Country 2025 & 2033
- Figure 35: Asia Smart Fleet Management Market Revenue (Million), by Transporation Mode 2025 & 2033
- Figure 36: Asia Smart Fleet Management Market Volume (Billion), by Transporation Mode 2025 & 2033
- Figure 37: Asia Smart Fleet Management Market Revenue Share (%), by Transporation Mode 2025 & 2033
- Figure 38: Asia Smart Fleet Management Market Volume Share (%), by Transporation Mode 2025 & 2033
- Figure 39: Asia Smart Fleet Management Market Revenue (Million), by Solution 2025 & 2033
- Figure 40: Asia Smart Fleet Management Market Volume (Billion), by Solution 2025 & 2033
- Figure 41: Asia Smart Fleet Management Market Revenue Share (%), by Solution 2025 & 2033
- Figure 42: Asia Smart Fleet Management Market Volume Share (%), by Solution 2025 & 2033
- Figure 43: Asia Smart Fleet Management Market Revenue (Million), by Hardware 2025 & 2033
- Figure 44: Asia Smart Fleet Management Market Volume (Billion), by Hardware 2025 & 2033
- Figure 45: Asia Smart Fleet Management Market Revenue Share (%), by Hardware 2025 & 2033
- Figure 46: Asia Smart Fleet Management Market Volume Share (%), by Hardware 2025 & 2033
- Figure 47: Asia Smart Fleet Management Market Revenue (Million), by Country 2025 & 2033
- Figure 48: Asia Smart Fleet Management Market Volume (Billion), by Country 2025 & 2033
- Figure 49: Asia Smart Fleet Management Market Revenue Share (%), by Country 2025 & 2033
- Figure 50: Asia Smart Fleet Management Market Volume Share (%), by Country 2025 & 2033
- Figure 51: Latin America Smart Fleet Management Market Revenue (Million), by Transporation Mode 2025 & 2033
- Figure 52: Latin America Smart Fleet Management Market Volume (Billion), by Transporation Mode 2025 & 2033
- Figure 53: Latin America Smart Fleet Management Market Revenue Share (%), by Transporation Mode 2025 & 2033
- Figure 54: Latin America Smart Fleet Management Market Volume Share (%), by Transporation Mode 2025 & 2033
- Figure 55: Latin America Smart Fleet Management Market Revenue (Million), by Solution 2025 & 2033
- Figure 56: Latin America Smart Fleet Management Market Volume (Billion), by Solution 2025 & 2033
- Figure 57: Latin America Smart Fleet Management Market Revenue Share (%), by Solution 2025 & 2033
- Figure 58: Latin America Smart Fleet Management Market Volume Share (%), by Solution 2025 & 2033
- Figure 59: Latin America Smart Fleet Management Market Revenue (Million), by Hardware 2025 & 2033
- Figure 60: Latin America Smart Fleet Management Market Volume (Billion), by Hardware 2025 & 2033
- Figure 61: Latin America Smart Fleet Management Market Revenue Share (%), by Hardware 2025 & 2033
- Figure 62: Latin America Smart Fleet Management Market Volume Share (%), by Hardware 2025 & 2033
- Figure 63: Latin America Smart Fleet Management Market Revenue (Million), by Country 2025 & 2033
- Figure 64: Latin America Smart Fleet Management Market Volume (Billion), by Country 2025 & 2033
- Figure 65: Latin America Smart Fleet Management Market Revenue Share (%), by Country 2025 & 2033
- Figure 66: Latin America Smart Fleet Management Market Volume Share (%), by Country 2025 & 2033
- Figure 67: Middle East and Africa Smart Fleet Management Market Revenue (Million), by Transporation Mode 2025 & 2033
- Figure 68: Middle East and Africa Smart Fleet Management Market Volume (Billion), by Transporation Mode 2025 & 2033
- Figure 69: Middle East and Africa Smart Fleet Management Market Revenue Share (%), by Transporation Mode 2025 & 2033
- Figure 70: Middle East and Africa Smart Fleet Management Market Volume Share (%), by Transporation Mode 2025 & 2033
- Figure 71: Middle East and Africa Smart Fleet Management Market Revenue (Million), by Solution 2025 & 2033
- Figure 72: Middle East and Africa Smart Fleet Management Market Volume (Billion), by Solution 2025 & 2033
- Figure 73: Middle East and Africa Smart Fleet Management Market Revenue Share (%), by Solution 2025 & 2033
- Figure 74: Middle East and Africa Smart Fleet Management Market Volume Share (%), by Solution 2025 & 2033
- Figure 75: Middle East and Africa Smart Fleet Management Market Revenue (Million), by Hardware 2025 & 2033
- Figure 76: Middle East and Africa Smart Fleet Management Market Volume (Billion), by Hardware 2025 & 2033
- Figure 77: Middle East and Africa Smart Fleet Management Market Revenue Share (%), by Hardware 2025 & 2033
- Figure 78: Middle East and Africa Smart Fleet Management Market Volume Share (%), by Hardware 2025 & 2033
- Figure 79: Middle East and Africa Smart Fleet Management Market Revenue (Million), by Country 2025 & 2033
- Figure 80: Middle East and Africa Smart Fleet Management Market Volume (Billion), by Country 2025 & 2033
- Figure 81: Middle East and Africa Smart Fleet Management Market Revenue Share (%), by Country 2025 & 2033
- Figure 82: Middle East and Africa Smart Fleet Management Market Volume Share (%), by Country 2025 & 2033
List of Tables
- Table 1: Global Smart Fleet Management Market Revenue Million Forecast, by Transporation Mode 2020 & 2033
- Table 2: Global Smart Fleet Management Market Volume Billion Forecast, by Transporation Mode 2020 & 2033
- Table 3: Global Smart Fleet Management Market Revenue Million Forecast, by Solution 2020 & 2033
- Table 4: Global Smart Fleet Management Market Volume Billion Forecast, by Solution 2020 & 2033
- Table 5: Global Smart Fleet Management Market Revenue Million Forecast, by Hardware 2020 & 2033
- Table 6: Global Smart Fleet Management Market Volume Billion Forecast, by Hardware 2020 & 2033
- Table 7: Global Smart Fleet Management Market Revenue Million Forecast, by Region 2020 & 2033
- Table 8: Global Smart Fleet Management Market Volume Billion Forecast, by Region 2020 & 2033
- Table 9: Global Smart Fleet Management Market Revenue Million Forecast, by Transporation Mode 2020 & 2033
- Table 10: Global Smart Fleet Management Market Volume Billion Forecast, by Transporation Mode 2020 & 2033
- Table 11: Global Smart Fleet Management Market Revenue Million Forecast, by Solution 2020 & 2033
- Table 12: Global Smart Fleet Management Market Volume Billion Forecast, by Solution 2020 & 2033
- Table 13: Global Smart Fleet Management Market Revenue Million Forecast, by Hardware 2020 & 2033
- Table 14: Global Smart Fleet Management Market Volume Billion Forecast, by Hardware 2020 & 2033
- Table 15: Global Smart Fleet Management Market Revenue Million Forecast, by Country 2020 & 2033
- Table 16: Global Smart Fleet Management Market Volume Billion Forecast, by Country 2020 & 2033
- Table 17: Global Smart Fleet Management Market Revenue Million Forecast, by Transporation Mode 2020 & 2033
- Table 18: Global Smart Fleet Management Market Volume Billion Forecast, by Transporation Mode 2020 & 2033
- Table 19: Global Smart Fleet Management Market Revenue Million Forecast, by Solution 2020 & 2033
- Table 20: Global Smart Fleet Management Market Volume Billion Forecast, by Solution 2020 & 2033
- Table 21: Global Smart Fleet Management Market Revenue Million Forecast, by Hardware 2020 & 2033
- Table 22: Global Smart Fleet Management Market Volume Billion Forecast, by Hardware 2020 & 2033
- Table 23: Global Smart Fleet Management Market Revenue Million Forecast, by Country 2020 & 2033
- Table 24: Global Smart Fleet Management Market Volume Billion Forecast, by Country 2020 & 2033
- Table 25: Global Smart Fleet Management Market Revenue Million Forecast, by Transporation Mode 2020 & 2033
- Table 26: Global Smart Fleet Management Market Volume Billion Forecast, by Transporation Mode 2020 & 2033
- Table 27: Global Smart Fleet Management Market Revenue Million Forecast, by Solution 2020 & 2033
- Table 28: Global Smart Fleet Management Market Volume Billion Forecast, by Solution 2020 & 2033
- Table 29: Global Smart Fleet Management Market Revenue Million Forecast, by Hardware 2020 & 2033
- Table 30: Global Smart Fleet Management Market Volume Billion Forecast, by Hardware 2020 & 2033
- Table 31: Global Smart Fleet Management Market Revenue Million Forecast, by Country 2020 & 2033
- Table 32: Global Smart Fleet Management Market Volume Billion Forecast, by Country 2020 & 2033
- Table 33: Global Smart Fleet Management Market Revenue Million Forecast, by Transporation Mode 2020 & 2033
- Table 34: Global Smart Fleet Management Market Volume Billion Forecast, by Transporation Mode 2020 & 2033
- Table 35: Global Smart Fleet Management Market Revenue Million Forecast, by Solution 2020 & 2033
- Table 36: Global Smart Fleet Management Market Volume Billion Forecast, by Solution 2020 & 2033
- Table 37: Global Smart Fleet Management Market Revenue Million Forecast, by Hardware 2020 & 2033
- Table 38: Global Smart Fleet Management Market Volume Billion Forecast, by Hardware 2020 & 2033
- Table 39: Global Smart Fleet Management Market Revenue Million Forecast, by Country 2020 & 2033
- Table 40: Global Smart Fleet Management Market Volume Billion Forecast, by Country 2020 & 2033
- Table 41: Global Smart Fleet Management Market Revenue Million Forecast, by Transporation Mode 2020 & 2033
- Table 42: Global Smart Fleet Management Market Volume Billion Forecast, by Transporation Mode 2020 & 2033
- Table 43: Global Smart Fleet Management Market Revenue Million Forecast, by Solution 2020 & 2033
- Table 44: Global Smart Fleet Management Market Volume Billion Forecast, by Solution 2020 & 2033
- Table 45: Global Smart Fleet Management Market Revenue Million Forecast, by Hardware 2020 & 2033
- Table 46: Global Smart Fleet Management Market Volume Billion Forecast, by Hardware 2020 & 2033
- Table 47: Global Smart Fleet Management Market Revenue Million Forecast, by Country 2020 & 2033
- Table 48: Global Smart Fleet Management Market Volume Billion Forecast, by Country 2020 & 2033
Frequently Asked Questions
1. What is the projected Compound Annual Growth Rate (CAGR) of the Smart Fleet Management Market?
The projected CAGR is approximately 9.50%.
2. Which companies are prominent players in the Smart Fleet Management Market?
Key companies in the market include Zonar Systems Inc, Hitachi Limited, Geotab Inc, Sintrones Technology Corporation, Verizon Inc, Teletrac Navman US Limited, Inseego Corporation, Sierra Wireless Inc, Samsara Inc, Continental AG*List Not Exhaustive.
3. What are the main segments of the Smart Fleet Management Market?
The market segments include Transporation Mode, Solution, Hardware.
4. Can you provide details about the market size?
The market size is estimated to be USD 468.22 Million as of 2022.
5. What are some drivers contributing to market growth?
Telematics and IoT Integration; Regulatory Compliance and Safety Standards.
6. What are the notable trends driving market growth?
Tracking and Monitoring is Expected to Witness a Significant Growth.
7. Are there any restraints impacting market growth?
Telematics and IoT Integration; Regulatory Compliance and Safety Standards.
8. Can you provide examples of recent developments in the market?
June 2024: Spinergie, a specialist in maritime data integration and analytics, revealed that AsianBulk Logistics (ABL), known for its integrated logistics services and infrastructure solutions for bulk commodities, opted for smart fleet management. This choice aims to refine ABL's global transshipment operations. The centralized digital solution promises to simplify onboard reporting for bulk cargo transfers, bolster activity tracking throughout ABL's fleet, and facilitate efficient oversight of remote offshore project zones. Through the Spinergie solution, ABL now leverages automated outgoing reports derived from digital Daily Reports (DRs) filled out by captains.April 2024: Seaward Services, a subsidiary of Hornblower Group, is implementing Spinergie Inc.'s smart fleet management solution across its fleet. This fleet includes Jones Act-compliant offshore service vessels, multipurpose service vessels (MPSVs), and crew transfer vessels (CTVs) actively engaged in offshore wind operations along the US East Coast. Spinergie's customizable smart fleet management solution consolidates various systems into a unified analytics platform, enabling shoreside operations personnel to manage the fleet remotely.
9. What pricing options are available for accessing the report?
Pricing options include single-user, multi-user, and enterprise licenses priced at USD 4750, USD 5250, and USD 8750 respectively.
10. Is the market size provided in terms of value or volume?
The market size is provided in terms of value, measured in Million and volume, measured in Billion.
11. Are there any specific market keywords associated with the report?
Yes, the market keyword associated with the report is "Smart Fleet Management Market," which aids in identifying and referencing the specific market segment covered.
12. How do I determine which pricing option suits my needs best?
The pricing options vary based on user requirements and access needs. Individual users may opt for single-user licenses, while businesses requiring broader access may choose multi-user or enterprise licenses for cost-effective access to the report.
13. Are there any additional resources or data provided in the Smart Fleet Management Market report?
While the report offers comprehensive insights, it's advisable to review the specific contents or supplementary materials provided to ascertain if additional resources or data are available.
14. How can I stay updated on further developments or reports in the Smart Fleet Management Market?
To stay informed about further developments, trends, and reports in the Smart Fleet Management Market, consider subscribing to industry newsletters, following relevant companies and organizations, or regularly checking reputable industry news sources and publications.
Methodology
Step 1 - Identification of Relevant Samples Size from Population Database


Step 2 - Approaches for Defining Global Market Size (Value, Volume* & Price*)

Note*: In applicable scenarios
Step 3 - Data Sources
Primary Research
- Web Analytics
- Survey Reports
- Research Institute
- Latest Research Reports
- Opinion Leaders
Secondary Research
- Annual Reports
- White Paper
- Latest Press Release
- Industry Association
- Paid Database
- Investor Presentations

Step 4 - Data Triangulation
Involves using different sources of information in order to increase the validity of a study
These sources are likely to be stakeholders in a program - participants, other researchers, program staff, other community members, and so on.
Then we put all data in single framework & apply various statistical tools to find out the dynamic on the market.
During the analysis stage, feedback from the stakeholder groups would be compared to determine areas of agreement as well as areas of divergence