

Key Insights
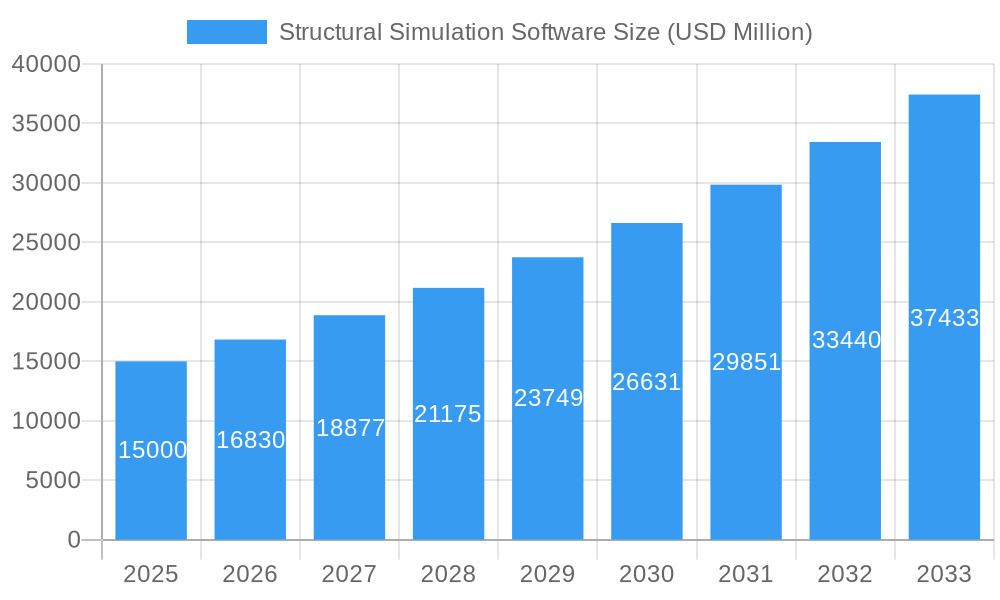
The global Structural Simulation Software market is projected for robust expansion, reaching an estimated $15 billion in 2025. This growth is propelled by a significant Compound Annual Growth Rate (CAGR) of 12.2% over the forecast period of 2025-2033. The escalating demand for advanced engineering tools that facilitate virtual prototyping, reduce physical testing costs, and accelerate product development cycles across various industries is a primary driver. Industries such as Aerospace and Automotive are at the forefront, heavily relying on structural simulation to ensure product integrity, optimize designs for weight reduction and performance, and comply with stringent safety regulations. The increasing complexity of modern product designs, coupled with the need for enhanced durability and reliability, further fuels the adoption of these sophisticated software solutions. Furthermore, the growing emphasis on sustainable product development, which involves material optimization and energy efficiency, also contributes to the market's upward trajectory.
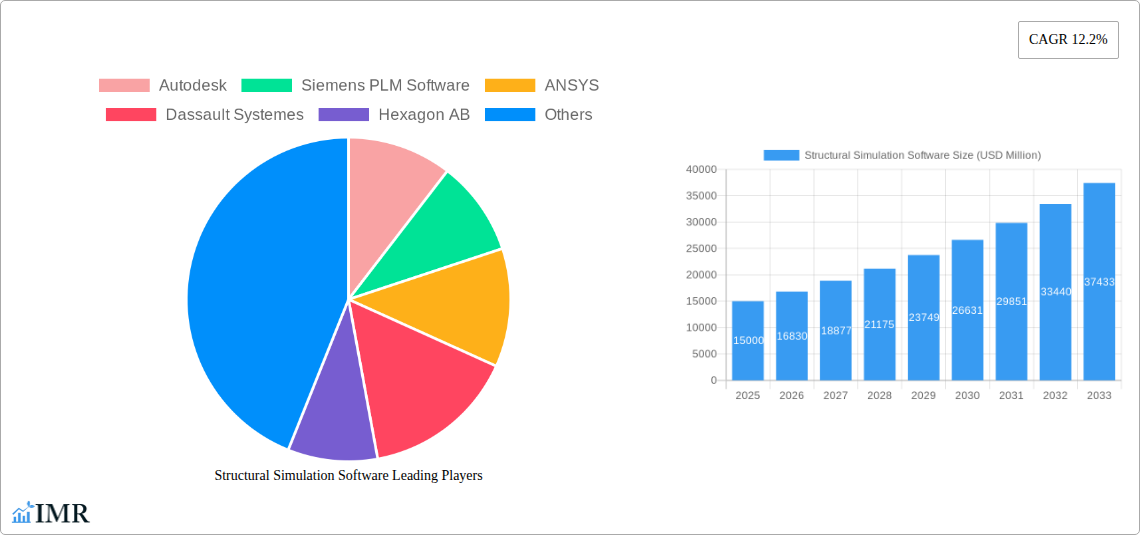
Structural Simulation Software Market Size (In Billion)
The market's expansion is further bolstered by technological advancements in simulation capabilities, including the integration of Artificial Intelligence (AI) and Machine Learning (ML) for faster and more accurate analysis. The increasing adoption of cloud-based simulation platforms is also democratizing access to these powerful tools, enabling smaller enterprises to leverage advanced structural analysis without significant upfront investment in hardware. While the market benefits from these positive trends, certain restraints, such as the high initial cost of some advanced software suites and the need for specialized expertise to operate them effectively, could pose challenges. However, the continuous innovation by leading players and the expanding application scope across segments like Ship Ocean, Engine, Ground Transportation, Building Environment, and Electronic Devices are expected to outweigh these limitations, ensuring sustained and dynamic market growth.
Structural Simulation Software Company Market Share
This in-depth report provides critical insights into the Structural Simulation Software Market, a rapidly evolving sector essential for modern engineering design and analysis across diverse industries. With a comprehensive study period from 2019 to 2033 and a base year of 2025, this analysis delves into market dynamics, growth trends, regional dominance, product landscapes, and the pivotal players shaping the future of structural integrity. Essential for industry professionals seeking to understand market penetration, technological advancements, and strategic opportunities, this report offers a granular view of a market poised for significant expansion.
Structural Simulation Software Market Dynamics & Structure
The global Structural Simulation Software Market is characterized by a moderate to high concentration, driven by a few dominant players alongside a growing number of specialized providers. Technological innovation is the primary catalyst, with continuous advancements in Artificial Intelligence (AI), Machine Learning (ML), and High-Performance Computing (HPC) enabling more complex and accurate simulations. Regulatory frameworks, particularly in safety-critical sectors like Aerospace and Ground Transportation, mandate rigorous structural testing, indirectly fueling demand for advanced simulation tools. Competitive product substitutes, while present in the form of physical testing, are increasingly being outperformed in terms of cost-efficiency and speed by sophisticated software solutions. End-user demographics are shifting towards younger engineers who are more digitally native and adept at leveraging these powerful tools. Mergers and Acquisitions (M&A) trends are notable, with larger entities acquiring innovative startups to broaden their portfolio and market reach.
- Market Concentration: Dominated by key players, but with emerging regional and niche specialists.
- Technological Innovation Drivers: AI/ML for predictive analysis, HPC for accelerated computations, cloud-based solutions for accessibility.
- Regulatory Frameworks: Stringent safety standards in Aerospace, Automotive, and Construction are key adoption drivers.
- Competitive Product Substitutes: Physical testing is a substitute but often less efficient and more costly for complex scenarios.
- End-User Demographics: Increasing adoption by SMEs and a younger, digitally savvy engineering workforce.
- M&A Trends: Strategic acquisitions to gain technological edge and expand market footprint.
Structural Simulation Software Growth Trends & Insights
The Structural Simulation Software Market is projected for robust expansion, driven by increasing demand for product performance optimization, reduced physical prototyping, and accelerated time-to-market. The market size is estimated to reach approximately $15.0 Billion by 2033, with a Compound Annual Growth Rate (CAGR) of around 9.5% during the forecast period (2025–2033). Adoption rates are accelerating across a wider spectrum of industries, moving beyond traditional sectors like Aerospace and Automotive into areas such as Electronic Devices and Building Environments. Technological disruptions, including the integration of digital twins, generative design, and real-time simulation capabilities, are further enhancing the value proposition of these software solutions. Consumer behavior is shifting towards a greater reliance on virtual testing and validation, driven by cost considerations and the desire for rapid design iterations. This paradigm shift is compelling businesses to invest more heavily in advanced simulation tools to remain competitive. The ease of access through cloud-based platforms is democratizing the use of sophisticated structural analysis, empowering a broader range of engineers and designers. The integration of AI and ML is revolutionizing the accuracy and speed of simulations, enabling engineers to explore a wider design space and identify optimal solutions more efficiently.
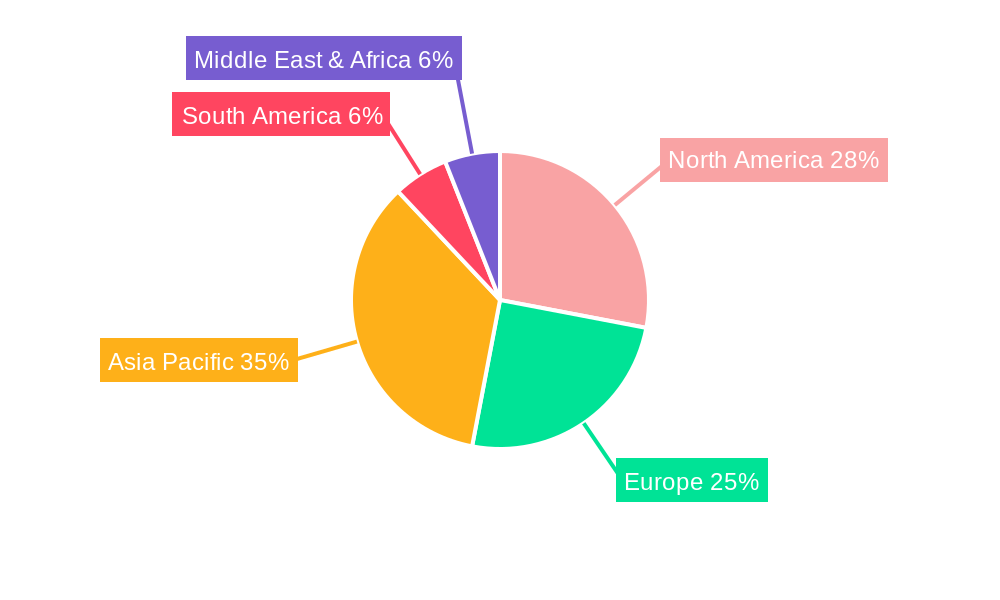
Dominant Regions, Countries, or Segments in Structural Simulation Software
The Aerospace application segment is a dominant driver of growth in the Structural Simulation Software Market, projected to account for a significant market share of over 25% by 2033. This dominance is fueled by the inherent need for extreme reliability, safety, and performance in aircraft and spacecraft design, where even minor structural failures can have catastrophic consequences. The stringent regulatory requirements imposed by aviation authorities worldwide mandate extensive virtual testing and validation.
- Aerospace: This segment's growth is propelled by the development of new aircraft, satellites, and defense systems, requiring advanced simulations for stress, fatigue, and vibration analysis. Key market drivers include the increasing demand for lightweight materials, fuel efficiency, and enhanced passenger safety. The market share in this segment is substantial due to the high cost of physical prototypes and testing in this industry.
- Ground Transportation: Another significant segment, driven by the automotive industry's push for electric vehicles (EVs), autonomous driving technologies, and lightweighting initiatives to improve fuel economy and performance. The rigorous safety standards and competitive pressures in the automotive sector necessitate extensive simulation for crashworthiness, NVH (Noise, Vibration, and Harshness), and durability.
- Electronic Device: This segment is experiencing rapid growth due to the miniaturization of components, increasing power densities, and the demand for robust and reliable consumer electronics, medical devices, and telecommunications equipment. Thermal and structural co-simulation is becoming increasingly critical.
- Engine: Driven by advancements in internal combustion engines, gas turbines, and emerging propulsion systems, requiring precise simulations for thermal stress, fatigue, and vibration analysis.
- Ship Ocean: While a more niche segment, it sees demand for simulations related to hull integrity, stability, and resistance to extreme maritime conditions, particularly with the development of advanced offshore structures and naval vessels.
- Building Environment: Growing adoption in large-scale infrastructure projects, high-rise buildings, and earthquake-prone regions for seismic analysis, wind load simulations, and structural integrity assessments of complex architectural designs.
In terms of geographic dominance, North America and Europe currently lead the market due to the presence of major Aerospace and Automotive OEMs, strong R&D investments, and established simulation software vendors. However, Asia Pacific is emerging as the fastest-growing region, driven by rapid industrialization, increasing manufacturing capabilities, and government initiatives supporting technological advancements in countries like China and India.
Structural Simulation Software Product Landscape
The Structural Simulation Software product landscape is characterized by a confluence of cutting-edge technologies aimed at enhancing design efficiency and product reliability. Innovations include the integration of AI-driven predictive analytics for identifying potential failure points early in the design cycle, advanced meshing techniques for greater accuracy in complex geometries, and cloud-based platforms offering scalable computing power for faster simulations. Performance metrics are continually improving, with software capable of handling multi-physics phenomena such as thermal-structural coupling, fluid-structure interaction, and electro-mechanical analysis. Unique selling propositions often lie in specialized modules tailored for specific industry needs, user-friendly interfaces that democratize advanced simulation, and seamless integration with CAD and PLM systems.
Key Drivers, Barriers & Challenges in Structural Simulation Software
Key Drivers:
- Demand for Product Performance & Reliability: Industries seek to optimize product performance, extend lifespan, and ensure safety, driving the need for rigorous structural analysis.
- Cost Reduction & Time-to-Market: Simulation software significantly reduces the need for expensive physical prototypes and accelerates product development cycles.
- Technological Advancements: Developments in AI, ML, HPC, and cloud computing enable more sophisticated and accessible simulation capabilities.
- Stringent Regulatory Standards: Safety-critical industries face increasing regulatory demands for robust product validation.
Barriers & Challenges:
- High Initial Investment: The cost of acquiring and implementing advanced simulation software can be a barrier for smaller enterprises.
- Skill Gap: A shortage of skilled engineers proficient in using complex simulation tools can hinder adoption.
- Complexity of Software: Steep learning curves and the need for specialized training can be a deterrent.
- Data Integration Issues: Seamless integration with existing CAD/PLM workflows can be challenging.
- Competitive Pressure: Intense competition among software providers can lead to pricing pressures and a need for continuous innovation.
- Cybersecurity Concerns: For cloud-based solutions, data security and intellectual property protection are paramount.
Emerging Opportunities in Structural Simulation Software
Emerging opportunities in the Structural Simulation Software Market lie in the burgeoning fields of additive manufacturing (3D printing), where complex geometries require precise simulation for optimal build processes and material behavior. The growing adoption of the Internet of Things (IoT) and the concept of digital twins present a significant opportunity for real-time structural monitoring and predictive maintenance. Furthermore, the expansion of simulation capabilities into new application areas like renewable energy infrastructure (e.g., wind turbine blades, solar panel mounts) and advanced medical device design offers substantial untapped market potential. The increasing demand for sustainable product design also presents an opportunity for simulation tools that can optimize material usage and energy efficiency.
Growth Accelerators in the Structural Simulation Software Industry
Long-term growth in the Structural Simulation Software Industry is being catalyzed by several key factors. The relentless pursuit of innovation in materials science, leading to new composites and alloys, necessitates advanced simulation to understand their structural behavior. Strategic partnerships between software vendors and hardware manufacturers are accelerating the development of integrated solutions that leverage the full potential of modern computing power. Market expansion into emerging economies, coupled with the increasing availability of accessible, cloud-based simulation platforms, is democratizing access to these powerful tools and driving broader adoption. The continued integration of AI and ML is not only improving simulation accuracy but also enabling new functionalities like automated design optimization.
Key Players Shaping the Structural Simulation Software Market
- Autodesk
- Siemens PLM Software
- ANSYS
- Dassault Systemes
- Hexagon AB
- Alatir
- ESI
- PTC
- COMSOL Multiphysics
- BETA CAE Systems
- Magma
- CoreTech System
- Toray Engineering
- Yuanjisuan
- SimScale GmbH
- Shanghai Suochen Information Technology
- ESI ITI GmbH
- CD-adapco
- Phoenix
Notable Milestones in Structural Simulation Software Sector
- 2019: Increased integration of AI and ML in simulation software for predictive analytics.
- 2020: Significant growth in cloud-based simulation platforms offering greater accessibility.
- 2021: Expansion of multi-physics simulation capabilities to address complex engineering challenges.
- 2022: Rise of digital twin technology, leveraging simulation for real-time asset management.
- 2023: Advancements in generative design tools, enabling automated exploration of optimal structural forms.
- 2024: Enhanced interoperability between CAD, PLM, and simulation software for seamless workflows.
- 2025 (Estimated): Widespread adoption of AI-driven simulation for early-stage design optimization and virtual prototyping.
In-Depth Structural Simulation Software Market Outlook
The outlook for the Structural Simulation Software Market is exceptionally bright, driven by an unprecedented convergence of technological advancements and industrial demands. The continuous evolution of AI and ML will further empower engineers with predictive capabilities, reducing design iterations and material waste. The maturation of cloud computing will democratize access to high-fidelity simulations, fostering innovation across small and medium-sized enterprises. Emerging applications in areas like advanced manufacturing, sustainable energy, and personalized healthcare will unlock new revenue streams and market penetration. Strategic alliances and ecosystem development will create integrated solutions that address the full product lifecycle, solidifying structural simulation as an indispensable component of modern engineering. The market is poised for sustained growth, with innovation and adoption accelerating throughout the forecast period.
Structural Simulation Software Segmentation
-
1. Application
- 1.1. Aerospace
- 1.2. Ship Ocean
- 1.3. Engine
- 1.4. Ground Transportation
- 1.5. Building Environment
- 1.6. Electronic Device
- 1.7. Other
-
2. Types
- 2.1. Mono Functional
- 2.2. Multi Functional
Structural Simulation Software Segmentation By Geography
-
1. North America
- 1.1. United States
- 1.2. Canada
- 1.3. Mexico
-
2. South America
- 2.1. Brazil
- 2.2. Argentina
- 2.3. Rest of South America
-
3. Europe
- 3.1. United Kingdom
- 3.2. Germany
- 3.3. France
- 3.4. Italy
- 3.5. Spain
- 3.6. Russia
- 3.7. Benelux
- 3.8. Nordics
- 3.9. Rest of Europe
-
4. Middle East & Africa
- 4.1. Turkey
- 4.2. Israel
- 4.3. GCC
- 4.4. North Africa
- 4.5. South Africa
- 4.6. Rest of Middle East & Africa
-
5. Asia Pacific
- 5.1. China
- 5.2. India
- 5.3. Japan
- 5.4. South Korea
- 5.5. ASEAN
- 5.6. Oceania
- 5.7. Rest of Asia Pacific
Structural Simulation Software Regional Market Share
Geographic Coverage of Structural Simulation Software
Structural Simulation Software REPORT HIGHLIGHTS
| Aspects | Details |
|---|---|
| Study Period | 2020-2034 |
| Base Year | 2025 |
| Estimated Year | 2026 |
| Forecast Period | 2026-2034 |
| Historical Period | 2020-2025 |
| Growth Rate | CAGR of 12.2% from 2020-2034 |
| Segmentation |
|
Table of Contents
- 1. Introduction
- 1.1. Research Scope
- 1.2. Market Segmentation
- 1.3. Research Methodology
- 1.4. Definitions and Assumptions
- 2. Executive Summary
- 2.1. Introduction
- 3. Market Dynamics
- 3.1. Introduction
- 3.2. Market Drivers
- 3.3. Market Restrains
- 3.4. Market Trends
- 4. Market Factor Analysis
- 4.1. Porters Five Forces
- 4.2. Supply/Value Chain
- 4.3. PESTEL analysis
- 4.4. Market Entropy
- 4.5. Patent/Trademark Analysis
- 5. Global Structural Simulation Software Analysis, Insights and Forecast, 2020-2032
- 5.1. Market Analysis, Insights and Forecast - by Application
- 5.1.1. Aerospace
- 5.1.2. Ship Ocean
- 5.1.3. Engine
- 5.1.4. Ground Transportation
- 5.1.5. Building Environment
- 5.1.6. Electronic Device
- 5.1.7. Other
- 5.2. Market Analysis, Insights and Forecast - by Types
- 5.2.1. Mono Functional
- 5.2.2. Multi Functional
- 5.3. Market Analysis, Insights and Forecast - by Region
- 5.3.1. North America
- 5.3.2. South America
- 5.3.3. Europe
- 5.3.4. Middle East & Africa
- 5.3.5. Asia Pacific
- 5.1. Market Analysis, Insights and Forecast - by Application
- 6. North America Structural Simulation Software Analysis, Insights and Forecast, 2020-2032
- 6.1. Market Analysis, Insights and Forecast - by Application
- 6.1.1. Aerospace
- 6.1.2. Ship Ocean
- 6.1.3. Engine
- 6.1.4. Ground Transportation
- 6.1.5. Building Environment
- 6.1.6. Electronic Device
- 6.1.7. Other
- 6.2. Market Analysis, Insights and Forecast - by Types
- 6.2.1. Mono Functional
- 6.2.2. Multi Functional
- 6.1. Market Analysis, Insights and Forecast - by Application
- 7. South America Structural Simulation Software Analysis, Insights and Forecast, 2020-2032
- 7.1. Market Analysis, Insights and Forecast - by Application
- 7.1.1. Aerospace
- 7.1.2. Ship Ocean
- 7.1.3. Engine
- 7.1.4. Ground Transportation
- 7.1.5. Building Environment
- 7.1.6. Electronic Device
- 7.1.7. Other
- 7.2. Market Analysis, Insights and Forecast - by Types
- 7.2.1. Mono Functional
- 7.2.2. Multi Functional
- 7.1. Market Analysis, Insights and Forecast - by Application
- 8. Europe Structural Simulation Software Analysis, Insights and Forecast, 2020-2032
- 8.1. Market Analysis, Insights and Forecast - by Application
- 8.1.1. Aerospace
- 8.1.2. Ship Ocean
- 8.1.3. Engine
- 8.1.4. Ground Transportation
- 8.1.5. Building Environment
- 8.1.6. Electronic Device
- 8.1.7. Other
- 8.2. Market Analysis, Insights and Forecast - by Types
- 8.2.1. Mono Functional
- 8.2.2. Multi Functional
- 8.1. Market Analysis, Insights and Forecast - by Application
- 9. Middle East & Africa Structural Simulation Software Analysis, Insights and Forecast, 2020-2032
- 9.1. Market Analysis, Insights and Forecast - by Application
- 9.1.1. Aerospace
- 9.1.2. Ship Ocean
- 9.1.3. Engine
- 9.1.4. Ground Transportation
- 9.1.5. Building Environment
- 9.1.6. Electronic Device
- 9.1.7. Other
- 9.2. Market Analysis, Insights and Forecast - by Types
- 9.2.1. Mono Functional
- 9.2.2. Multi Functional
- 9.1. Market Analysis, Insights and Forecast - by Application
- 10. Asia Pacific Structural Simulation Software Analysis, Insights and Forecast, 2020-2032
- 10.1. Market Analysis, Insights and Forecast - by Application
- 10.1.1. Aerospace
- 10.1.2. Ship Ocean
- 10.1.3. Engine
- 10.1.4. Ground Transportation
- 10.1.5. Building Environment
- 10.1.6. Electronic Device
- 10.1.7. Other
- 10.2. Market Analysis, Insights and Forecast - by Types
- 10.2.1. Mono Functional
- 10.2.2. Multi Functional
- 10.1. Market Analysis, Insights and Forecast - by Application
- 11. Competitive Analysis
- 11.1. Global Market Share Analysis 2025
- 11.2. Company Profiles
- 11.2.1 Autodesk
- 11.2.1.1. Overview
- 11.2.1.2. Products
- 11.2.1.3. SWOT Analysis
- 11.2.1.4. Recent Developments
- 11.2.1.5. Financials (Based on Availability)
- 11.2.2 Siemens PLM Software
- 11.2.2.1. Overview
- 11.2.2.2. Products
- 11.2.2.3. SWOT Analysis
- 11.2.2.4. Recent Developments
- 11.2.2.5. Financials (Based on Availability)
- 11.2.3 ANSYS
- 11.2.3.1. Overview
- 11.2.3.2. Products
- 11.2.3.3. SWOT Analysis
- 11.2.3.4. Recent Developments
- 11.2.3.5. Financials (Based on Availability)
- 11.2.4 Dassault Systemes
- 11.2.4.1. Overview
- 11.2.4.2. Products
- 11.2.4.3. SWOT Analysis
- 11.2.4.4. Recent Developments
- 11.2.4.5. Financials (Based on Availability)
- 11.2.5 Hexagon AB
- 11.2.5.1. Overview
- 11.2.5.2. Products
- 11.2.5.3. SWOT Analysis
- 11.2.5.4. Recent Developments
- 11.2.5.5. Financials (Based on Availability)
- 11.2.6 Alatir
- 11.2.6.1. Overview
- 11.2.6.2. Products
- 11.2.6.3. SWOT Analysis
- 11.2.6.4. Recent Developments
- 11.2.6.5. Financials (Based on Availability)
- 11.2.7 ESI
- 11.2.7.1. Overview
- 11.2.7.2. Products
- 11.2.7.3. SWOT Analysis
- 11.2.7.4. Recent Developments
- 11.2.7.5. Financials (Based on Availability)
- 11.2.8 PTC
- 11.2.8.1. Overview
- 11.2.8.2. Products
- 11.2.8.3. SWOT Analysis
- 11.2.8.4. Recent Developments
- 11.2.8.5. Financials (Based on Availability)
- 11.2.9 Autodesk
- 11.2.9.1. Overview
- 11.2.9.2. Products
- 11.2.9.3. SWOT Analysis
- 11.2.9.4. Recent Developments
- 11.2.9.5. Financials (Based on Availability)
- 11.2.10 COMSOL Multiphysics
- 11.2.10.1. Overview
- 11.2.10.2. Products
- 11.2.10.3. SWOT Analysis
- 11.2.10.4. Recent Developments
- 11.2.10.5. Financials (Based on Availability)
- 11.2.11 BETA CAE Systems
- 11.2.11.1. Overview
- 11.2.11.2. Products
- 11.2.11.3. SWOT Analysis
- 11.2.11.4. Recent Developments
- 11.2.11.5. Financials (Based on Availability)
- 11.2.12 Magma
- 11.2.12.1. Overview
- 11.2.12.2. Products
- 11.2.12.3. SWOT Analysis
- 11.2.12.4. Recent Developments
- 11.2.12.5. Financials (Based on Availability)
- 11.2.13 CoreTech System
- 11.2.13.1. Overview
- 11.2.13.2. Products
- 11.2.13.3. SWOT Analysis
- 11.2.13.4. Recent Developments
- 11.2.13.5. Financials (Based on Availability)
- 11.2.14 Toray Engineering
- 11.2.14.1. Overview
- 11.2.14.2. Products
- 11.2.14.3. SWOT Analysis
- 11.2.14.4. Recent Developments
- 11.2.14.5. Financials (Based on Availability)
- 11.2.15 Yuanjisuan
- 11.2.15.1. Overview
- 11.2.15.2. Products
- 11.2.15.3. SWOT Analysis
- 11.2.15.4. Recent Developments
- 11.2.15.5. Financials (Based on Availability)
- 11.2.16 SimScale GmbH
- 11.2.16.1. Overview
- 11.2.16.2. Products
- 11.2.16.3. SWOT Analysis
- 11.2.16.4. Recent Developments
- 11.2.16.5. Financials (Based on Availability)
- 11.2.17 Shanghai Suochen Information Technology
- 11.2.17.1. Overview
- 11.2.17.2. Products
- 11.2.17.3. SWOT Analysis
- 11.2.17.4. Recent Developments
- 11.2.17.5. Financials (Based on Availability)
- 11.2.18 ESI ITI GmbH
- 11.2.18.1. Overview
- 11.2.18.2. Products
- 11.2.18.3. SWOT Analysis
- 11.2.18.4. Recent Developments
- 11.2.18.5. Financials (Based on Availability)
- 11.2.19 CD-adapco
- 11.2.19.1. Overview
- 11.2.19.2. Products
- 11.2.19.3. SWOT Analysis
- 11.2.19.4. Recent Developments
- 11.2.19.5. Financials (Based on Availability)
- 11.2.20 Phoenix
- 11.2.20.1. Overview
- 11.2.20.2. Products
- 11.2.20.3. SWOT Analysis
- 11.2.20.4. Recent Developments
- 11.2.20.5. Financials (Based on Availability)
- 11.2.1 Autodesk
List of Figures
- Figure 1: Global Structural Simulation Software Revenue Breakdown (undefined, %) by Region 2025 & 2033
- Figure 2: North America Structural Simulation Software Revenue (undefined), by Application 2025 & 2033
- Figure 3: North America Structural Simulation Software Revenue Share (%), by Application 2025 & 2033
- Figure 4: North America Structural Simulation Software Revenue (undefined), by Types 2025 & 2033
- Figure 5: North America Structural Simulation Software Revenue Share (%), by Types 2025 & 2033
- Figure 6: North America Structural Simulation Software Revenue (undefined), by Country 2025 & 2033
- Figure 7: North America Structural Simulation Software Revenue Share (%), by Country 2025 & 2033
- Figure 8: South America Structural Simulation Software Revenue (undefined), by Application 2025 & 2033
- Figure 9: South America Structural Simulation Software Revenue Share (%), by Application 2025 & 2033
- Figure 10: South America Structural Simulation Software Revenue (undefined), by Types 2025 & 2033
- Figure 11: South America Structural Simulation Software Revenue Share (%), by Types 2025 & 2033
- Figure 12: South America Structural Simulation Software Revenue (undefined), by Country 2025 & 2033
- Figure 13: South America Structural Simulation Software Revenue Share (%), by Country 2025 & 2033
- Figure 14: Europe Structural Simulation Software Revenue (undefined), by Application 2025 & 2033
- Figure 15: Europe Structural Simulation Software Revenue Share (%), by Application 2025 & 2033
- Figure 16: Europe Structural Simulation Software Revenue (undefined), by Types 2025 & 2033
- Figure 17: Europe Structural Simulation Software Revenue Share (%), by Types 2025 & 2033
- Figure 18: Europe Structural Simulation Software Revenue (undefined), by Country 2025 & 2033
- Figure 19: Europe Structural Simulation Software Revenue Share (%), by Country 2025 & 2033
- Figure 20: Middle East & Africa Structural Simulation Software Revenue (undefined), by Application 2025 & 2033
- Figure 21: Middle East & Africa Structural Simulation Software Revenue Share (%), by Application 2025 & 2033
- Figure 22: Middle East & Africa Structural Simulation Software Revenue (undefined), by Types 2025 & 2033
- Figure 23: Middle East & Africa Structural Simulation Software Revenue Share (%), by Types 2025 & 2033
- Figure 24: Middle East & Africa Structural Simulation Software Revenue (undefined), by Country 2025 & 2033
- Figure 25: Middle East & Africa Structural Simulation Software Revenue Share (%), by Country 2025 & 2033
- Figure 26: Asia Pacific Structural Simulation Software Revenue (undefined), by Application 2025 & 2033
- Figure 27: Asia Pacific Structural Simulation Software Revenue Share (%), by Application 2025 & 2033
- Figure 28: Asia Pacific Structural Simulation Software Revenue (undefined), by Types 2025 & 2033
- Figure 29: Asia Pacific Structural Simulation Software Revenue Share (%), by Types 2025 & 2033
- Figure 30: Asia Pacific Structural Simulation Software Revenue (undefined), by Country 2025 & 2033
- Figure 31: Asia Pacific Structural Simulation Software Revenue Share (%), by Country 2025 & 2033
List of Tables
- Table 1: Global Structural Simulation Software Revenue undefined Forecast, by Application 2020 & 2033
- Table 2: Global Structural Simulation Software Revenue undefined Forecast, by Types 2020 & 2033
- Table 3: Global Structural Simulation Software Revenue undefined Forecast, by Region 2020 & 2033
- Table 4: Global Structural Simulation Software Revenue undefined Forecast, by Application 2020 & 2033
- Table 5: Global Structural Simulation Software Revenue undefined Forecast, by Types 2020 & 2033
- Table 6: Global Structural Simulation Software Revenue undefined Forecast, by Country 2020 & 2033
- Table 7: United States Structural Simulation Software Revenue (undefined) Forecast, by Application 2020 & 2033
- Table 8: Canada Structural Simulation Software Revenue (undefined) Forecast, by Application 2020 & 2033
- Table 9: Mexico Structural Simulation Software Revenue (undefined) Forecast, by Application 2020 & 2033
- Table 10: Global Structural Simulation Software Revenue undefined Forecast, by Application 2020 & 2033
- Table 11: Global Structural Simulation Software Revenue undefined Forecast, by Types 2020 & 2033
- Table 12: Global Structural Simulation Software Revenue undefined Forecast, by Country 2020 & 2033
- Table 13: Brazil Structural Simulation Software Revenue (undefined) Forecast, by Application 2020 & 2033
- Table 14: Argentina Structural Simulation Software Revenue (undefined) Forecast, by Application 2020 & 2033
- Table 15: Rest of South America Structural Simulation Software Revenue (undefined) Forecast, by Application 2020 & 2033
- Table 16: Global Structural Simulation Software Revenue undefined Forecast, by Application 2020 & 2033
- Table 17: Global Structural Simulation Software Revenue undefined Forecast, by Types 2020 & 2033
- Table 18: Global Structural Simulation Software Revenue undefined Forecast, by Country 2020 & 2033
- Table 19: United Kingdom Structural Simulation Software Revenue (undefined) Forecast, by Application 2020 & 2033
- Table 20: Germany Structural Simulation Software Revenue (undefined) Forecast, by Application 2020 & 2033
- Table 21: France Structural Simulation Software Revenue (undefined) Forecast, by Application 2020 & 2033
- Table 22: Italy Structural Simulation Software Revenue (undefined) Forecast, by Application 2020 & 2033
- Table 23: Spain Structural Simulation Software Revenue (undefined) Forecast, by Application 2020 & 2033
- Table 24: Russia Structural Simulation Software Revenue (undefined) Forecast, by Application 2020 & 2033
- Table 25: Benelux Structural Simulation Software Revenue (undefined) Forecast, by Application 2020 & 2033
- Table 26: Nordics Structural Simulation Software Revenue (undefined) Forecast, by Application 2020 & 2033
- Table 27: Rest of Europe Structural Simulation Software Revenue (undefined) Forecast, by Application 2020 & 2033
- Table 28: Global Structural Simulation Software Revenue undefined Forecast, by Application 2020 & 2033
- Table 29: Global Structural Simulation Software Revenue undefined Forecast, by Types 2020 & 2033
- Table 30: Global Structural Simulation Software Revenue undefined Forecast, by Country 2020 & 2033
- Table 31: Turkey Structural Simulation Software Revenue (undefined) Forecast, by Application 2020 & 2033
- Table 32: Israel Structural Simulation Software Revenue (undefined) Forecast, by Application 2020 & 2033
- Table 33: GCC Structural Simulation Software Revenue (undefined) Forecast, by Application 2020 & 2033
- Table 34: North Africa Structural Simulation Software Revenue (undefined) Forecast, by Application 2020 & 2033
- Table 35: South Africa Structural Simulation Software Revenue (undefined) Forecast, by Application 2020 & 2033
- Table 36: Rest of Middle East & Africa Structural Simulation Software Revenue (undefined) Forecast, by Application 2020 & 2033
- Table 37: Global Structural Simulation Software Revenue undefined Forecast, by Application 2020 & 2033
- Table 38: Global Structural Simulation Software Revenue undefined Forecast, by Types 2020 & 2033
- Table 39: Global Structural Simulation Software Revenue undefined Forecast, by Country 2020 & 2033
- Table 40: China Structural Simulation Software Revenue (undefined) Forecast, by Application 2020 & 2033
- Table 41: India Structural Simulation Software Revenue (undefined) Forecast, by Application 2020 & 2033
- Table 42: Japan Structural Simulation Software Revenue (undefined) Forecast, by Application 2020 & 2033
- Table 43: South Korea Structural Simulation Software Revenue (undefined) Forecast, by Application 2020 & 2033
- Table 44: ASEAN Structural Simulation Software Revenue (undefined) Forecast, by Application 2020 & 2033
- Table 45: Oceania Structural Simulation Software Revenue (undefined) Forecast, by Application 2020 & 2033
- Table 46: Rest of Asia Pacific Structural Simulation Software Revenue (undefined) Forecast, by Application 2020 & 2033
Frequently Asked Questions
1. What is the projected Compound Annual Growth Rate (CAGR) of the Structural Simulation Software?
The projected CAGR is approximately 12.2%.
2. Which companies are prominent players in the Structural Simulation Software?
Key companies in the market include Autodesk, Siemens PLM Software, ANSYS, Dassault Systemes, Hexagon AB, Alatir, ESI, PTC, Autodesk, COMSOL Multiphysics, BETA CAE Systems, Magma, CoreTech System, Toray Engineering, Yuanjisuan, SimScale GmbH, Shanghai Suochen Information Technology, ESI ITI GmbH, CD-adapco, Phoenix.
3. What are the main segments of the Structural Simulation Software?
The market segments include Application, Types.
4. Can you provide details about the market size?
The market size is estimated to be USD XXX N/A as of 2022.
5. What are some drivers contributing to market growth?
N/A
6. What are the notable trends driving market growth?
N/A
7. Are there any restraints impacting market growth?
N/A
8. Can you provide examples of recent developments in the market?
N/A
9. What pricing options are available for accessing the report?
Pricing options include single-user, multi-user, and enterprise licenses priced at USD 3350.00, USD 5025.00, and USD 6700.00 respectively.
10. Is the market size provided in terms of value or volume?
The market size is provided in terms of value, measured in N/A.
11. Are there any specific market keywords associated with the report?
Yes, the market keyword associated with the report is "Structural Simulation Software," which aids in identifying and referencing the specific market segment covered.
12. How do I determine which pricing option suits my needs best?
The pricing options vary based on user requirements and access needs. Individual users may opt for single-user licenses, while businesses requiring broader access may choose multi-user or enterprise licenses for cost-effective access to the report.
13. Are there any additional resources or data provided in the Structural Simulation Software report?
While the report offers comprehensive insights, it's advisable to review the specific contents or supplementary materials provided to ascertain if additional resources or data are available.
14. How can I stay updated on further developments or reports in the Structural Simulation Software?
To stay informed about further developments, trends, and reports in the Structural Simulation Software, consider subscribing to industry newsletters, following relevant companies and organizations, or regularly checking reputable industry news sources and publications.
Methodology
Step 1 - Identification of Relevant Samples Size from Population Database


Step 2 - Approaches for Defining Global Market Size (Value, Volume* & Price*)

Note*: In applicable scenarios
Step 3 - Data Sources
Primary Research
- Web Analytics
- Survey Reports
- Research Institute
- Latest Research Reports
- Opinion Leaders
Secondary Research
- Annual Reports
- White Paper
- Latest Press Release
- Industry Association
- Paid Database
- Investor Presentations

Step 4 - Data Triangulation
Involves using different sources of information in order to increase the validity of a study
These sources are likely to be stakeholders in a program - participants, other researchers, program staff, other community members, and so on.
Then we put all data in single framework & apply various statistical tools to find out the dynamic on the market.
During the analysis stage, feedback from the stakeholder groups would be compared to determine areas of agreement as well as areas of divergence