

Key Insights
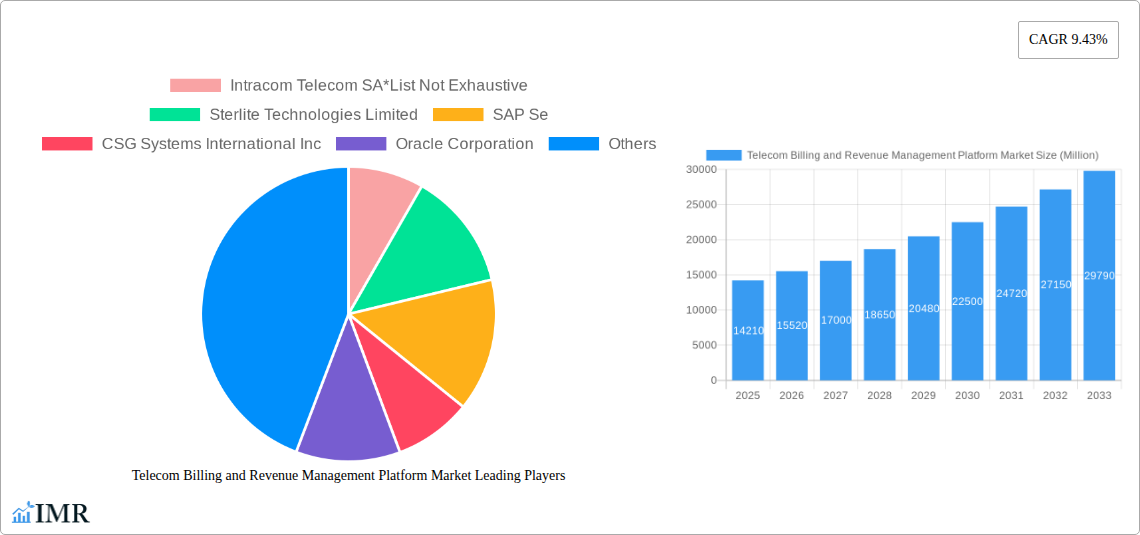
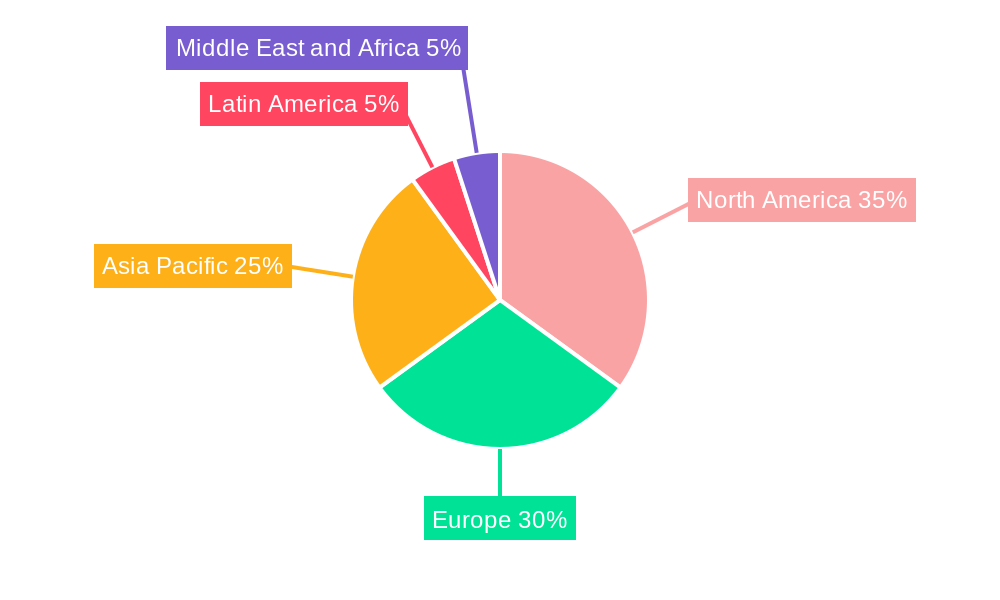
The Telecom Billing and Revenue Management Platform market, valued at $14.21 billion in 2025, is projected to experience robust growth, driven by the increasing demand for advanced billing solutions, the rising adoption of cloud-based platforms, and the need for real-time billing capabilities to support 5G and IoT services. The market's Compound Annual Growth Rate (CAGR) of 9.43% from 2025 to 2033 indicates substantial expansion over the forecast period. Key drivers include the need for improved operational efficiency, enhanced customer experience through personalized billing and flexible payment options, and the imperative to manage complex pricing models for bundled services and diverse network technologies. The shift towards cloud deployment offers scalability, cost-effectiveness, and improved agility, fueling market growth. However, factors such as the high initial investment costs for implementing new systems and the complexity of integrating legacy systems with new platforms might act as restraints. The market is segmented by deployment (on-premise, cloud), type (software, service), and operator (mobile operator, internet service provider). North America and Europe currently hold significant market share, driven by early adoption and technological advancements, but the Asia-Pacific region is expected to witness rapid growth due to increasing smartphone penetration and rising data consumption. Major players like Ericsson, Nokia, and SAP are actively shaping the market landscape through continuous innovation and strategic partnerships.
The competitive landscape is characterized by a mix of established players and emerging technology providers. Established players leverage their extensive experience and customer base to maintain their market position, while emerging players bring innovative solutions and disruptive technologies to the market. The ongoing digital transformation within the telecom industry necessitates a continuous upgrade of billing and revenue management systems. The market is expected to see further consolidation through mergers and acquisitions, particularly as companies seek to expand their capabilities in areas such as AI-powered billing and revenue assurance. Future growth will depend on factors such as the successful integration of 5G and IoT technologies into billing systems, the development of advanced analytics capabilities to optimize revenue generation and reduce churn, and the evolution of payment methods to accommodate increasingly diverse customer preferences. The market's future trajectory is optimistic, with continued growth propelled by technological advancements and the evolving needs of the telecom industry.
Telecom Billing and Revenue Management Platform Market: A Comprehensive Report (2019-2033)
This in-depth report provides a comprehensive analysis of the Telecom Billing and Revenue Management Platform market, encompassing market dynamics, growth trends, regional analysis, competitive landscape, and future outlook. The study period covers 2019-2033, with 2025 as the base year and a forecast period of 2025-2033. The report offers invaluable insights for telecom operators, software providers, investors, and industry professionals seeking to understand and capitalize on this rapidly evolving market. The total market size is estimated at XX Million in 2025.
Telecom Billing and Revenue Management Platform Market Dynamics & Structure
This section analyzes the market's competitive landscape, technological advancements, regulatory influences, and market trends. The global Telecom Billing and Revenue Management Platform market exhibits a moderately concentrated structure, with key players holding significant market share. However, the emergence of innovative solutions and new entrants is driving increased competition. The market is characterized by continuous technological innovation, with players investing heavily in cloud-based solutions, AI-powered analytics, and advanced automation capabilities.
- Market Concentration: The top 5 players account for approximately xx% of the market share in 2025.
- Technological Drivers: Cloud computing, AI, and 5G network deployments are key drivers of innovation.
- Regulatory Framework: Government regulations concerning data privacy and security significantly impact market strategies.
- Competitive Substitutes: Open-source billing solutions and legacy systems pose competition to established players.
- M&A Trends: The market has witnessed xx M&A deals in the past five years, indicating consolidation and strategic growth.
- Innovation Barriers: High development costs and integration complexities pose challenges to new entrants.
Telecom Billing and Revenue Management Platform Market Growth Trends & Insights
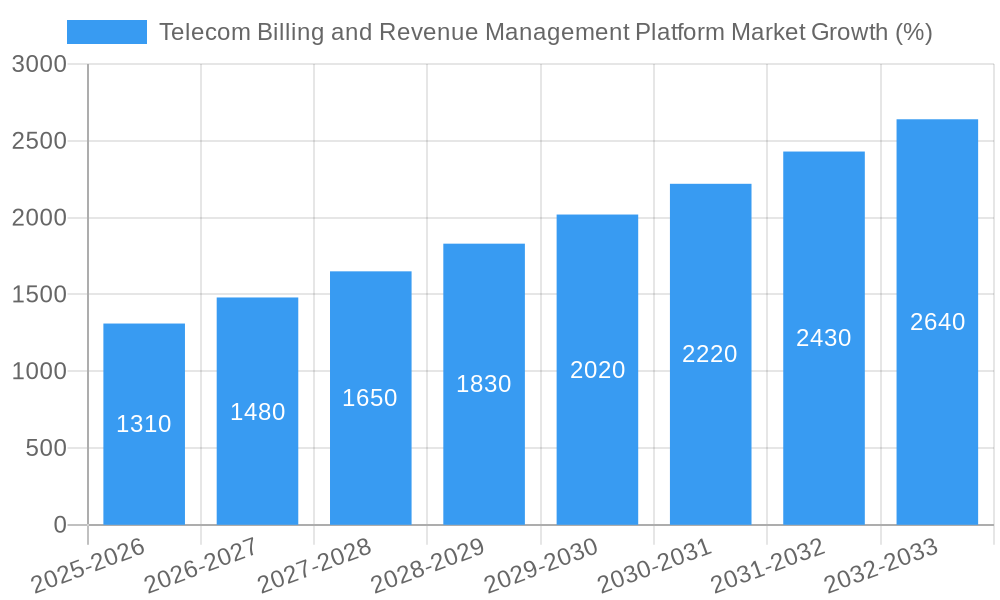
The Telecom Billing and Revenue Management Platform market has witnessed robust growth during the historical period (2019-2024), driven by increasing demand for advanced billing and revenue management solutions from telecom operators. The market is expected to continue its expansion throughout the forecast period (2025-2033), fueled by factors such as the widespread adoption of 5G technology, the rise of digital services, and the need for efficient revenue management practices. The market is expected to register a CAGR of xx% during the forecast period, reaching a value of xx Million by 2033. Market penetration is expected to increase from xx% in 2025 to xx% by 2033. Technological disruptions like cloud migration and AI integration are accelerating this growth. Consumer behaviour is shifting towards greater demand for personalized and data-driven billing solutions.
Dominant Regions, Countries, or Segments in Telecom Billing and Revenue Management Platform Market
North America currently holds the largest market share, driven by early adoption of advanced technologies and high spending on digital infrastructure. However, the Asia-Pacific region is poised for significant growth, fueled by rapid 5G deployment and increasing smartphone penetration.
By Deployment:
- Cloud: The cloud segment is experiencing the fastest growth, driven by scalability, cost-effectiveness, and improved security.
- On-Premise: The on-premise segment continues to hold a significant share, particularly among established operators with legacy systems.
By Type:
- Software: Software solutions dominate the market, offering flexible and customizable billing and revenue management capabilities.
- Service: Service offerings, including implementation, integration, and support services, are experiencing significant growth.
By Operator:
- Mobile Operators: Mobile operators represent the largest segment, with significant investments in advanced billing and revenue management solutions.
- Internet Service Providers: The ISP segment is experiencing growth, driven by the increasing demand for broadband services and bundled offerings.
Key drivers for growth in specific regions include robust economic growth, supportive government policies promoting digital transformation, and extensive investment in network infrastructure.
Telecom Billing and Revenue Management Platform Market Product Landscape
The market offers a diverse range of products catering to different operator needs, from basic billing systems to sophisticated revenue management platforms incorporating AI and machine learning. These solutions offer features such as real-time rating, automated billing, fraud detection, and advanced analytics to optimize revenue generation. Key product innovations include cloud-native architectures, AI-powered revenue assurance, and improved customer self-service portals.
Key Drivers, Barriers & Challenges in Telecom Billing and Revenue Management Platform Market
Key Drivers:
- Increasing demand for advanced billing and revenue management capabilities from telecom operators.
- The growing adoption of 5G technology, which necessitates robust billing systems.
- The rise of digital services and the need for efficient revenue management practices.
Challenges & Restraints:
- High initial investment costs for implementing new billing platforms.
- Integration complexities associated with legacy systems.
- Concerns about data security and privacy. These restraints may reduce adoption, particularly among smaller operators with limited budgets. The estimated impact is a reduction in market growth of approximately xx% by 2030.
Emerging Opportunities in Telecom Billing and Revenue Management Platform Market
- Growth in the IoT sector: Demand for billing platforms capable of handling large volumes of IoT data.
- Expansion into untapped markets: Growth potential in emerging economies with increasing telecom penetration.
- Development of AI-powered billing solutions: Advanced analytics and automation for enhanced revenue management.
Growth Accelerators in the Telecom Billing and Revenue Management Platform Market Industry
Technological advancements, strategic partnerships, and expansion into new markets are crucial accelerators. Cloud-based solutions, AI integration, and 5G deployment are significantly contributing to growth. Successful partnerships between telecom operators and technology providers are fostering innovation and accelerating adoption. Expansion into untapped markets in emerging regions presents substantial growth opportunities.
Key Players Shaping the Telecom Billing and Revenue Management Platform Market Market
- Intracom Telecom SA
- Sterlite Technologies Limited
- SAP SE
- CSG Systems International Inc
- Oracle Corporation
- Comarch SA
- Enghouse Networks
- NetCracker Technology Corporation
- Nokia
- Huawei Technologies
- Optiva Inc
- Ericsson
Notable Milestones in Telecom Billing and Revenue Management Platform Market Sector
- March 2023: Spectrum Enterprise partnered with Netcracker Technology, expanding their collaboration and showcasing the adoption of Netcracker's Revenue Management solution.
- October 2022: Ericsson and Jio collaborated on India's first 5G standalone network, highlighting the significance of advanced network infrastructure and its impact on billing system requirements.
In-Depth Telecom Billing and Revenue Management Platform Market Market Outlook
The Telecom Billing and Revenue Management Platform market is projected to experience continued robust growth, driven by ongoing technological advancements, increasing demand for digital services, and the expansion of 5G networks. Strategic partnerships, focus on innovation, and expansion into new markets will be key factors in shaping the future of the market. The market's potential remains significant, presenting attractive opportunities for both established players and new entrants.
Telecom Billing and Revenue Management Platform Market Segmentation
-
1. Deployment
- 1.1. On-premise
- 1.2. Cloud
-
2. Type
- 2.1. Software
- 2.2. Service
-
3. Operator
- 3.1. Mobile Operator
- 3.2. Internet Service Provider
Telecom Billing and Revenue Management Platform Market Segmentation By Geography
-
1. North America
- 1.1. US
- 1.2. Canada
-
2. Europe
- 2.1. Germany
- 2.2. UK
- 2.3. France
- 2.4. Rest of Europe
-
3. Asia Pacific
- 3.1. India
- 3.2. China
- 3.3. Japan
- 3.4. Rest of Asia Pacific
- 4. Latin America
- 5. Middle East and Africa
Telecom Billing and Revenue Management Platform Market REPORT HIGHLIGHTS
| Aspects | Details |
|---|---|
| Study Period | 2019-2033 |
| Base Year | 2024 |
| Estimated Year | 2025 |
| Forecast Period | 2025-2033 |
| Historical Period | 2019-2024 |
| Growth Rate | CAGR of 9.43% from 2019-2033 |
| Segmentation |
|
Table of Contents
- 1. Introduction
- 1.1. Research Scope
- 1.2. Market Segmentation
- 1.3. Research Methodology
- 1.4. Definitions and Assumptions
- 2. Executive Summary
- 2.1. Introduction
- 3. Market Dynamics
- 3.1. Introduction
- 3.2. Market Drivers
- 3.2.1. Growing Number of Cellular or Mobile Subscribers; Growing Complexities in Revenue Sharing Across the Telecom Ecosystem
- 3.3. Market Restrains
- 3.3.1. Presence of Stringent Telecom Regulations
- 3.4. Market Trends
- 3.4.1. Mobile Operators to Account Major Market Share
- 4. Market Factor Analysis
- 4.1. Porters Five Forces
- 4.2. Supply/Value Chain
- 4.3. PESTEL analysis
- 4.4. Market Entropy
- 4.5. Patent/Trademark Analysis
- 5. Global Telecom Billing and Revenue Management Platform Market Analysis, Insights and Forecast, 2019-2031
- 5.1. Market Analysis, Insights and Forecast - by Deployment
- 5.1.1. On-premise
- 5.1.2. Cloud
- 5.2. Market Analysis, Insights and Forecast - by Type
- 5.2.1. Software
- 5.2.2. Service
- 5.3. Market Analysis, Insights and Forecast - by Operator
- 5.3.1. Mobile Operator
- 5.3.2. Internet Service Provider
- 5.4. Market Analysis, Insights and Forecast - by Region
- 5.4.1. North America
- 5.4.2. Europe
- 5.4.3. Asia Pacific
- 5.4.4. Latin America
- 5.4.5. Middle East and Africa
- 5.1. Market Analysis, Insights and Forecast - by Deployment
- 6. North America Telecom Billing and Revenue Management Platform Market Analysis, Insights and Forecast, 2019-2031
- 6.1. Market Analysis, Insights and Forecast - by Deployment
- 6.1.1. On-premise
- 6.1.2. Cloud
- 6.2. Market Analysis, Insights and Forecast - by Type
- 6.2.1. Software
- 6.2.2. Service
- 6.3. Market Analysis, Insights and Forecast - by Operator
- 6.3.1. Mobile Operator
- 6.3.2. Internet Service Provider
- 6.1. Market Analysis, Insights and Forecast - by Deployment
- 7. Europe Telecom Billing and Revenue Management Platform Market Analysis, Insights and Forecast, 2019-2031
- 7.1. Market Analysis, Insights and Forecast - by Deployment
- 7.1.1. On-premise
- 7.1.2. Cloud
- 7.2. Market Analysis, Insights and Forecast - by Type
- 7.2.1. Software
- 7.2.2. Service
- 7.3. Market Analysis, Insights and Forecast - by Operator
- 7.3.1. Mobile Operator
- 7.3.2. Internet Service Provider
- 7.1. Market Analysis, Insights and Forecast - by Deployment
- 8. Asia Pacific Telecom Billing and Revenue Management Platform Market Analysis, Insights and Forecast, 2019-2031
- 8.1. Market Analysis, Insights and Forecast - by Deployment
- 8.1.1. On-premise
- 8.1.2. Cloud
- 8.2. Market Analysis, Insights and Forecast - by Type
- 8.2.1. Software
- 8.2.2. Service
- 8.3. Market Analysis, Insights and Forecast - by Operator
- 8.3.1. Mobile Operator
- 8.3.2. Internet Service Provider
- 8.1. Market Analysis, Insights and Forecast - by Deployment
- 9. Latin America Telecom Billing and Revenue Management Platform Market Analysis, Insights and Forecast, 2019-2031
- 9.1. Market Analysis, Insights and Forecast - by Deployment
- 9.1.1. On-premise
- 9.1.2. Cloud
- 9.2. Market Analysis, Insights and Forecast - by Type
- 9.2.1. Software
- 9.2.2. Service
- 9.3. Market Analysis, Insights and Forecast - by Operator
- 9.3.1. Mobile Operator
- 9.3.2. Internet Service Provider
- 9.1. Market Analysis, Insights and Forecast - by Deployment
- 10. Middle East and Africa Telecom Billing and Revenue Management Platform Market Analysis, Insights and Forecast, 2019-2031
- 10.1. Market Analysis, Insights and Forecast - by Deployment
- 10.1.1. On-premise
- 10.1.2. Cloud
- 10.2. Market Analysis, Insights and Forecast - by Type
- 10.2.1. Software
- 10.2.2. Service
- 10.3. Market Analysis, Insights and Forecast - by Operator
- 10.3.1. Mobile Operator
- 10.3.2. Internet Service Provider
- 10.1. Market Analysis, Insights and Forecast - by Deployment
- 11. North America Telecom Billing and Revenue Management Platform Market Analysis, Insights and Forecast, 2019-2031
- 11.1. Market Analysis, Insights and Forecast - By Country/Sub-region
- 11.1.1 US
- 11.1.2 Canada
- 12. Europe Telecom Billing and Revenue Management Platform Market Analysis, Insights and Forecast, 2019-2031
- 12.1. Market Analysis, Insights and Forecast - By Country/Sub-region
- 12.1.1 Germany
- 12.1.2 UK
- 12.1.3 France
- 12.1.4 Rest of Europe
- 13. Asia Pacific Telecom Billing and Revenue Management Platform Market Analysis, Insights and Forecast, 2019-2031
- 13.1. Market Analysis, Insights and Forecast - By Country/Sub-region
- 13.1.1 India
- 13.1.2 China
- 13.1.3 Japan
- 13.1.4 Rest of Asia Pacific
- 14. Latin America Telecom Billing and Revenue Management Platform Market Analysis, Insights and Forecast, 2019-2031
- 14.1. Market Analysis, Insights and Forecast - By Country/Sub-region
- 14.1.1.
- 15. Middle East and Africa Telecom Billing and Revenue Management Platform Market Analysis, Insights and Forecast, 2019-2031
- 15.1. Market Analysis, Insights and Forecast - By Country/Sub-region
- 15.1.1.
- 16. Competitive Analysis
- 16.1. Global Market Share Analysis 2024
- 16.2. Company Profiles
- 16.2.1 Intracom Telecom SA*List Not Exhaustive
- 16.2.1.1. Overview
- 16.2.1.2. Products
- 16.2.1.3. SWOT Analysis
- 16.2.1.4. Recent Developments
- 16.2.1.5. Financials (Based on Availability)
- 16.2.2 Sterlite Technologies Limited
- 16.2.2.1. Overview
- 16.2.2.2. Products
- 16.2.2.3. SWOT Analysis
- 16.2.2.4. Recent Developments
- 16.2.2.5. Financials (Based on Availability)
- 16.2.3 SAP Se
- 16.2.3.1. Overview
- 16.2.3.2. Products
- 16.2.3.3. SWOT Analysis
- 16.2.3.4. Recent Developments
- 16.2.3.5. Financials (Based on Availability)
- 16.2.4 CSG Systems International Inc
- 16.2.4.1. Overview
- 16.2.4.2. Products
- 16.2.4.3. SWOT Analysis
- 16.2.4.4. Recent Developments
- 16.2.4.5. Financials (Based on Availability)
- 16.2.5 Oracle Corporation
- 16.2.5.1. Overview
- 16.2.5.2. Products
- 16.2.5.3. SWOT Analysis
- 16.2.5.4. Recent Developments
- 16.2.5.5. Financials (Based on Availability)
- 16.2.6 Comarch SA
- 16.2.6.1. Overview
- 16.2.6.2. Products
- 16.2.6.3. SWOT Analysis
- 16.2.6.4. Recent Developments
- 16.2.6.5. Financials (Based on Availability)
- 16.2.7 Enghouse Networks
- 16.2.7.1. Overview
- 16.2.7.2. Products
- 16.2.7.3. SWOT Analysis
- 16.2.7.4. Recent Developments
- 16.2.7.5. Financials (Based on Availability)
- 16.2.8 NetCracker Technology Corporation
- 16.2.8.1. Overview
- 16.2.8.2. Products
- 16.2.8.3. SWOT Analysis
- 16.2.8.4. Recent Developments
- 16.2.8.5. Financials (Based on Availability)
- 16.2.9 Nokia
- 16.2.9.1. Overview
- 16.2.9.2. Products
- 16.2.9.3. SWOT Analysis
- 16.2.9.4. Recent Developments
- 16.2.9.5. Financials (Based on Availability)
- 16.2.10 Huawei Technologies
- 16.2.10.1. Overview
- 16.2.10.2. Products
- 16.2.10.3. SWOT Analysis
- 16.2.10.4. Recent Developments
- 16.2.10.5. Financials (Based on Availability)
- 16.2.11 Optiva Inc
- 16.2.11.1. Overview
- 16.2.11.2. Products
- 16.2.11.3. SWOT Analysis
- 16.2.11.4. Recent Developments
- 16.2.11.5. Financials (Based on Availability)
- 16.2.12 Ericsson
- 16.2.12.1. Overview
- 16.2.12.2. Products
- 16.2.12.3. SWOT Analysis
- 16.2.12.4. Recent Developments
- 16.2.12.5. Financials (Based on Availability)
- 16.2.1 Intracom Telecom SA*List Not Exhaustive
List of Figures
- Figure 1: Global Telecom Billing and Revenue Management Platform Market Revenue Breakdown (Million, %) by Region 2024 & 2032
- Figure 2: North America Telecom Billing and Revenue Management Platform Market Revenue (Million), by Country 2024 & 2032
- Figure 3: North America Telecom Billing and Revenue Management Platform Market Revenue Share (%), by Country 2024 & 2032
- Figure 4: Europe Telecom Billing and Revenue Management Platform Market Revenue (Million), by Country 2024 & 2032
- Figure 5: Europe Telecom Billing and Revenue Management Platform Market Revenue Share (%), by Country 2024 & 2032
- Figure 6: Asia Pacific Telecom Billing and Revenue Management Platform Market Revenue (Million), by Country 2024 & 2032
- Figure 7: Asia Pacific Telecom Billing and Revenue Management Platform Market Revenue Share (%), by Country 2024 & 2032
- Figure 8: Latin America Telecom Billing and Revenue Management Platform Market Revenue (Million), by Country 2024 & 2032
- Figure 9: Latin America Telecom Billing and Revenue Management Platform Market Revenue Share (%), by Country 2024 & 2032
- Figure 10: Middle East and Africa Telecom Billing and Revenue Management Platform Market Revenue (Million), by Country 2024 & 2032
- Figure 11: Middle East and Africa Telecom Billing and Revenue Management Platform Market Revenue Share (%), by Country 2024 & 2032
- Figure 12: North America Telecom Billing and Revenue Management Platform Market Revenue (Million), by Deployment 2024 & 2032
- Figure 13: North America Telecom Billing and Revenue Management Platform Market Revenue Share (%), by Deployment 2024 & 2032
- Figure 14: North America Telecom Billing and Revenue Management Platform Market Revenue (Million), by Type 2024 & 2032
- Figure 15: North America Telecom Billing and Revenue Management Platform Market Revenue Share (%), by Type 2024 & 2032
- Figure 16: North America Telecom Billing and Revenue Management Platform Market Revenue (Million), by Operator 2024 & 2032
- Figure 17: North America Telecom Billing and Revenue Management Platform Market Revenue Share (%), by Operator 2024 & 2032
- Figure 18: North America Telecom Billing and Revenue Management Platform Market Revenue (Million), by Country 2024 & 2032
- Figure 19: North America Telecom Billing and Revenue Management Platform Market Revenue Share (%), by Country 2024 & 2032
- Figure 20: Europe Telecom Billing and Revenue Management Platform Market Revenue (Million), by Deployment 2024 & 2032
- Figure 21: Europe Telecom Billing and Revenue Management Platform Market Revenue Share (%), by Deployment 2024 & 2032
- Figure 22: Europe Telecom Billing and Revenue Management Platform Market Revenue (Million), by Type 2024 & 2032
- Figure 23: Europe Telecom Billing and Revenue Management Platform Market Revenue Share (%), by Type 2024 & 2032
- Figure 24: Europe Telecom Billing and Revenue Management Platform Market Revenue (Million), by Operator 2024 & 2032
- Figure 25: Europe Telecom Billing and Revenue Management Platform Market Revenue Share (%), by Operator 2024 & 2032
- Figure 26: Europe Telecom Billing and Revenue Management Platform Market Revenue (Million), by Country 2024 & 2032
- Figure 27: Europe Telecom Billing and Revenue Management Platform Market Revenue Share (%), by Country 2024 & 2032
- Figure 28: Asia Pacific Telecom Billing and Revenue Management Platform Market Revenue (Million), by Deployment 2024 & 2032
- Figure 29: Asia Pacific Telecom Billing and Revenue Management Platform Market Revenue Share (%), by Deployment 2024 & 2032
- Figure 30: Asia Pacific Telecom Billing and Revenue Management Platform Market Revenue (Million), by Type 2024 & 2032
- Figure 31: Asia Pacific Telecom Billing and Revenue Management Platform Market Revenue Share (%), by Type 2024 & 2032
- Figure 32: Asia Pacific Telecom Billing and Revenue Management Platform Market Revenue (Million), by Operator 2024 & 2032
- Figure 33: Asia Pacific Telecom Billing and Revenue Management Platform Market Revenue Share (%), by Operator 2024 & 2032
- Figure 34: Asia Pacific Telecom Billing and Revenue Management Platform Market Revenue (Million), by Country 2024 & 2032
- Figure 35: Asia Pacific Telecom Billing and Revenue Management Platform Market Revenue Share (%), by Country 2024 & 2032
- Figure 36: Latin America Telecom Billing and Revenue Management Platform Market Revenue (Million), by Deployment 2024 & 2032
- Figure 37: Latin America Telecom Billing and Revenue Management Platform Market Revenue Share (%), by Deployment 2024 & 2032
- Figure 38: Latin America Telecom Billing and Revenue Management Platform Market Revenue (Million), by Type 2024 & 2032
- Figure 39: Latin America Telecom Billing and Revenue Management Platform Market Revenue Share (%), by Type 2024 & 2032
- Figure 40: Latin America Telecom Billing and Revenue Management Platform Market Revenue (Million), by Operator 2024 & 2032
- Figure 41: Latin America Telecom Billing and Revenue Management Platform Market Revenue Share (%), by Operator 2024 & 2032
- Figure 42: Latin America Telecom Billing and Revenue Management Platform Market Revenue (Million), by Country 2024 & 2032
- Figure 43: Latin America Telecom Billing and Revenue Management Platform Market Revenue Share (%), by Country 2024 & 2032
- Figure 44: Middle East and Africa Telecom Billing and Revenue Management Platform Market Revenue (Million), by Deployment 2024 & 2032
- Figure 45: Middle East and Africa Telecom Billing and Revenue Management Platform Market Revenue Share (%), by Deployment 2024 & 2032
- Figure 46: Middle East and Africa Telecom Billing and Revenue Management Platform Market Revenue (Million), by Type 2024 & 2032
- Figure 47: Middle East and Africa Telecom Billing and Revenue Management Platform Market Revenue Share (%), by Type 2024 & 2032
- Figure 48: Middle East and Africa Telecom Billing and Revenue Management Platform Market Revenue (Million), by Operator 2024 & 2032
- Figure 49: Middle East and Africa Telecom Billing and Revenue Management Platform Market Revenue Share (%), by Operator 2024 & 2032
- Figure 50: Middle East and Africa Telecom Billing and Revenue Management Platform Market Revenue (Million), by Country 2024 & 2032
- Figure 51: Middle East and Africa Telecom Billing and Revenue Management Platform Market Revenue Share (%), by Country 2024 & 2032
List of Tables
- Table 1: Global Telecom Billing and Revenue Management Platform Market Revenue Million Forecast, by Region 2019 & 2032
- Table 2: Global Telecom Billing and Revenue Management Platform Market Revenue Million Forecast, by Deployment 2019 & 2032
- Table 3: Global Telecom Billing and Revenue Management Platform Market Revenue Million Forecast, by Type 2019 & 2032
- Table 4: Global Telecom Billing and Revenue Management Platform Market Revenue Million Forecast, by Operator 2019 & 2032
- Table 5: Global Telecom Billing and Revenue Management Platform Market Revenue Million Forecast, by Region 2019 & 2032
- Table 6: Global Telecom Billing and Revenue Management Platform Market Revenue Million Forecast, by Country 2019 & 2032
- Table 7: US Telecom Billing and Revenue Management Platform Market Revenue (Million) Forecast, by Application 2019 & 2032
- Table 8: Canada Telecom Billing and Revenue Management Platform Market Revenue (Million) Forecast, by Application 2019 & 2032
- Table 9: Global Telecom Billing and Revenue Management Platform Market Revenue Million Forecast, by Country 2019 & 2032
- Table 10: Germany Telecom Billing and Revenue Management Platform Market Revenue (Million) Forecast, by Application 2019 & 2032
- Table 11: UK Telecom Billing and Revenue Management Platform Market Revenue (Million) Forecast, by Application 2019 & 2032
- Table 12: France Telecom Billing and Revenue Management Platform Market Revenue (Million) Forecast, by Application 2019 & 2032
- Table 13: Rest of Europe Telecom Billing and Revenue Management Platform Market Revenue (Million) Forecast, by Application 2019 & 2032
- Table 14: Global Telecom Billing and Revenue Management Platform Market Revenue Million Forecast, by Country 2019 & 2032
- Table 15: India Telecom Billing and Revenue Management Platform Market Revenue (Million) Forecast, by Application 2019 & 2032
- Table 16: China Telecom Billing and Revenue Management Platform Market Revenue (Million) Forecast, by Application 2019 & 2032
- Table 17: Japan Telecom Billing and Revenue Management Platform Market Revenue (Million) Forecast, by Application 2019 & 2032
- Table 18: Rest of Asia Pacific Telecom Billing and Revenue Management Platform Market Revenue (Million) Forecast, by Application 2019 & 2032
- Table 19: Global Telecom Billing and Revenue Management Platform Market Revenue Million Forecast, by Country 2019 & 2032
- Table 20: Telecom Billing and Revenue Management Platform Market Revenue (Million) Forecast, by Application 2019 & 2032
- Table 21: Global Telecom Billing and Revenue Management Platform Market Revenue Million Forecast, by Country 2019 & 2032
- Table 22: Telecom Billing and Revenue Management Platform Market Revenue (Million) Forecast, by Application 2019 & 2032
- Table 23: Global Telecom Billing and Revenue Management Platform Market Revenue Million Forecast, by Deployment 2019 & 2032
- Table 24: Global Telecom Billing and Revenue Management Platform Market Revenue Million Forecast, by Type 2019 & 2032
- Table 25: Global Telecom Billing and Revenue Management Platform Market Revenue Million Forecast, by Operator 2019 & 2032
- Table 26: Global Telecom Billing and Revenue Management Platform Market Revenue Million Forecast, by Country 2019 & 2032
- Table 27: US Telecom Billing and Revenue Management Platform Market Revenue (Million) Forecast, by Application 2019 & 2032
- Table 28: Canada Telecom Billing and Revenue Management Platform Market Revenue (Million) Forecast, by Application 2019 & 2032
- Table 29: Global Telecom Billing and Revenue Management Platform Market Revenue Million Forecast, by Deployment 2019 & 2032
- Table 30: Global Telecom Billing and Revenue Management Platform Market Revenue Million Forecast, by Type 2019 & 2032
- Table 31: Global Telecom Billing and Revenue Management Platform Market Revenue Million Forecast, by Operator 2019 & 2032
- Table 32: Global Telecom Billing and Revenue Management Platform Market Revenue Million Forecast, by Country 2019 & 2032
- Table 33: Germany Telecom Billing and Revenue Management Platform Market Revenue (Million) Forecast, by Application 2019 & 2032
- Table 34: UK Telecom Billing and Revenue Management Platform Market Revenue (Million) Forecast, by Application 2019 & 2032
- Table 35: France Telecom Billing and Revenue Management Platform Market Revenue (Million) Forecast, by Application 2019 & 2032
- Table 36: Rest of Europe Telecom Billing and Revenue Management Platform Market Revenue (Million) Forecast, by Application 2019 & 2032
- Table 37: Global Telecom Billing and Revenue Management Platform Market Revenue Million Forecast, by Deployment 2019 & 2032
- Table 38: Global Telecom Billing and Revenue Management Platform Market Revenue Million Forecast, by Type 2019 & 2032
- Table 39: Global Telecom Billing and Revenue Management Platform Market Revenue Million Forecast, by Operator 2019 & 2032
- Table 40: Global Telecom Billing and Revenue Management Platform Market Revenue Million Forecast, by Country 2019 & 2032
- Table 41: India Telecom Billing and Revenue Management Platform Market Revenue (Million) Forecast, by Application 2019 & 2032
- Table 42: China Telecom Billing and Revenue Management Platform Market Revenue (Million) Forecast, by Application 2019 & 2032
- Table 43: Japan Telecom Billing and Revenue Management Platform Market Revenue (Million) Forecast, by Application 2019 & 2032
- Table 44: Rest of Asia Pacific Telecom Billing and Revenue Management Platform Market Revenue (Million) Forecast, by Application 2019 & 2032
- Table 45: Global Telecom Billing and Revenue Management Platform Market Revenue Million Forecast, by Deployment 2019 & 2032
- Table 46: Global Telecom Billing and Revenue Management Platform Market Revenue Million Forecast, by Type 2019 & 2032
- Table 47: Global Telecom Billing and Revenue Management Platform Market Revenue Million Forecast, by Operator 2019 & 2032
- Table 48: Global Telecom Billing and Revenue Management Platform Market Revenue Million Forecast, by Country 2019 & 2032
- Table 49: Global Telecom Billing and Revenue Management Platform Market Revenue Million Forecast, by Deployment 2019 & 2032
- Table 50: Global Telecom Billing and Revenue Management Platform Market Revenue Million Forecast, by Type 2019 & 2032
- Table 51: Global Telecom Billing and Revenue Management Platform Market Revenue Million Forecast, by Operator 2019 & 2032
- Table 52: Global Telecom Billing and Revenue Management Platform Market Revenue Million Forecast, by Country 2019 & 2032
Frequently Asked Questions
1. What is the projected Compound Annual Growth Rate (CAGR) of the Telecom Billing and Revenue Management Platform Market?
The projected CAGR is approximately 9.43%.
2. Which companies are prominent players in the Telecom Billing and Revenue Management Platform Market?
Key companies in the market include Intracom Telecom SA*List Not Exhaustive, Sterlite Technologies Limited, SAP Se, CSG Systems International Inc, Oracle Corporation, Comarch SA, Enghouse Networks, NetCracker Technology Corporation, Nokia, Huawei Technologies, Optiva Inc, Ericsson.
3. What are the main segments of the Telecom Billing and Revenue Management Platform Market?
The market segments include Deployment, Type, Operator.
4. Can you provide details about the market size?
The market size is estimated to be USD 14.21 Million as of 2022.
5. What are some drivers contributing to market growth?
Growing Number of Cellular or Mobile Subscribers; Growing Complexities in Revenue Sharing Across the Telecom Ecosystem.
6. What are the notable trends driving market growth?
Mobile Operators to Account Major Market Share.
7. Are there any restraints impacting market growth?
Presence of Stringent Telecom Regulations.
8. Can you provide examples of recent developments in the market?
March 2023 - A national supplier of scalable fiber technology solutions, Spectrum Enterprise, a division of Charter Communications, and Netcracker Technology revealed an expanded partnership. Spectrum Enterprise selected Netcracker Revenue Management as its solution and will serve customers from a single billing platform.
9. What pricing options are available for accessing the report?
Pricing options include single-user, multi-user, and enterprise licenses priced at USD 4750, USD 5250, and USD 8750 respectively.
10. Is the market size provided in terms of value or volume?
The market size is provided in terms of value, measured in Million.
11. Are there any specific market keywords associated with the report?
Yes, the market keyword associated with the report is "Telecom Billing and Revenue Management Platform Market," which aids in identifying and referencing the specific market segment covered.
12. How do I determine which pricing option suits my needs best?
The pricing options vary based on user requirements and access needs. Individual users may opt for single-user licenses, while businesses requiring broader access may choose multi-user or enterprise licenses for cost-effective access to the report.
13. Are there any additional resources or data provided in the Telecom Billing and Revenue Management Platform Market report?
While the report offers comprehensive insights, it's advisable to review the specific contents or supplementary materials provided to ascertain if additional resources or data are available.
14. How can I stay updated on further developments or reports in the Telecom Billing and Revenue Management Platform Market?
To stay informed about further developments, trends, and reports in the Telecom Billing and Revenue Management Platform Market, consider subscribing to industry newsletters, following relevant companies and organizations, or regularly checking reputable industry news sources and publications.
Methodology
Step 1 - Identification of Relevant Samples Size from Population Database


Step 2 - Approaches for Defining Global Market Size (Value, Volume* & Price*)

Note*: In applicable scenarios
Step 3 - Data Sources
Primary Research
- Web Analytics
- Survey Reports
- Research Institute
- Latest Research Reports
- Opinion Leaders
Secondary Research
- Annual Reports
- White Paper
- Latest Press Release
- Industry Association
- Paid Database
- Investor Presentations

Step 4 - Data Triangulation
Involves using different sources of information in order to increase the validity of a study
These sources are likely to be stakeholders in a program - participants, other researchers, program staff, other community members, and so on.
Then we put all data in single framework & apply various statistical tools to find out the dynamic on the market.
During the analysis stage, feedback from the stakeholder groups would be compared to determine areas of agreement as well as areas of divergence
