

Key Insights
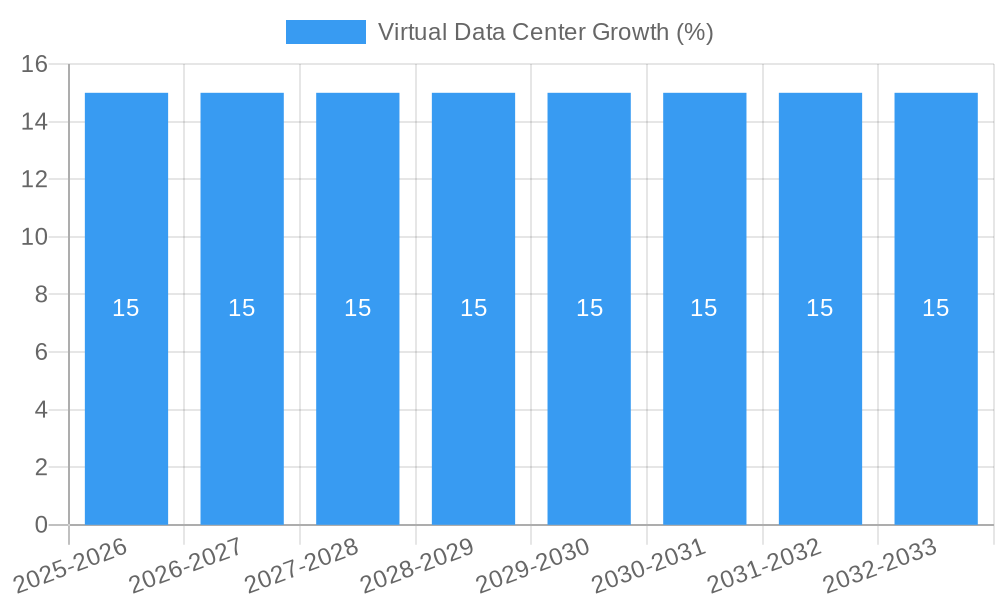
The Virtual Data Center (VDC) market is poised for substantial growth, projected to reach an estimated USD 120 billion in 2025, with a robust Compound Annual Growth Rate (CAGR) of 15% during the forecast period of 2025-2033. This expansion is primarily fueled by the increasing adoption of cloud computing and the persistent demand for greater IT agility, scalability, and cost-efficiency across various industries. The inherent benefits of VDCs, such as reduced hardware dependency, enhanced disaster recovery capabilities, and streamlined management, are compelling enterprises to migrate from traditional on-premise data centers. The IT & Telecommunication sector and Banking, Financial Services & Insurance (BFSI) are leading the charge, leveraging VDCs for their critical data processing and application hosting needs. Furthermore, the growing emphasis on digital transformation initiatives across sectors like Healthcare and Education is creating new avenues for VDC adoption, enabling them to deliver enhanced services and manage vast amounts of data more effectively.
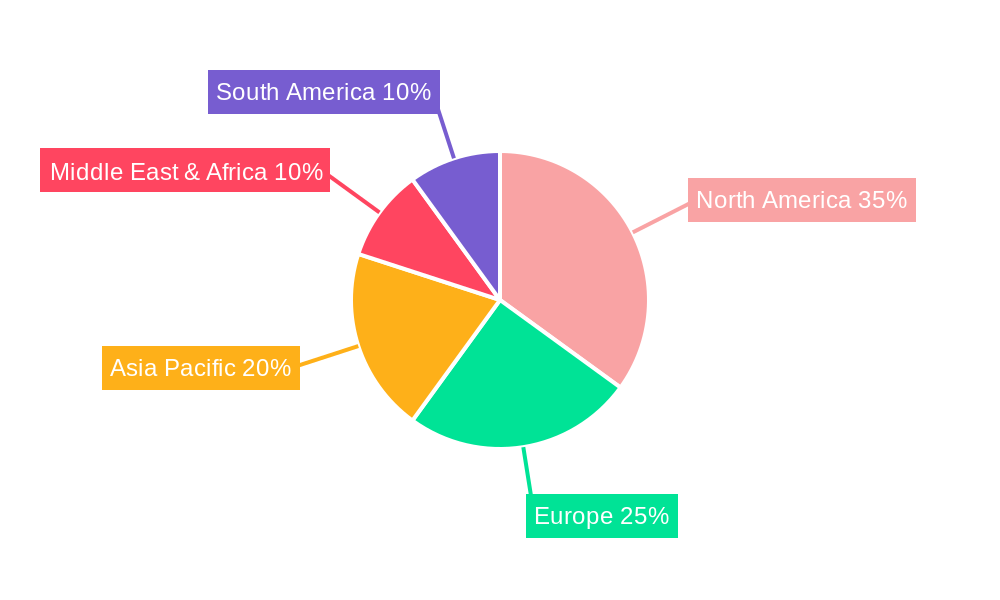
The VDC market is characterized by diverse service offerings, with Advisory & Implementation Services currently holding a significant market share, reflecting the initial investment and strategic planning involved in VDC deployment. However, Optimization Services and Managed Services are expected to witness rapid growth as organizations mature in their VDC journey, focusing on enhancing performance, security, and operational efficiency. While the market is largely driven by technological advancements and the pursuit of operational excellence, certain restraints such as data security concerns and the initial high capital expenditure for complex implementations could pose challenges. Nevertheless, these are being mitigated by advancements in security technologies and the emergence of pay-as-you-go models. Geographically, North America, driven by the early adoption and advanced IT infrastructure in the United States, is expected to maintain its dominance. However, the Asia Pacific region is anticipated to exhibit the fastest growth, propelled by the burgeoning digital economy in countries like China and India, coupled with significant investments in cloud infrastructure.
Virtual Data Center Market: Comprehensive Analysis & Future Outlook (2019-2033)
This in-depth report provides a granular analysis of the global Virtual Data Center market, offering critical insights into its dynamics, growth trajectory, key players, and future potential. Covering a comprehensive study period from 2019 to 2033, with a base year of 2025, this report is essential for stakeholders seeking to understand and capitalize on this rapidly evolving sector. We delve into market concentration, technological advancements, regulatory landscapes, competitive pressures, and segment-specific growth drivers. With a projected market size of $120,000 million in 2025, this report illuminates the strategic opportunities and challenges within the virtual data center ecosystem.
Virtual Data Center Market Dynamics & Structure
The Virtual Data Center (VDC) market exhibits a dynamic and moderately concentrated structure, driven by continuous technological innovation and increasing demand for scalable and flexible IT infrastructure. Key drivers include the proliferation of cloud computing, the need for disaster recovery and business continuity, and the growing adoption of hybrid and multi-cloud strategies by enterprises. Regulatory frameworks, particularly concerning data privacy and sovereignty (e.g., GDPR, CCPA), are shaping service delivery and architectural designs, fostering a need for compliant VDC solutions. Competitive product substitutes, such as on-premises data centers and public cloud offerings, exert pressure but also drive innovation in VDC service models. End-user demographics span across all industries, with a strong emphasis on IT & Telecommunication, BFSI, and Healthcare sectors demanding robust, secure, and cost-effective VDC solutions. Mergers and acquisitions (M&A) activity is a significant trend, with major players consolidating their market positions and expanding their service portfolios. In 2024, approximately 25 M&A deals were recorded, with a total deal value of $5,000 million, indicative of the market's maturation and strategic consolidation. Innovation barriers include the complexity of integrating legacy systems with virtualized environments and the ongoing need for specialized cybersecurity expertise.
- Market Concentration: Moderately concentrated, with a few major players holding significant market share but with room for niche providers.
- Technological Innovation Drivers: Cloud-native technologies, AI/ML for automation, edge computing integration, and enhanced security protocols.
- Regulatory Frameworks: Data localization mandates, industry-specific compliance standards (e.g., HIPAA, PCI DSS), and evolving data privacy laws.
- Competitive Product Substitutes: Traditional on-premises infrastructure, pure public cloud IaaS, and SaaS solutions.
- End-User Demographics: Enterprises of all sizes, with a focus on sectors requiring high availability, scalability, and data security.
- M&A Trends: Strategic acquisitions to gain market share, acquire new technologies, and expand geographical reach.
Virtual Data Center Growth Trends & Insights
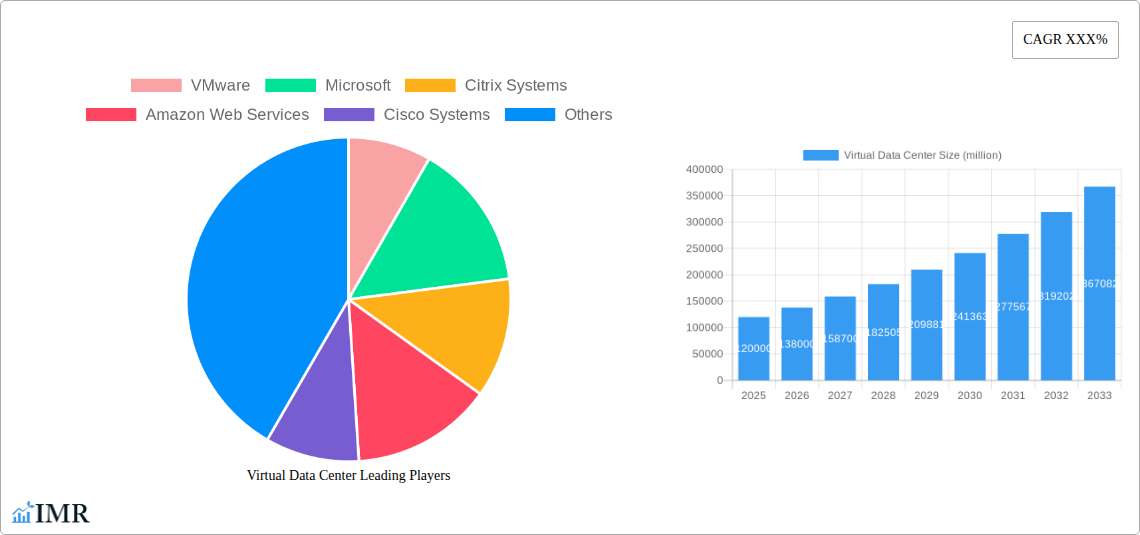
The Virtual Data Center (VDC) market is poised for robust expansion, driven by an intrinsic shift towards digital transformation across global industries. The projected market size of $120,000 million in 2025 is expected to witness a Compound Annual Growth Rate (CAGR) of 18.5% during the forecast period of 2025–2033, reaching an estimated $290,000 million by 2033. This significant growth is underpinned by increasing adoption rates of cloud-based solutions, as organizations increasingly recognize the cost efficiencies, scalability, and agility that VDCs offer over traditional IT infrastructure. Technological disruptions, including the advent of software-defined networking (SDN), software-defined storage (SDS), and advanced virtualization techniques, are continuously enhancing VDC capabilities, making them more powerful and versatile. Consumer behavior shifts are also playing a pivotal role; businesses are prioritizing operational agility and the ability to rapidly deploy applications and services, making VDCs an indispensable component of their IT strategy.
The historical period from 2019–2024 saw steady growth, with market penetration increasing from 35% in 2019 to an estimated 60% by the end of 2024, reflecting a growing reliance on virtualized environments. The base year of 2025 marks a critical inflection point, with businesses actively migrating from legacy systems to more dynamic VDC architectures. The increasing demand for hybrid cloud solutions, which seamlessly integrate private and public cloud resources, is a significant trend driving market adoption. VDCs provide the foundational infrastructure for these hybrid environments, enabling organizations to leverage the benefits of both public cloud scalability and private cloud control. Furthermore, the rise of data-intensive applications, such as big data analytics, artificial intelligence, and the Internet of Things (IoT), necessitates the flexible and scalable computing power that VDCs deliver. Organizations are increasingly outsourcing their data center management to specialized providers, leading to a surge in demand for managed VDC services. This trend allows businesses to focus on their core competencies while ensuring their IT infrastructure is robust, secure, and cost-effective. The ongoing digital transformation initiatives, accelerated by events such as the global pandemic, have further amplified the need for resilient and adaptable IT infrastructure, making VDCs a critical enabler of business continuity and innovation.
Dominant Regions, Countries, or Segments in Virtual Data Center
The IT & Telecommunication segment stands as the dominant force within the Virtual Data Center (VDC) market, showcasing unparalleled demand and adoption rates. This sector's inherent reliance on advanced, scalable, and agile IT infrastructure makes VDCs a natural fit. With an estimated market share of 30% in 2025, contributing $36,000 million to the global VDC market, the IT & Telecommunication industry is the primary driver of growth. This dominance is fueled by the continuous need for rapid deployment of new services, handling massive data traffic, and ensuring high availability for mission-critical operations.
Key Drivers in the IT & Telecommunication Segment:
- Rapid Service Innovation: The sector constantly introduces new digital services, requiring flexible infrastructure for quick deployment and scaling.
- Data Traffic Management: The exponential growth of data generated and consumed necessitates robust and scalable data center solutions.
- Network Virtualization: VDCs enable advanced network virtualization, crucial for telecommunication providers to optimize bandwidth and manage complex networks.
- Cost Optimization: Shifting from capital-intensive physical infrastructure to operational expenditure models via VDCs allows for significant cost savings.
- Disaster Recovery and Business Continuity: Essential for maintaining service uptime in a highly competitive and regulated industry.
Dominance Factors and Growth Potential:
The IT & Telecommunication sector's leadership is further solidified by its early adoption of cloud technologies and its role in enabling digital transformation across other industries. Companies within this segment are often at the forefront of adopting cutting-edge VDC technologies, driving innovation and setting market trends. The sheer volume of data processing and the critical nature of their services mean that reliability, scalability, and security are paramount, all of which are core strengths of VDC solutions. The projected CAGR of 19.2% for this segment from 2025–2033, significantly higher than the overall market average, underscores its continued dominance and growth potential.
Geographically, North America is anticipated to remain the leading region in the VDC market in 2025, contributing approximately 35% of the global market value. This leadership is attributed to the presence of major technology hubs, a strong economy, advanced IT infrastructure, and a high concentration of enterprises across sectors like IT & Telecommunication, BFSI, and Healthcare actively adopting cloud-first strategies.
Virtual Data Center Product Landscape
The Virtual Data Center (VDC) product landscape is characterized by continuous innovation focused on enhancing performance, security, and cost-efficiency. Leading providers are offering highly integrated solutions encompassing compute, storage, and networking virtualization, often leveraging hyperconverged infrastructure (HCI) for streamlined management. Advanced features such as automated provisioning, self-service portals, and intelligent workload placement are becoming standard. Performance metrics are constantly being pushed with lower latency, higher I/O operations per second (IOPS), and increased processing power. Unique selling propositions include robust disaster recovery capabilities, seamless integration with public cloud platforms for hybrid deployments, and comprehensive security frameworks incorporating multi-factor authentication and advanced threat detection. Technological advancements are also enabling greater energy efficiency and sustainability in VDC operations.
Key Drivers, Barriers & Challenges in Virtual Data Center
Key Drivers:
The Virtual Data Center market is propelled by several key drivers, most notably the ever-increasing demand for scalability and agility to support digital transformation initiatives. Organizations across all sectors are migrating to virtualized environments to achieve faster application deployment, reduce IT operational costs, and enhance business continuity. The rapid evolution of cloud computing technologies, including hybrid and multi-cloud strategies, further fuels VDC adoption. Moreover, the growing emphasis on data-driven decision-making and the proliferation of Big Data analytics, AI, and IoT applications require the flexible and powerful computing resources that VDCs provide. Economic factors, such as the shift from CapEx to OpEx spending, also make VDCs an attractive option for many businesses.
Barriers & Challenges:
Despite its growth, the VDC market faces several significant barriers and challenges. Data security and privacy concerns remain paramount, with organizations apprehensive about entrusting sensitive data to virtualized environments, especially concerning regulatory compliance and data sovereignty. The complexity of integrating legacy IT systems with modern VDC architectures presents a substantial technical hurdle for many enterprises. A shortage of skilled IT professionals with expertise in virtualization, cloud security, and VDC management also limits widespread adoption. Furthermore, the high initial investment required for some advanced VDC solutions and the ongoing operational costs can be a deterrent for smaller businesses. Vendor lock-in and the need for robust interoperability across different VDC platforms also pose challenges.
Emerging Opportunities in Virtual Data Center
Emerging opportunities in the Virtual Data Center (VDC) sector lie in the growing demand for specialized VDC solutions tailored for specific industries and workloads. The rise of edge computing presents a significant avenue, with VDCs being adapted to manage distributed data processing closer to the source of data generation. Furthermore, the increasing adoption of AI and machine learning technologies is creating opportunities for VDCs optimized for high-performance computing and complex data analytics. The development of "green" VDC solutions focused on energy efficiency and sustainability is also gaining traction. Another significant opportunity lies in providing enhanced cybersecurity services and compliance automation within VDC environments, addressing critical concerns for many organizations. The expansion of VDC offerings into emerging markets with rapidly digitizing economies also presents substantial untapped potential.
Growth Accelerators in the Virtual Data Center Industry
The Virtual Data Center (VDC) industry is experiencing significant growth acceleration driven by several key factors. Technological breakthroughs in areas such as containerization, serverless computing, and AI-powered automation are enhancing the efficiency and capabilities of VDCs, making them more attractive to businesses. Strategic partnerships between hardware vendors, software providers, and cloud service providers are fostering greater interoperability and creating more comprehensive VDC solutions. Market expansion strategies, including the development of specialized VDCs for specific vertical industries (e.g., healthcare, finance) and the increasing adoption of hybrid and multi-cloud VDC models, are further accelerating growth. The continuous drive for cost optimization and operational efficiency by enterprises worldwide also acts as a potent growth accelerator, pushing them towards the flexible and scalable nature of VDCs.
Key Players Shaping the Virtual Data Center Market
- VMware
- Microsoft
- Citrix Systems
- Amazon Web Services
- Cisco Systems
- AT&T
- Fujitsu
- Radiant Communications
- HPE
- Huawei
- HCL
- IBM
Notable Milestones in Virtual Data Center Sector
- 2019: VMware launches vSphere 7, introducing significant advancements in Kubernetes integration and modern application support for virtualized environments.
- 2020 (Q2): Microsoft Azure announces enhanced capabilities for hybrid cloud and edge computing solutions, strengthening its VDC offerings.
- 2021 (Q1): Amazon Web Services (AWS) expands its Outposts service, bringing AWS infrastructure and services to on-premises data centers, enabling hybrid VDC solutions.
- 2022 (Q3): Cisco Systems introduces new networking solutions designed to enhance the performance and security of virtualized data centers.
- 2023 (Q4): IBM completes the acquisition of Red Hat, further solidifying its hybrid cloud and VDC strategy with open-source technologies.
- 2024 (Ongoing): Increased focus on AI-driven automation and self-healing capabilities within VDC platforms by multiple key players.
In-Depth Virtual Data Center Market Outlook
The Virtual Data Center market is set for continued robust growth, driven by the ongoing digital transformation and the increasing need for agile, scalable, and cost-effective IT infrastructure. Key growth accelerators include advancements in AI and machine learning for intelligent automation, the expansion of hybrid and multi-cloud strategies, and the growing demand for specialized VDC solutions tailored to industry-specific needs. Strategic partnerships and the development of more integrated and secure VDC platforms will further enhance market potential. The increasing adoption of VDCs by small and medium-sized businesses, alongside large enterprises, indicates a broad market appeal. The future outlook suggests a market where VDCs are not just a component of IT infrastructure but a foundational element enabling innovation, operational efficiency, and business resilience in an increasingly digital world.
Virtual Data Center Segmentation
-
1. Application
- 1.1. IT & Telecommunication
- 1.2. Banking Financial Services & Insurance (BFSI)
- 1.3. Education
- 1.4. Healthcare
- 1.5. Government
- 1.6. Others
-
2. Type
- 2.1. Advisory & Implementation Services
- 2.2. Optimization Services
- 2.3. Managed Services
- 2.4. Technical Support Services
Virtual Data Center Segmentation By Geography
-
1. North America
- 1.1. United States
- 1.2. Canada
- 1.3. Mexico
-
2. South America
- 2.1. Brazil
- 2.2. Argentina
- 2.3. Rest of South America
-
3. Europe
- 3.1. United Kingdom
- 3.2. Germany
- 3.3. France
- 3.4. Italy
- 3.5. Spain
- 3.6. Russia
- 3.7. Benelux
- 3.8. Nordics
- 3.9. Rest of Europe
-
4. Middle East & Africa
- 4.1. Turkey
- 4.2. Israel
- 4.3. GCC
- 4.4. North Africa
- 4.5. South Africa
- 4.6. Rest of Middle East & Africa
-
5. Asia Pacific
- 5.1. China
- 5.2. India
- 5.3. Japan
- 5.4. South Korea
- 5.5. ASEAN
- 5.6. Oceania
- 5.7. Rest of Asia Pacific
Virtual Data Center REPORT HIGHLIGHTS
| Aspects | Details |
|---|---|
| Study Period | 2019-2033 |
| Base Year | 2024 |
| Estimated Year | 2025 |
| Forecast Period | 2025-2033 |
| Historical Period | 2019-2024 |
| Growth Rate | CAGR of XXX% from 2019-2033 |
| Segmentation |
|
Table of Contents
- 1. Introduction
- 1.1. Research Scope
- 1.2. Market Segmentation
- 1.3. Research Methodology
- 1.4. Definitions and Assumptions
- 2. Executive Summary
- 2.1. Introduction
- 3. Market Dynamics
- 3.1. Introduction
- 3.2. Market Drivers
- 3.3. Market Restrains
- 3.4. Market Trends
- 4. Market Factor Analysis
- 4.1. Porters Five Forces
- 4.2. Supply/Value Chain
- 4.3. PESTEL analysis
- 4.4. Market Entropy
- 4.5. Patent/Trademark Analysis
- 5. Global Virtual Data Center Analysis, Insights and Forecast, 2019-2031
- 5.1. Market Analysis, Insights and Forecast - by Application
- 5.1.1. IT & Telecommunication
- 5.1.2. Banking Financial Services & Insurance (BFSI)
- 5.1.3. Education
- 5.1.4. Healthcare
- 5.1.5. Government
- 5.1.6. Others
- 5.2. Market Analysis, Insights and Forecast - by Type
- 5.2.1. Advisory & Implementation Services
- 5.2.2. Optimization Services
- 5.2.3. Managed Services
- 5.2.4. Technical Support Services
- 5.3. Market Analysis, Insights and Forecast - by Region
- 5.3.1. North America
- 5.3.2. South America
- 5.3.3. Europe
- 5.3.4. Middle East & Africa
- 5.3.5. Asia Pacific
- 5.1. Market Analysis, Insights and Forecast - by Application
- 6. North America Virtual Data Center Analysis, Insights and Forecast, 2019-2031
- 6.1. Market Analysis, Insights and Forecast - by Application
- 6.1.1. IT & Telecommunication
- 6.1.2. Banking Financial Services & Insurance (BFSI)
- 6.1.3. Education
- 6.1.4. Healthcare
- 6.1.5. Government
- 6.1.6. Others
- 6.2. Market Analysis, Insights and Forecast - by Type
- 6.2.1. Advisory & Implementation Services
- 6.2.2. Optimization Services
- 6.2.3. Managed Services
- 6.2.4. Technical Support Services
- 6.1. Market Analysis, Insights and Forecast - by Application
- 7. South America Virtual Data Center Analysis, Insights and Forecast, 2019-2031
- 7.1. Market Analysis, Insights and Forecast - by Application
- 7.1.1. IT & Telecommunication
- 7.1.2. Banking Financial Services & Insurance (BFSI)
- 7.1.3. Education
- 7.1.4. Healthcare
- 7.1.5. Government
- 7.1.6. Others
- 7.2. Market Analysis, Insights and Forecast - by Type
- 7.2.1. Advisory & Implementation Services
- 7.2.2. Optimization Services
- 7.2.3. Managed Services
- 7.2.4. Technical Support Services
- 7.1. Market Analysis, Insights and Forecast - by Application
- 8. Europe Virtual Data Center Analysis, Insights and Forecast, 2019-2031
- 8.1. Market Analysis, Insights and Forecast - by Application
- 8.1.1. IT & Telecommunication
- 8.1.2. Banking Financial Services & Insurance (BFSI)
- 8.1.3. Education
- 8.1.4. Healthcare
- 8.1.5. Government
- 8.1.6. Others
- 8.2. Market Analysis, Insights and Forecast - by Type
- 8.2.1. Advisory & Implementation Services
- 8.2.2. Optimization Services
- 8.2.3. Managed Services
- 8.2.4. Technical Support Services
- 8.1. Market Analysis, Insights and Forecast - by Application
- 9. Middle East & Africa Virtual Data Center Analysis, Insights and Forecast, 2019-2031
- 9.1. Market Analysis, Insights and Forecast - by Application
- 9.1.1. IT & Telecommunication
- 9.1.2. Banking Financial Services & Insurance (BFSI)
- 9.1.3. Education
- 9.1.4. Healthcare
- 9.1.5. Government
- 9.1.6. Others
- 9.2. Market Analysis, Insights and Forecast - by Type
- 9.2.1. Advisory & Implementation Services
- 9.2.2. Optimization Services
- 9.2.3. Managed Services
- 9.2.4. Technical Support Services
- 9.1. Market Analysis, Insights and Forecast - by Application
- 10. Asia Pacific Virtual Data Center Analysis, Insights and Forecast, 2019-2031
- 10.1. Market Analysis, Insights and Forecast - by Application
- 10.1.1. IT & Telecommunication
- 10.1.2. Banking Financial Services & Insurance (BFSI)
- 10.1.3. Education
- 10.1.4. Healthcare
- 10.1.5. Government
- 10.1.6. Others
- 10.2. Market Analysis, Insights and Forecast - by Type
- 10.2.1. Advisory & Implementation Services
- 10.2.2. Optimization Services
- 10.2.3. Managed Services
- 10.2.4. Technical Support Services
- 10.1. Market Analysis, Insights and Forecast - by Application
- 11. Competitive Analysis
- 11.1. Global Market Share Analysis 2024
- 11.2. Company Profiles
- 11.2.1 VMware
- 11.2.1.1. Overview
- 11.2.1.2. Products
- 11.2.1.3. SWOT Analysis
- 11.2.1.4. Recent Developments
- 11.2.1.5. Financials (Based on Availability)
- 11.2.2 Microsoft
- 11.2.2.1. Overview
- 11.2.2.2. Products
- 11.2.2.3. SWOT Analysis
- 11.2.2.4. Recent Developments
- 11.2.2.5. Financials (Based on Availability)
- 11.2.3 Citrix Systems
- 11.2.3.1. Overview
- 11.2.3.2. Products
- 11.2.3.3. SWOT Analysis
- 11.2.3.4. Recent Developments
- 11.2.3.5. Financials (Based on Availability)
- 11.2.4 Amazon Web Services
- 11.2.4.1. Overview
- 11.2.4.2. Products
- 11.2.4.3. SWOT Analysis
- 11.2.4.4. Recent Developments
- 11.2.4.5. Financials (Based on Availability)
- 11.2.5 Cisco Systems
- 11.2.5.1. Overview
- 11.2.5.2. Products
- 11.2.5.3. SWOT Analysis
- 11.2.5.4. Recent Developments
- 11.2.5.5. Financials (Based on Availability)
- 11.2.6 AT&T
- 11.2.6.1. Overview
- 11.2.6.2. Products
- 11.2.6.3. SWOT Analysis
- 11.2.6.4. Recent Developments
- 11.2.6.5. Financials (Based on Availability)
- 11.2.7 Fujitsu
- 11.2.7.1. Overview
- 11.2.7.2. Products
- 11.2.7.3. SWOT Analysis
- 11.2.7.4. Recent Developments
- 11.2.7.5. Financials (Based on Availability)
- 11.2.8 Radiant Communications
- 11.2.8.1. Overview
- 11.2.8.2. Products
- 11.2.8.3. SWOT Analysis
- 11.2.8.4. Recent Developments
- 11.2.8.5. Financials (Based on Availability)
- 11.2.9 HPE
- 11.2.9.1. Overview
- 11.2.9.2. Products
- 11.2.9.3. SWOT Analysis
- 11.2.9.4. Recent Developments
- 11.2.9.5. Financials (Based on Availability)
- 11.2.10 Huawei
- 11.2.10.1. Overview
- 11.2.10.2. Products
- 11.2.10.3. SWOT Analysis
- 11.2.10.4. Recent Developments
- 11.2.10.5. Financials (Based on Availability)
- 11.2.11 HCL
- 11.2.11.1. Overview
- 11.2.11.2. Products
- 11.2.11.3. SWOT Analysis
- 11.2.11.4. Recent Developments
- 11.2.11.5. Financials (Based on Availability)
- 11.2.12 IBM
- 11.2.12.1. Overview
- 11.2.12.2. Products
- 11.2.12.3. SWOT Analysis
- 11.2.12.4. Recent Developments
- 11.2.12.5. Financials (Based on Availability)
- 11.2.1 VMware
List of Figures
- Figure 1: Global Virtual Data Center Revenue Breakdown (million, %) by Region 2024 & 2032
- Figure 2: North America Virtual Data Center Revenue (million), by Application 2024 & 2032
- Figure 3: North America Virtual Data Center Revenue Share (%), by Application 2024 & 2032
- Figure 4: North America Virtual Data Center Revenue (million), by Type 2024 & 2032
- Figure 5: North America Virtual Data Center Revenue Share (%), by Type 2024 & 2032
- Figure 6: North America Virtual Data Center Revenue (million), by Country 2024 & 2032
- Figure 7: North America Virtual Data Center Revenue Share (%), by Country 2024 & 2032
- Figure 8: South America Virtual Data Center Revenue (million), by Application 2024 & 2032
- Figure 9: South America Virtual Data Center Revenue Share (%), by Application 2024 & 2032
- Figure 10: South America Virtual Data Center Revenue (million), by Type 2024 & 2032
- Figure 11: South America Virtual Data Center Revenue Share (%), by Type 2024 & 2032
- Figure 12: South America Virtual Data Center Revenue (million), by Country 2024 & 2032
- Figure 13: South America Virtual Data Center Revenue Share (%), by Country 2024 & 2032
- Figure 14: Europe Virtual Data Center Revenue (million), by Application 2024 & 2032
- Figure 15: Europe Virtual Data Center Revenue Share (%), by Application 2024 & 2032
- Figure 16: Europe Virtual Data Center Revenue (million), by Type 2024 & 2032
- Figure 17: Europe Virtual Data Center Revenue Share (%), by Type 2024 & 2032
- Figure 18: Europe Virtual Data Center Revenue (million), by Country 2024 & 2032
- Figure 19: Europe Virtual Data Center Revenue Share (%), by Country 2024 & 2032
- Figure 20: Middle East & Africa Virtual Data Center Revenue (million), by Application 2024 & 2032
- Figure 21: Middle East & Africa Virtual Data Center Revenue Share (%), by Application 2024 & 2032
- Figure 22: Middle East & Africa Virtual Data Center Revenue (million), by Type 2024 & 2032
- Figure 23: Middle East & Africa Virtual Data Center Revenue Share (%), by Type 2024 & 2032
- Figure 24: Middle East & Africa Virtual Data Center Revenue (million), by Country 2024 & 2032
- Figure 25: Middle East & Africa Virtual Data Center Revenue Share (%), by Country 2024 & 2032
- Figure 26: Asia Pacific Virtual Data Center Revenue (million), by Application 2024 & 2032
- Figure 27: Asia Pacific Virtual Data Center Revenue Share (%), by Application 2024 & 2032
- Figure 28: Asia Pacific Virtual Data Center Revenue (million), by Type 2024 & 2032
- Figure 29: Asia Pacific Virtual Data Center Revenue Share (%), by Type 2024 & 2032
- Figure 30: Asia Pacific Virtual Data Center Revenue (million), by Country 2024 & 2032
- Figure 31: Asia Pacific Virtual Data Center Revenue Share (%), by Country 2024 & 2032
List of Tables
- Table 1: Global Virtual Data Center Revenue million Forecast, by Region 2019 & 2032
- Table 2: Global Virtual Data Center Revenue million Forecast, by Application 2019 & 2032
- Table 3: Global Virtual Data Center Revenue million Forecast, by Type 2019 & 2032
- Table 4: Global Virtual Data Center Revenue million Forecast, by Region 2019 & 2032
- Table 5: Global Virtual Data Center Revenue million Forecast, by Application 2019 & 2032
- Table 6: Global Virtual Data Center Revenue million Forecast, by Type 2019 & 2032
- Table 7: Global Virtual Data Center Revenue million Forecast, by Country 2019 & 2032
- Table 8: United States Virtual Data Center Revenue (million) Forecast, by Application 2019 & 2032
- Table 9: Canada Virtual Data Center Revenue (million) Forecast, by Application 2019 & 2032
- Table 10: Mexico Virtual Data Center Revenue (million) Forecast, by Application 2019 & 2032
- Table 11: Global Virtual Data Center Revenue million Forecast, by Application 2019 & 2032
- Table 12: Global Virtual Data Center Revenue million Forecast, by Type 2019 & 2032
- Table 13: Global Virtual Data Center Revenue million Forecast, by Country 2019 & 2032
- Table 14: Brazil Virtual Data Center Revenue (million) Forecast, by Application 2019 & 2032
- Table 15: Argentina Virtual Data Center Revenue (million) Forecast, by Application 2019 & 2032
- Table 16: Rest of South America Virtual Data Center Revenue (million) Forecast, by Application 2019 & 2032
- Table 17: Global Virtual Data Center Revenue million Forecast, by Application 2019 & 2032
- Table 18: Global Virtual Data Center Revenue million Forecast, by Type 2019 & 2032
- Table 19: Global Virtual Data Center Revenue million Forecast, by Country 2019 & 2032
- Table 20: United Kingdom Virtual Data Center Revenue (million) Forecast, by Application 2019 & 2032
- Table 21: Germany Virtual Data Center Revenue (million) Forecast, by Application 2019 & 2032
- Table 22: France Virtual Data Center Revenue (million) Forecast, by Application 2019 & 2032
- Table 23: Italy Virtual Data Center Revenue (million) Forecast, by Application 2019 & 2032
- Table 24: Spain Virtual Data Center Revenue (million) Forecast, by Application 2019 & 2032
- Table 25: Russia Virtual Data Center Revenue (million) Forecast, by Application 2019 & 2032
- Table 26: Benelux Virtual Data Center Revenue (million) Forecast, by Application 2019 & 2032
- Table 27: Nordics Virtual Data Center Revenue (million) Forecast, by Application 2019 & 2032
- Table 28: Rest of Europe Virtual Data Center Revenue (million) Forecast, by Application 2019 & 2032
- Table 29: Global Virtual Data Center Revenue million Forecast, by Application 2019 & 2032
- Table 30: Global Virtual Data Center Revenue million Forecast, by Type 2019 & 2032
- Table 31: Global Virtual Data Center Revenue million Forecast, by Country 2019 & 2032
- Table 32: Turkey Virtual Data Center Revenue (million) Forecast, by Application 2019 & 2032
- Table 33: Israel Virtual Data Center Revenue (million) Forecast, by Application 2019 & 2032
- Table 34: GCC Virtual Data Center Revenue (million) Forecast, by Application 2019 & 2032
- Table 35: North Africa Virtual Data Center Revenue (million) Forecast, by Application 2019 & 2032
- Table 36: South Africa Virtual Data Center Revenue (million) Forecast, by Application 2019 & 2032
- Table 37: Rest of Middle East & Africa Virtual Data Center Revenue (million) Forecast, by Application 2019 & 2032
- Table 38: Global Virtual Data Center Revenue million Forecast, by Application 2019 & 2032
- Table 39: Global Virtual Data Center Revenue million Forecast, by Type 2019 & 2032
- Table 40: Global Virtual Data Center Revenue million Forecast, by Country 2019 & 2032
- Table 41: China Virtual Data Center Revenue (million) Forecast, by Application 2019 & 2032
- Table 42: India Virtual Data Center Revenue (million) Forecast, by Application 2019 & 2032
- Table 43: Japan Virtual Data Center Revenue (million) Forecast, by Application 2019 & 2032
- Table 44: South Korea Virtual Data Center Revenue (million) Forecast, by Application 2019 & 2032
- Table 45: ASEAN Virtual Data Center Revenue (million) Forecast, by Application 2019 & 2032
- Table 46: Oceania Virtual Data Center Revenue (million) Forecast, by Application 2019 & 2032
- Table 47: Rest of Asia Pacific Virtual Data Center Revenue (million) Forecast, by Application 2019 & 2032
Frequently Asked Questions
1. What is the projected Compound Annual Growth Rate (CAGR) of the Virtual Data Center?
The projected CAGR is approximately XXX%.
2. Which companies are prominent players in the Virtual Data Center?
Key companies in the market include VMware, Microsoft, Citrix Systems, Amazon Web Services, Cisco Systems, AT&T, Fujitsu, Radiant Communications, HPE, Huawei, HCL, IBM.
3. What are the main segments of the Virtual Data Center?
The market segments include Application, Type.
4. Can you provide details about the market size?
The market size is estimated to be USD XXX million as of 2022.
5. What are some drivers contributing to market growth?
N/A
6. What are the notable trends driving market growth?
N/A
7. Are there any restraints impacting market growth?
N/A
8. Can you provide examples of recent developments in the market?
N/A
9. What pricing options are available for accessing the report?
Pricing options include single-user, multi-user, and enterprise licenses priced at USD 3950.00, USD 5925.00, and USD 7900.00 respectively.
10. Is the market size provided in terms of value or volume?
The market size is provided in terms of value, measured in million.
11. Are there any specific market keywords associated with the report?
Yes, the market keyword associated with the report is "Virtual Data Center," which aids in identifying and referencing the specific market segment covered.
12. How do I determine which pricing option suits my needs best?
The pricing options vary based on user requirements and access needs. Individual users may opt for single-user licenses, while businesses requiring broader access may choose multi-user or enterprise licenses for cost-effective access to the report.
13. Are there any additional resources or data provided in the Virtual Data Center report?
While the report offers comprehensive insights, it's advisable to review the specific contents or supplementary materials provided to ascertain if additional resources or data are available.
14. How can I stay updated on further developments or reports in the Virtual Data Center?
To stay informed about further developments, trends, and reports in the Virtual Data Center, consider subscribing to industry newsletters, following relevant companies and organizations, or regularly checking reputable industry news sources and publications.
Methodology
Step 1 - Identification of Relevant Samples Size from Population Database


Step 2 - Approaches for Defining Global Market Size (Value, Volume* & Price*)

Note*: In applicable scenarios
Step 3 - Data Sources
Primary Research
- Web Analytics
- Survey Reports
- Research Institute
- Latest Research Reports
- Opinion Leaders
Secondary Research
- Annual Reports
- White Paper
- Latest Press Release
- Industry Association
- Paid Database
- Investor Presentations

Step 4 - Data Triangulation
Involves using different sources of information in order to increase the validity of a study
These sources are likely to be stakeholders in a program - participants, other researchers, program staff, other community members, and so on.
Then we put all data in single framework & apply various statistical tools to find out the dynamic on the market.
During the analysis stage, feedback from the stakeholder groups would be compared to determine areas of agreement as well as areas of divergence
