

Key Insights
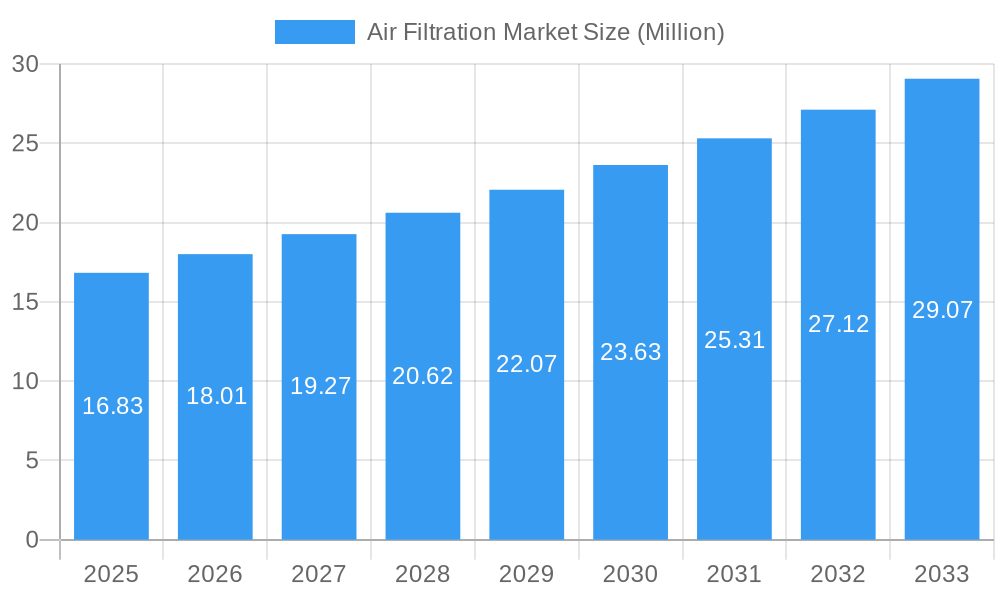
The global Air Filtration Market is poised for substantial growth, projected to reach an estimated market size of $16.83 million by 2025. This expansion is fueled by a robust Compound Annual Growth Rate (CAGR) of 7.00%, indicating sustained momentum throughout the forecast period of 2025-2033. A primary driver for this market surge is the escalating global concern regarding air quality, driven by increasing urbanization, industrialization, and rising awareness of the health implications of polluted air. This heightened consciousness is compelling both individuals and businesses to invest in effective air purification solutions. Furthermore, stricter environmental regulations and government initiatives aimed at improving indoor air quality in residential, commercial, and industrial settings are acting as significant catalysts for market adoption. The demand for advanced filtration technologies, particularly High-efficiency Particulate Air (HEPA) filters, is expected to remain strong due to their proven efficacy in capturing fine particulate matter, allergens, and pathogens.
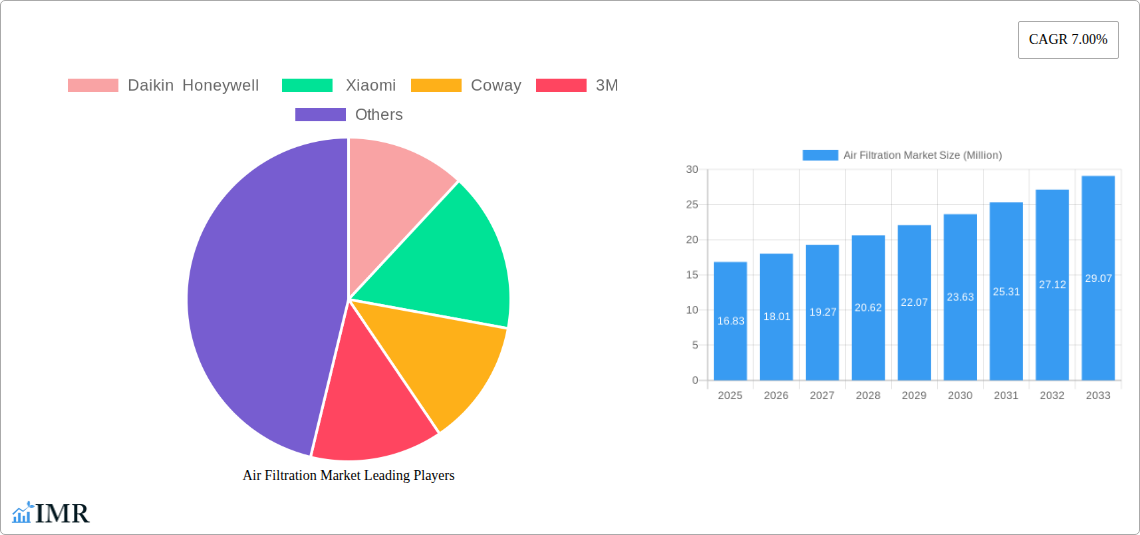
Air Filtration Market Market Size (In Million)
The market's diverse segmentation caters to a wide spectrum of needs. Stand-alone air purifiers are witnessing significant traction in residential and commercial spaces, offering flexibility and localized air quality improvements. In-duct systems, conversely, are gaining prominence in larger buildings and industrial facilities where comprehensive air management is paramount. The residential sector, driven by growing health concerns and the desire for cleaner indoor environments, represents a substantial end-user segment. Simultaneously, the commercial sector, encompassing offices, hospitals, and educational institutions, is increasingly investing in air filtration to ensure occupant well-being and productivity. The industrial segment, characterized by stringent air quality standards and the need to protect machinery and processes, also contributes significantly to market demand. Key players like Daikin, Honeywell, Xiaomi, Coway, and 3M are actively innovating and expanding their product portfolios to capture market share, introducing smart, energy-efficient, and technologically advanced air filtration solutions. Geographically, North America and Europe are established markets with high adoption rates, while the Asia Pacific region, particularly China and India, presents immense growth potential due to rapid industrial development and increasing disposable incomes.
Air Filtration Market Company Market Share
Comprehensive Air Filtration Market Analysis: 2019-2033
This in-depth report delivers a comprehensive analysis of the global Air Filtration Market, providing critical insights for industry stakeholders. Spanning the historical period of 2019-2024, base year 2025, and a forecast period extending to 2033, this report quantifies market size in million units, offering precise data on key segments, regional dominance, and competitive landscapes. Leveraging advanced analytical frameworks, the report dissects market dynamics, growth trends, and emerging opportunities, equipping businesses with the intelligence needed to navigate this rapidly evolving sector.
Air Filtration Market Market Dynamics & Structure
The Air Filtration Market exhibits a moderately concentrated structure, with key players like Daikin, Honeywell, Xiaomi, Coway, and 3M holding significant market shares. Technological innovation is a primary driver, fueled by increasing consumer awareness of air quality and stringent regulatory frameworks aimed at improving indoor and outdoor air. The development of advanced High-efficiency Particulate Air (HEPA) filters and other specialized filtration technologies continues to push product performance. Competitive product substitutes exist, ranging from basic filters to sophisticated air purification systems, but the focus on superior filtration efficiency and health benefits solidifies the market's core offerings. End-user demographics are diversifying, with growing demand from residential, commercial, and industrial sectors, each with unique filtration needs. Mergers and acquisitions (M&A) are expected to play a role in market consolidation as larger companies seek to expand their product portfolios and geographical reach.
- Market Concentration: Dominated by a few key global manufacturers, with increasing influence from regional players.
- Technological Innovation Drivers: Rising pollution levels, health consciousness, and smart home integration.
- Regulatory Frameworks: Government initiatives for indoor air quality standards and industrial emission controls.
- Competitive Product Substitutes: Basic filters, HVAC system upgrades, and standalone air purifiers.
- End-User Demographics: Growth across Residential, Commercial (offices, healthcare, education), and Industrial (manufacturing, power generation) segments.
- M&A Trends: Potential for consolidation to gain market share and technological expertise.
Air Filtration Market Growth Trends & Insights
The global Air Filtration Market is poised for robust growth, driven by escalating concerns over air pollution and a heightened awareness of the health implications associated with poor air quality. The market size is projected to expand significantly, transitioning from xx million units in the historical period to an estimated xx million units by the base year 2025, and further to xx million units by the end of the forecast period in 2033. This sustained growth is underpinned by a healthy Compound Annual Growth Rate (CAGR) of approximately xx% during the forecast period.
Several factors contribute to this upward trajectory. Firstly, the increasing prevalence of respiratory diseases, allergies, and the recent global health crises have amplified the demand for effective air purification solutions in homes, workplaces, and public spaces. Consumers are actively seeking products that can mitigate the impact of indoor pollutants such as particulate matter, volatile organic compounds (VOCs), and allergens. This shift in consumer behavior is leading to higher market penetration rates, especially in urban and densely populated areas where air quality is a persistent issue.
Technological disruptions are also playing a crucial role. The continuous advancement in filtration technologies, particularly the refinement and widespread adoption of HEPA filters, alongside the development of more energy-efficient and smart air purifiers, are enhancing product performance and appeal. Innovations in materials science are leading to more effective and durable filter media, while the integration of IoT capabilities in air purifiers allows for remote monitoring, automated adjustments, and personalized air quality management. The rise of connected homes and smart buildings further fuels the demand for integrated air filtration systems.
Geographically, the Asia-Pacific region is emerging as a key growth engine, driven by rapid industrialization, increasing urbanization, and growing disposable incomes, which translate into a higher ability and willingness to invest in air quality solutions. North America and Europe continue to be significant markets, characterized by stringent environmental regulations and a well-established consumer base prioritizing health and wellness. The increasing adoption of air filtration systems in commercial spaces, including hospitals, schools, and offices, to ensure a safe and healthy environment for occupants, is a significant growth accelerator. The industrial sector's demand for specialized filtration to meet emission standards and protect workers also contributes substantially to the overall market expansion. The interplay of these factors—increasing health consciousness, technological innovation, and supportive regulatory environments—creates a fertile ground for sustained growth in the Air Filtration Market.
Dominant Regions, Countries, or Segments in Air Filtration Market
The Residential segment, particularly driven by the High-efficiency Particulate Air (HEPA) filtration technology and Stand-alone type air purifiers, is currently exhibiting dominant growth within the global Air Filtration Market. This dominance is not only due to its sheer volume but also its rapid expansion driven by escalating consumer awareness and a proactive approach towards health and well-being.
Several key drivers are propelling the residential segment and HEPA filtration to the forefront. In terms of regions, Asia-Pacific is emerging as a powerhouse, fueled by rapid urbanization, increasing disposable incomes, and severe air pollution challenges in many of its major cities. Countries like China, India, and Southeast Asian nations are witnessing a surge in demand for residential air purifiers as households prioritize cleaner indoor environments. This surge is often supported by government initiatives aimed at improving air quality and increasing public health awareness. The economic policies in these regions, focusing on industrial development and infrastructure, indirectly contribute to a need for better air management within homes.
Within the Filtration Technology segmentation, HEPA filters are indisputably leading the pack. Their proven efficacy in capturing 99.97% of airborne particles as small as 0.3 microns, including allergens, dust mites, mold spores, and even certain bacteria and viruses, makes them the preferred choice for health-conscious consumers. The demand for these high-performance filters is closely tied to the prevalence of allergies and respiratory conditions, which are increasingly being reported globally.
The Type segmentation sees Stand-alone air purifiers leading the charge in the residential sector. These devices offer flexibility, portability, and targeted air purification for specific rooms. Their ease of use and relatively lower installation complexity compared to in-duct systems make them highly appealing to homeowners. As smart home technology becomes more integrated into daily life, stand-alone air purifiers are increasingly featuring Wi-Fi connectivity, app control, and intelligent sensors, further enhancing their attractiveness.
The End User segmentation clearly points to Residential applications as the primary growth engine. While the commercial and industrial sectors also represent significant markets, the sheer number of households globally, coupled with the increasing prioritization of indoor air quality for families and vulnerable populations, positions the residential segment for sustained leadership. Growing awareness about the long-term health benefits of clean air, especially in light of events like the COVID-19 pandemic, has accelerated the adoption of air purifiers in homes. The perception of air purifiers as essential home appliances, rather than luxury items, is a testament to their growing importance.
- Dominant Segment: Residential, driven by HEPA filtration and Stand-alone units.
- Leading Region: Asia-Pacific, with significant contributions from China, India, and Southeast Asia.
- Key Drivers for Residential Growth:
- Rising disposable incomes and urbanization.
- Severe air pollution in major cities.
- Increased health and wellness consciousness.
- Prevalence of allergies and respiratory ailments.
- Integration of smart home technology.
- Government initiatives for air quality improvement.
- HEPA Filtration: Superior performance in capturing fine particulate matter, allergens, and pathogens.
- Stand-alone Air Purifiers: Flexibility, portability, and ease of use cater to individual room needs.
- Market Share & Growth Potential: The residential segment is expected to continue its rapid growth, capturing a substantial share of the overall air filtration market due to widespread consumer adoption and evolving lifestyle choices.
Air Filtration Market Product Landscape
The Air Filtration Market is characterized by continuous product innovation focused on enhanced efficiency, user convenience, and smart integration. High-efficiency Particulate Air (HEPA) filters remain a cornerstone, with manufacturers constantly refining their construction for optimal particle capture. Beyond HEPA, advancements include activated carbon filters for odor and VOC reduction, photocatalytic oxidation (PCO) filters for breaking down pollutants, and UV-C light integration for germicidal action. Stand-alone air purifiers are increasingly featuring multi-stage filtration systems, robust designs, and minimalist aesthetics to appeal to modern consumers. Performance metrics such as Clean Air Delivery Rate (CADR), energy efficiency ratings, and noise levels are key selling propositions. The integration of smart sensors, Wi-Fi connectivity, and AI-powered algorithms allows for real-time air quality monitoring and automated adjustments, providing users with personalized air purification experiences. These innovations cater to diverse applications, from ensuring allergen-free environments in homes to maintaining critical air purity standards in healthcare and industrial settings.
Key Drivers, Barriers & Challenges in Air Filtration Market
Key Drivers:
- Rising Air Pollution Levels: Increasing industrial activity, vehicular emissions, and urbanization globally lead to a higher demand for air purification solutions across residential, commercial, and industrial sectors.
- Growing Health Consciousness: Heightened awareness of the detrimental effects of poor air quality on respiratory health, allergies, and overall well-being is a primary consumer motivator.
- Technological Advancements: Development of more efficient filtration technologies (e.g., advanced HEPA, activated carbon), smart features, and energy-efficient designs are enhancing product appeal and performance.
- Stringent Regulations: Government mandates and air quality standards for indoor and outdoor environments, particularly in industrial settings and public buildings, drive the adoption of certified air filtration systems.
Barriers & Challenges:
- High Initial Cost: Advanced air filtration systems, especially those with premium features and high CADR ratings, can have a significant upfront cost, limiting adoption for some consumer segments.
- Filter Replacement Costs: The ongoing expense of replacing filters can be a deterrent for consumers and businesses, impacting long-term affordability.
- Lack of Awareness in Developing Regions: While awareness is growing, in some less developed markets, the understanding of the importance of air filtration and its benefits might still be limited.
- Energy Consumption Concerns: While advancements are being made, some high-performance air purifiers can consume considerable energy, raising concerns about operational costs and environmental footprint.
- Supply Chain Disruptions: Global supply chain volatility can impact the availability of raw materials and finished products, potentially leading to price fluctuations and delays.
Emerging Opportunities in Air Filtration Market
Emerging opportunities in the Air Filtration Market are significantly influenced by technological innovation and evolving consumer preferences. The increasing integration of air filtration with smart home ecosystems presents a substantial growth avenue, allowing for seamless control and automated air quality management. Furthermore, the development of specialized filtration solutions for emerging pollutants, such as those related to wildfire smoke and novel viruses, offers untapped market potential. The growing emphasis on sustainability is also driving demand for eco-friendly filter materials and energy-efficient purification systems. Untapped markets in developing economies, coupled with increasing government focus on public health, present significant expansion opportunities. The application of air filtration in sectors like vertical farming and cleanrooms is also gaining traction.
Growth Accelerators in the Air Filtration Market Industry
Long-term growth in the Air Filtration Market is being significantly accelerated by several key factors. Technological breakthroughs in material science are enabling the creation of more efficient, durable, and cost-effective filter media. The development of smart and connected air purifiers, integrating with IoT platforms and offering advanced data analytics on air quality, is driving consumer engagement and demand for sophisticated solutions. Strategic partnerships between air filtration manufacturers and HVAC system providers are leading to integrated solutions that offer comprehensive building air management. Moreover, market expansion strategies targeting underserved geographical regions and specific industry verticals, such as healthcare and education, are unlocking new growth avenues. The increasing focus on preventative healthcare and the demand for healthier living and working environments are fundamental catalysts for sustained market expansion.
Key Players Shaping the Air Filtration Market Market
- Daikin
- Honeywell
- Xiaomi
- Coway
- 3M
Notable Milestones in Air Filtration Market Sector
- March 2023: Xiaomi Corp. announced the launch of the MIJIA full-effect air purifier for the Chinese market. The equipment can produce 12,500 liters of air volume per minute, with an estimated virus removal capacity of approximately 99%. Such an enhanced product feature is expected to increase the sale of air purifiers during the forecast period.
- March 2023: Blueair launched indoor air purifier variants known as Blue Pure Max. The new model of air purifiers featured minimal noise, robust design, and enhanced performance features to purify the air in rooms measuring 1,524 square feet in approximately 30 minutes.
In-Depth Air Filtration Market Market Outlook
The Air Filtration Market is set for a future characterized by innovation and expanding applications. The convergence of advanced filtration technologies with smart home integration will continue to drive demand for intelligent and personalized air purification solutions. As global awareness of air quality's impact on health intensifies, the market's growth trajectory will be further solidified by proactive consumer choices and supportive governmental policies. Strategic investments in research and development, focusing on sustainability and the mitigation of emerging pollutants, will pave the way for next-generation air filtration systems. The increasing adoption of these systems across residential, commercial, and industrial sectors signifies a robust outlook, positioning the air filtration market as a critical component of modern health and environmental well-being.
Air Filtration Market Segmentation
-
1. Filtration Technology
- 1.1. High-efficiency Particulate Air (HEPA)
- 1.2. Other Fi
-
2. Type
- 2.1. Stand-alone
- 2.2. In-duct
-
3. End User
- 3.1. Residential
- 3.2. Commercial
- 3.3. Industrial
Air Filtration Market Segmentation By Geography
-
1. North America
- 1.1. United States
- 1.2. Canada
- 1.3. Rest of North America
-
2. Europe
- 2.1. United Kingdom
- 2.2. Germany
- 2.3. Spain
- 2.4. NORDIC
- 2.5. Russia
- 2.6. Turkey
- 2.7. Italy
- 2.8. Rest of Europe
-
3. Asia Pacific
- 3.1. China
- 3.2. India
- 3.3. Japan
- 3.4. Malaysia
- 3.5. Thailand
- 3.6. Indonesia
- 3.7. Vietnam
- 3.8. Rest of Asia Pacific
-
4. South America
- 4.1. Brazil
- 4.2. Argentina
- 4.3. Colombia
- 4.4. Rest of South America
-
5. Middle East and Africa
- 5.1. United Arab Emirates
- 5.2. Saudi Arabia
- 5.3. South Africa
- 5.4. Nigeria
- 5.5. Qatar
- 5.6. Egypt
- 5.7. Rest of Middle East and Africa
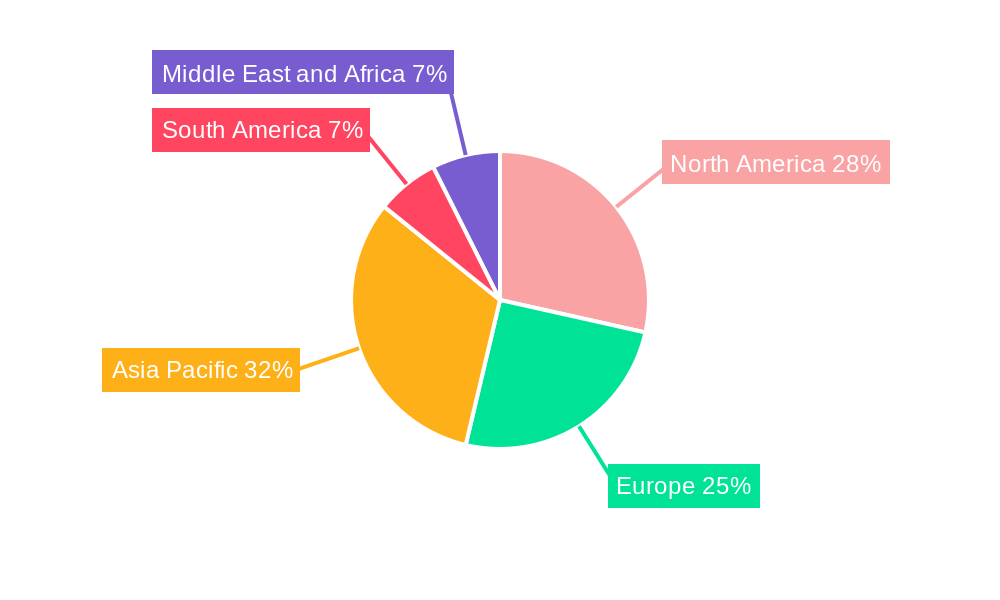
Air Filtration Market Regional Market Share
Geographic Coverage of Air Filtration Market
Air Filtration Market REPORT HIGHLIGHTS
| Aspects | Details |
|---|---|
| Study Period | 2020-2034 |
| Base Year | 2025 |
| Estimated Year | 2026 |
| Forecast Period | 2026-2034 |
| Historical Period | 2020-2025 |
| Growth Rate | CAGR of 7.00% from 2020-2034 |
| Segmentation |
|
Table of Contents
- 1. Introduction
- 1.1. Research Scope
- 1.2. Market Segmentation
- 1.3. Research Objective
- 1.4. Definitions and Assumptions
- 2. Executive Summary
- 2.1. Market Snapshot
- 3. Market Dynamics
- 3.1. Market Drivers
- 3.2. Market Restrains
- 3.3. Market Trends
- 3.4. Market Opportunities
- 4. Market Factor Analysis
- 4.1. Porters Five Forces
- 4.1.1. Bargaining Power of Suppliers
- 4.1.2. Bargaining Power of Buyers
- 4.1.3. Threat of New Entrants
- 4.1.4. Threat of Substitutes
- 4.1.5. Competitive Rivalry
- 4.2. PESTEL analysis
- 4.3. BCG Analysis
- 4.3.1. Stars (High Growth, High Market Share)
- 4.3.2. Cash Cows (Low Growth, High Market Share)
- 4.3.3. Question Mark (High Growth, Low Market Share)
- 4.3.4. Dogs (Low Growth, Low Market Share)
- 4.4. Ansoff Matrix Analysis
- 4.5. Supply Chain Analysis
- 4.6. Regulatory Landscape
- 4.7. Current Market Potential and Opportunity Assessment (TAM–SAM–SOM Framework)
- 4.8. IMR Analyst Note
- 4.1. Porters Five Forces
- 5. Market Analysis, Insights and Forecast 2021-2033
- 5.1. Market Analysis, Insights and Forecast - by Filtration Technology
- 5.1.1. High-efficiency Particulate Air (HEPA)
- 5.1.2. Other Fi
- 5.2. Market Analysis, Insights and Forecast - by Type
- 5.2.1. Stand-alone
- 5.2.2. In-duct
- 5.3. Market Analysis, Insights and Forecast - by End User
- 5.3.1. Residential
- 5.3.2. Commercial
- 5.3.3. Industrial
- 5.4. Market Analysis, Insights and Forecast - by Region
- 5.4.1. North America
- 5.4.2. Europe
- 5.4.3. Asia Pacific
- 5.4.4. South America
- 5.4.5. Middle East and Africa
- 5.1. Market Analysis, Insights and Forecast - by Filtration Technology
- 6. Global Air Filtration Market Analysis, Insights and Forecast, 2021-2033
- 6.1. Market Analysis, Insights and Forecast - by Filtration Technology
- 6.1.1. High-efficiency Particulate Air (HEPA)
- 6.1.2. Other Fi
- 6.2. Market Analysis, Insights and Forecast - by Type
- 6.2.1. Stand-alone
- 6.2.2. In-duct
- 6.3. Market Analysis, Insights and Forecast - by End User
- 6.3.1. Residential
- 6.3.2. Commercial
- 6.3.3. Industrial
- 6.1. Market Analysis, Insights and Forecast - by Filtration Technology
- 7. North America Air Filtration Market Analysis, Insights and Forecast, 2020-2032
- 7.1. Market Analysis, Insights and Forecast - by Filtration Technology
- 7.1.1. High-efficiency Particulate Air (HEPA)
- 7.1.2. Other Fi
- 7.2. Market Analysis, Insights and Forecast - by Type
- 7.2.1. Stand-alone
- 7.2.2. In-duct
- 7.3. Market Analysis, Insights and Forecast - by End User
- 7.3.1. Residential
- 7.3.2. Commercial
- 7.3.3. Industrial
- 7.1. Market Analysis, Insights and Forecast - by Filtration Technology
- 8. Europe Air Filtration Market Analysis, Insights and Forecast, 2020-2032
- 8.1. Market Analysis, Insights and Forecast - by Filtration Technology
- 8.1.1. High-efficiency Particulate Air (HEPA)
- 8.1.2. Other Fi
- 8.2. Market Analysis, Insights and Forecast - by Type
- 8.2.1. Stand-alone
- 8.2.2. In-duct
- 8.3. Market Analysis, Insights and Forecast - by End User
- 8.3.1. Residential
- 8.3.2. Commercial
- 8.3.3. Industrial
- 8.1. Market Analysis, Insights and Forecast - by Filtration Technology
- 9. Asia Pacific Air Filtration Market Analysis, Insights and Forecast, 2020-2032
- 9.1. Market Analysis, Insights and Forecast - by Filtration Technology
- 9.1.1. High-efficiency Particulate Air (HEPA)
- 9.1.2. Other Fi
- 9.2. Market Analysis, Insights and Forecast - by Type
- 9.2.1. Stand-alone
- 9.2.2. In-duct
- 9.3. Market Analysis, Insights and Forecast - by End User
- 9.3.1. Residential
- 9.3.2. Commercial
- 9.3.3. Industrial
- 9.1. Market Analysis, Insights and Forecast - by Filtration Technology
- 10. South America Air Filtration Market Analysis, Insights and Forecast, 2020-2032
- 10.1. Market Analysis, Insights and Forecast - by Filtration Technology
- 10.1.1. High-efficiency Particulate Air (HEPA)
- 10.1.2. Other Fi
- 10.2. Market Analysis, Insights and Forecast - by Type
- 10.2.1. Stand-alone
- 10.2.2. In-duct
- 10.3. Market Analysis, Insights and Forecast - by End User
- 10.3.1. Residential
- 10.3.2. Commercial
- 10.3.3. Industrial
- 10.1. Market Analysis, Insights and Forecast - by Filtration Technology
- 11. Middle East and Africa Air Filtration Market Analysis, Insights and Forecast, 2020-2032
- 11.1. Market Analysis, Insights and Forecast - by Filtration Technology
- 11.1.1. High-efficiency Particulate Air (HEPA)
- 11.1.2. Other Fi
- 11.2. Market Analysis, Insights and Forecast - by Type
- 11.2.1. Stand-alone
- 11.2.2. In-duct
- 11.3. Market Analysis, Insights and Forecast - by End User
- 11.3.1. Residential
- 11.3.2. Commercial
- 11.3.3. Industrial
- 11.1. Market Analysis, Insights and Forecast - by Filtration Technology
- 12. Competitive Analysis
- 12.1. Company Profiles
- 12.1.1 Daikin Honeywell
- 12.1.1.1. Company Overview
- 12.1.1.2. Products
- 12.1.1.3. Company Financials
- 12.1.1.4. SWOT Analysis
- 12.1.2 Xiaomi
- 12.1.2.1. Company Overview
- 12.1.2.2. Products
- 12.1.2.3. Company Financials
- 12.1.2.4. SWOT Analysis
- 12.1.3 Coway
- 12.1.3.1. Company Overview
- 12.1.3.2. Products
- 12.1.3.3. Company Financials
- 12.1.3.4. SWOT Analysis
- 12.1.4 3M
- 12.1.4.1. Company Overview
- 12.1.4.2. Products
- 12.1.4.3. Company Financials
- 12.1.4.4. SWOT Analysis
- 12.1.1 Daikin Honeywell
- 12.2. Market Entropy
- 12.2.1 Company's Key Areas Served
- 12.2.2 Recent Developments
- 12.3. Company Market Share Analysis 2025
- 12.3.1 Top 5 Companies Market Share Analysis
- 12.3.2 Top 3 Companies Market Share Analysis
- 12.4. List of Potential Customers
- 13. Research Methodology
List of Figures
- Figure 1: Global Air Filtration Market Revenue Breakdown (Million, %) by Region 2025 & 2033
- Figure 2: Global Air Filtration Market Volume Breakdown (K Unit, %) by Region 2025 & 2033
- Figure 3: North America Air Filtration Market Revenue (Million), by Filtration Technology 2025 & 2033
- Figure 4: North America Air Filtration Market Volume (K Unit), by Filtration Technology 2025 & 2033
- Figure 5: North America Air Filtration Market Revenue Share (%), by Filtration Technology 2025 & 2033
- Figure 6: North America Air Filtration Market Volume Share (%), by Filtration Technology 2025 & 2033
- Figure 7: North America Air Filtration Market Revenue (Million), by Type 2025 & 2033
- Figure 8: North America Air Filtration Market Volume (K Unit), by Type 2025 & 2033
- Figure 9: North America Air Filtration Market Revenue Share (%), by Type 2025 & 2033
- Figure 10: North America Air Filtration Market Volume Share (%), by Type 2025 & 2033
- Figure 11: North America Air Filtration Market Revenue (Million), by End User 2025 & 2033
- Figure 12: North America Air Filtration Market Volume (K Unit), by End User 2025 & 2033
- Figure 13: North America Air Filtration Market Revenue Share (%), by End User 2025 & 2033
- Figure 14: North America Air Filtration Market Volume Share (%), by End User 2025 & 2033
- Figure 15: North America Air Filtration Market Revenue (Million), by Country 2025 & 2033
- Figure 16: North America Air Filtration Market Volume (K Unit), by Country 2025 & 2033
- Figure 17: North America Air Filtration Market Revenue Share (%), by Country 2025 & 2033
- Figure 18: North America Air Filtration Market Volume Share (%), by Country 2025 & 2033
- Figure 19: Europe Air Filtration Market Revenue (Million), by Filtration Technology 2025 & 2033
- Figure 20: Europe Air Filtration Market Volume (K Unit), by Filtration Technology 2025 & 2033
- Figure 21: Europe Air Filtration Market Revenue Share (%), by Filtration Technology 2025 & 2033
- Figure 22: Europe Air Filtration Market Volume Share (%), by Filtration Technology 2025 & 2033
- Figure 23: Europe Air Filtration Market Revenue (Million), by Type 2025 & 2033
- Figure 24: Europe Air Filtration Market Volume (K Unit), by Type 2025 & 2033
- Figure 25: Europe Air Filtration Market Revenue Share (%), by Type 2025 & 2033
- Figure 26: Europe Air Filtration Market Volume Share (%), by Type 2025 & 2033
- Figure 27: Europe Air Filtration Market Revenue (Million), by End User 2025 & 2033
- Figure 28: Europe Air Filtration Market Volume (K Unit), by End User 2025 & 2033
- Figure 29: Europe Air Filtration Market Revenue Share (%), by End User 2025 & 2033
- Figure 30: Europe Air Filtration Market Volume Share (%), by End User 2025 & 2033
- Figure 31: Europe Air Filtration Market Revenue (Million), by Country 2025 & 2033
- Figure 32: Europe Air Filtration Market Volume (K Unit), by Country 2025 & 2033
- Figure 33: Europe Air Filtration Market Revenue Share (%), by Country 2025 & 2033
- Figure 34: Europe Air Filtration Market Volume Share (%), by Country 2025 & 2033
- Figure 35: Asia Pacific Air Filtration Market Revenue (Million), by Filtration Technology 2025 & 2033
- Figure 36: Asia Pacific Air Filtration Market Volume (K Unit), by Filtration Technology 2025 & 2033
- Figure 37: Asia Pacific Air Filtration Market Revenue Share (%), by Filtration Technology 2025 & 2033
- Figure 38: Asia Pacific Air Filtration Market Volume Share (%), by Filtration Technology 2025 & 2033
- Figure 39: Asia Pacific Air Filtration Market Revenue (Million), by Type 2025 & 2033
- Figure 40: Asia Pacific Air Filtration Market Volume (K Unit), by Type 2025 & 2033
- Figure 41: Asia Pacific Air Filtration Market Revenue Share (%), by Type 2025 & 2033
- Figure 42: Asia Pacific Air Filtration Market Volume Share (%), by Type 2025 & 2033
- Figure 43: Asia Pacific Air Filtration Market Revenue (Million), by End User 2025 & 2033
- Figure 44: Asia Pacific Air Filtration Market Volume (K Unit), by End User 2025 & 2033
- Figure 45: Asia Pacific Air Filtration Market Revenue Share (%), by End User 2025 & 2033
- Figure 46: Asia Pacific Air Filtration Market Volume Share (%), by End User 2025 & 2033
- Figure 47: Asia Pacific Air Filtration Market Revenue (Million), by Country 2025 & 2033
- Figure 48: Asia Pacific Air Filtration Market Volume (K Unit), by Country 2025 & 2033
- Figure 49: Asia Pacific Air Filtration Market Revenue Share (%), by Country 2025 & 2033
- Figure 50: Asia Pacific Air Filtration Market Volume Share (%), by Country 2025 & 2033
- Figure 51: South America Air Filtration Market Revenue (Million), by Filtration Technology 2025 & 2033
- Figure 52: South America Air Filtration Market Volume (K Unit), by Filtration Technology 2025 & 2033
- Figure 53: South America Air Filtration Market Revenue Share (%), by Filtration Technology 2025 & 2033
- Figure 54: South America Air Filtration Market Volume Share (%), by Filtration Technology 2025 & 2033
- Figure 55: South America Air Filtration Market Revenue (Million), by Type 2025 & 2033
- Figure 56: South America Air Filtration Market Volume (K Unit), by Type 2025 & 2033
- Figure 57: South America Air Filtration Market Revenue Share (%), by Type 2025 & 2033
- Figure 58: South America Air Filtration Market Volume Share (%), by Type 2025 & 2033
- Figure 59: South America Air Filtration Market Revenue (Million), by End User 2025 & 2033
- Figure 60: South America Air Filtration Market Volume (K Unit), by End User 2025 & 2033
- Figure 61: South America Air Filtration Market Revenue Share (%), by End User 2025 & 2033
- Figure 62: South America Air Filtration Market Volume Share (%), by End User 2025 & 2033
- Figure 63: South America Air Filtration Market Revenue (Million), by Country 2025 & 2033
- Figure 64: South America Air Filtration Market Volume (K Unit), by Country 2025 & 2033
- Figure 65: South America Air Filtration Market Revenue Share (%), by Country 2025 & 2033
- Figure 66: South America Air Filtration Market Volume Share (%), by Country 2025 & 2033
- Figure 67: Middle East and Africa Air Filtration Market Revenue (Million), by Filtration Technology 2025 & 2033
- Figure 68: Middle East and Africa Air Filtration Market Volume (K Unit), by Filtration Technology 2025 & 2033
- Figure 69: Middle East and Africa Air Filtration Market Revenue Share (%), by Filtration Technology 2025 & 2033
- Figure 70: Middle East and Africa Air Filtration Market Volume Share (%), by Filtration Technology 2025 & 2033
- Figure 71: Middle East and Africa Air Filtration Market Revenue (Million), by Type 2025 & 2033
- Figure 72: Middle East and Africa Air Filtration Market Volume (K Unit), by Type 2025 & 2033
- Figure 73: Middle East and Africa Air Filtration Market Revenue Share (%), by Type 2025 & 2033
- Figure 74: Middle East and Africa Air Filtration Market Volume Share (%), by Type 2025 & 2033
- Figure 75: Middle East and Africa Air Filtration Market Revenue (Million), by End User 2025 & 2033
- Figure 76: Middle East and Africa Air Filtration Market Volume (K Unit), by End User 2025 & 2033
- Figure 77: Middle East and Africa Air Filtration Market Revenue Share (%), by End User 2025 & 2033
- Figure 78: Middle East and Africa Air Filtration Market Volume Share (%), by End User 2025 & 2033
- Figure 79: Middle East and Africa Air Filtration Market Revenue (Million), by Country 2025 & 2033
- Figure 80: Middle East and Africa Air Filtration Market Volume (K Unit), by Country 2025 & 2033
- Figure 81: Middle East and Africa Air Filtration Market Revenue Share (%), by Country 2025 & 2033
- Figure 82: Middle East and Africa Air Filtration Market Volume Share (%), by Country 2025 & 2033
List of Tables
- Table 1: Global Air Filtration Market Revenue Million Forecast, by Filtration Technology 2020 & 2033
- Table 2: Global Air Filtration Market Volume K Unit Forecast, by Filtration Technology 2020 & 2033
- Table 3: Global Air Filtration Market Revenue Million Forecast, by Type 2020 & 2033
- Table 4: Global Air Filtration Market Volume K Unit Forecast, by Type 2020 & 2033
- Table 5: Global Air Filtration Market Revenue Million Forecast, by End User 2020 & 2033
- Table 6: Global Air Filtration Market Volume K Unit Forecast, by End User 2020 & 2033
- Table 7: Global Air Filtration Market Revenue Million Forecast, by Region 2020 & 2033
- Table 8: Global Air Filtration Market Volume K Unit Forecast, by Region 2020 & 2033
- Table 9: Global Air Filtration Market Revenue Million Forecast, by Filtration Technology 2020 & 2033
- Table 10: Global Air Filtration Market Volume K Unit Forecast, by Filtration Technology 2020 & 2033
- Table 11: Global Air Filtration Market Revenue Million Forecast, by Type 2020 & 2033
- Table 12: Global Air Filtration Market Volume K Unit Forecast, by Type 2020 & 2033
- Table 13: Global Air Filtration Market Revenue Million Forecast, by End User 2020 & 2033
- Table 14: Global Air Filtration Market Volume K Unit Forecast, by End User 2020 & 2033
- Table 15: Global Air Filtration Market Revenue Million Forecast, by Country 2020 & 2033
- Table 16: Global Air Filtration Market Volume K Unit Forecast, by Country 2020 & 2033
- Table 17: United States Air Filtration Market Revenue (Million) Forecast, by Application 2020 & 2033
- Table 18: United States Air Filtration Market Volume (K Unit) Forecast, by Application 2020 & 2033
- Table 19: Canada Air Filtration Market Revenue (Million) Forecast, by Application 2020 & 2033
- Table 20: Canada Air Filtration Market Volume (K Unit) Forecast, by Application 2020 & 2033
- Table 21: Rest of North America Air Filtration Market Revenue (Million) Forecast, by Application 2020 & 2033
- Table 22: Rest of North America Air Filtration Market Volume (K Unit) Forecast, by Application 2020 & 2033
- Table 23: Global Air Filtration Market Revenue Million Forecast, by Filtration Technology 2020 & 2033
- Table 24: Global Air Filtration Market Volume K Unit Forecast, by Filtration Technology 2020 & 2033
- Table 25: Global Air Filtration Market Revenue Million Forecast, by Type 2020 & 2033
- Table 26: Global Air Filtration Market Volume K Unit Forecast, by Type 2020 & 2033
- Table 27: Global Air Filtration Market Revenue Million Forecast, by End User 2020 & 2033
- Table 28: Global Air Filtration Market Volume K Unit Forecast, by End User 2020 & 2033
- Table 29: Global Air Filtration Market Revenue Million Forecast, by Country 2020 & 2033
- Table 30: Global Air Filtration Market Volume K Unit Forecast, by Country 2020 & 2033
- Table 31: United Kingdom Air Filtration Market Revenue (Million) Forecast, by Application 2020 & 2033
- Table 32: United Kingdom Air Filtration Market Volume (K Unit) Forecast, by Application 2020 & 2033
- Table 33: Germany Air Filtration Market Revenue (Million) Forecast, by Application 2020 & 2033
- Table 34: Germany Air Filtration Market Volume (K Unit) Forecast, by Application 2020 & 2033
- Table 35: Spain Air Filtration Market Revenue (Million) Forecast, by Application 2020 & 2033
- Table 36: Spain Air Filtration Market Volume (K Unit) Forecast, by Application 2020 & 2033
- Table 37: NORDIC Air Filtration Market Revenue (Million) Forecast, by Application 2020 & 2033
- Table 38: NORDIC Air Filtration Market Volume (K Unit) Forecast, by Application 2020 & 2033
- Table 39: Russia Air Filtration Market Revenue (Million) Forecast, by Application 2020 & 2033
- Table 40: Russia Air Filtration Market Volume (K Unit) Forecast, by Application 2020 & 2033
- Table 41: Turkey Air Filtration Market Revenue (Million) Forecast, by Application 2020 & 2033
- Table 42: Turkey Air Filtration Market Volume (K Unit) Forecast, by Application 2020 & 2033
- Table 43: Italy Air Filtration Market Revenue (Million) Forecast, by Application 2020 & 2033
- Table 44: Italy Air Filtration Market Volume (K Unit) Forecast, by Application 2020 & 2033
- Table 45: Rest of Europe Air Filtration Market Revenue (Million) Forecast, by Application 2020 & 2033
- Table 46: Rest of Europe Air Filtration Market Volume (K Unit) Forecast, by Application 2020 & 2033
- Table 47: Global Air Filtration Market Revenue Million Forecast, by Filtration Technology 2020 & 2033
- Table 48: Global Air Filtration Market Volume K Unit Forecast, by Filtration Technology 2020 & 2033
- Table 49: Global Air Filtration Market Revenue Million Forecast, by Type 2020 & 2033
- Table 50: Global Air Filtration Market Volume K Unit Forecast, by Type 2020 & 2033
- Table 51: Global Air Filtration Market Revenue Million Forecast, by End User 2020 & 2033
- Table 52: Global Air Filtration Market Volume K Unit Forecast, by End User 2020 & 2033
- Table 53: Global Air Filtration Market Revenue Million Forecast, by Country 2020 & 2033
- Table 54: Global Air Filtration Market Volume K Unit Forecast, by Country 2020 & 2033
- Table 55: China Air Filtration Market Revenue (Million) Forecast, by Application 2020 & 2033
- Table 56: China Air Filtration Market Volume (K Unit) Forecast, by Application 2020 & 2033
- Table 57: India Air Filtration Market Revenue (Million) Forecast, by Application 2020 & 2033
- Table 58: India Air Filtration Market Volume (K Unit) Forecast, by Application 2020 & 2033
- Table 59: Japan Air Filtration Market Revenue (Million) Forecast, by Application 2020 & 2033
- Table 60: Japan Air Filtration Market Volume (K Unit) Forecast, by Application 2020 & 2033
- Table 61: Malaysia Air Filtration Market Revenue (Million) Forecast, by Application 2020 & 2033
- Table 62: Malaysia Air Filtration Market Volume (K Unit) Forecast, by Application 2020 & 2033
- Table 63: Thailand Air Filtration Market Revenue (Million) Forecast, by Application 2020 & 2033
- Table 64: Thailand Air Filtration Market Volume (K Unit) Forecast, by Application 2020 & 2033
- Table 65: Indonesia Air Filtration Market Revenue (Million) Forecast, by Application 2020 & 2033
- Table 66: Indonesia Air Filtration Market Volume (K Unit) Forecast, by Application 2020 & 2033
- Table 67: Vietnam Air Filtration Market Revenue (Million) Forecast, by Application 2020 & 2033
- Table 68: Vietnam Air Filtration Market Volume (K Unit) Forecast, by Application 2020 & 2033
- Table 69: Rest of Asia Pacific Air Filtration Market Revenue (Million) Forecast, by Application 2020 & 2033
- Table 70: Rest of Asia Pacific Air Filtration Market Volume (K Unit) Forecast, by Application 2020 & 2033
- Table 71: Global Air Filtration Market Revenue Million Forecast, by Filtration Technology 2020 & 2033
- Table 72: Global Air Filtration Market Volume K Unit Forecast, by Filtration Technology 2020 & 2033
- Table 73: Global Air Filtration Market Revenue Million Forecast, by Type 2020 & 2033
- Table 74: Global Air Filtration Market Volume K Unit Forecast, by Type 2020 & 2033
- Table 75: Global Air Filtration Market Revenue Million Forecast, by End User 2020 & 2033
- Table 76: Global Air Filtration Market Volume K Unit Forecast, by End User 2020 & 2033
- Table 77: Global Air Filtration Market Revenue Million Forecast, by Country 2020 & 2033
- Table 78: Global Air Filtration Market Volume K Unit Forecast, by Country 2020 & 2033
- Table 79: Brazil Air Filtration Market Revenue (Million) Forecast, by Application 2020 & 2033
- Table 80: Brazil Air Filtration Market Volume (K Unit) Forecast, by Application 2020 & 2033
- Table 81: Argentina Air Filtration Market Revenue (Million) Forecast, by Application 2020 & 2033
- Table 82: Argentina Air Filtration Market Volume (K Unit) Forecast, by Application 2020 & 2033
- Table 83: Colombia Air Filtration Market Revenue (Million) Forecast, by Application 2020 & 2033
- Table 84: Colombia Air Filtration Market Volume (K Unit) Forecast, by Application 2020 & 2033
- Table 85: Rest of South America Air Filtration Market Revenue (Million) Forecast, by Application 2020 & 2033
- Table 86: Rest of South America Air Filtration Market Volume (K Unit) Forecast, by Application 2020 & 2033
- Table 87: Global Air Filtration Market Revenue Million Forecast, by Filtration Technology 2020 & 2033
- Table 88: Global Air Filtration Market Volume K Unit Forecast, by Filtration Technology 2020 & 2033
- Table 89: Global Air Filtration Market Revenue Million Forecast, by Type 2020 & 2033
- Table 90: Global Air Filtration Market Volume K Unit Forecast, by Type 2020 & 2033
- Table 91: Global Air Filtration Market Revenue Million Forecast, by End User 2020 & 2033
- Table 92: Global Air Filtration Market Volume K Unit Forecast, by End User 2020 & 2033
- Table 93: Global Air Filtration Market Revenue Million Forecast, by Country 2020 & 2033
- Table 94: Global Air Filtration Market Volume K Unit Forecast, by Country 2020 & 2033
- Table 95: United Arab Emirates Air Filtration Market Revenue (Million) Forecast, by Application 2020 & 2033
- Table 96: United Arab Emirates Air Filtration Market Volume (K Unit) Forecast, by Application 2020 & 2033
- Table 97: Saudi Arabia Air Filtration Market Revenue (Million) Forecast, by Application 2020 & 2033
- Table 98: Saudi Arabia Air Filtration Market Volume (K Unit) Forecast, by Application 2020 & 2033
- Table 99: South Africa Air Filtration Market Revenue (Million) Forecast, by Application 2020 & 2033
- Table 100: South Africa Air Filtration Market Volume (K Unit) Forecast, by Application 2020 & 2033
- Table 101: Nigeria Air Filtration Market Revenue (Million) Forecast, by Application 2020 & 2033
- Table 102: Nigeria Air Filtration Market Volume (K Unit) Forecast, by Application 2020 & 2033
- Table 103: Qatar Air Filtration Market Revenue (Million) Forecast, by Application 2020 & 2033
- Table 104: Qatar Air Filtration Market Volume (K Unit) Forecast, by Application 2020 & 2033
- Table 105: Egypt Air Filtration Market Revenue (Million) Forecast, by Application 2020 & 2033
- Table 106: Egypt Air Filtration Market Volume (K Unit) Forecast, by Application 2020 & 2033
- Table 107: Rest of Middle East and Africa Air Filtration Market Revenue (Million) Forecast, by Application 2020 & 2033
- Table 108: Rest of Middle East and Africa Air Filtration Market Volume (K Unit) Forecast, by Application 2020 & 2033
Frequently Asked Questions
1. What is the projected Compound Annual Growth Rate (CAGR) of the Air Filtration Market?
The projected CAGR is approximately 7.00%.
2. Which companies are prominent players in the Air Filtration Market?
Key companies in the market include Daikin Honeywell , Xiaomi, Coway, 3M .
3. What are the main segments of the Air Filtration Market?
The market segments include Filtration Technology, Type, End User.
4. Can you provide details about the market size?
The market size is estimated to be USD 16.83 Million as of 2022.
5. What are some drivers contributing to market growth?
4.; Upcoming New Renewable Projects in the Country4.; Expansions of Transmission and Distribution Network.
6. What are the notable trends driving market growth?
The High-efficiency Particulate Air (HEPA) Segment is Expected to Dominate the Market.
7. Are there any restraints impacting market growth?
4.; Lack of Private Participation in the Country's Power Sector.
8. Can you provide examples of recent developments in the market?
March 2023: Xiaomi Corp. announced the launch of the MIJIA full-effect air purifier for the Chinese market. The equipment can produce 12,500 liters of air volume per minute, with an estimated virus removal capacity of approximately 99%. Such an enhanced product feature is expected to increase the sale of air purifiers during the forecast period.
9. What pricing options are available for accessing the report?
Pricing options include single-user, multi-user, and enterprise licenses priced at USD 4750, USD 5250, and USD 8750 respectively.
10. Is the market size provided in terms of value or volume?
The market size is provided in terms of value, measured in Million and volume, measured in K Unit.
11. Are there any specific market keywords associated with the report?
Yes, the market keyword associated with the report is "Air Filtration Market," which aids in identifying and referencing the specific market segment covered.
12. How do I determine which pricing option suits my needs best?
The pricing options vary based on user requirements and access needs. Individual users may opt for single-user licenses, while businesses requiring broader access may choose multi-user or enterprise licenses for cost-effective access to the report.
13. Are there any additional resources or data provided in the Air Filtration Market report?
While the report offers comprehensive insights, it's advisable to review the specific contents or supplementary materials provided to ascertain if additional resources or data are available.
14. How can I stay updated on further developments or reports in the Air Filtration Market?
To stay informed about further developments, trends, and reports in the Air Filtration Market, consider subscribing to industry newsletters, following relevant companies and organizations, or regularly checking reputable industry news sources and publications.
Methodology
Step 1 - Identification of Relevant Samples Size from Population Database


Step 2 - Approaches for Defining Global Market Size (Value, Volume* & Price*)

Note*: In applicable scenarios
Step 3 - Data Sources
Primary Research
- Web Analytics
- Survey Reports
- Research Institute
- Latest Research Reports
- Opinion Leaders
Secondary Research
- Annual Reports
- White Paper
- Latest Press Release
- Industry Association
- Paid Database
- Investor Presentations

Step 4 - Data Triangulation
Involves using different sources of information in order to increase the validity of a study
These sources are likely to be stakeholders in a program - participants, other researchers, program staff, other community members, and so on.
Then we put all data in single framework & apply various statistical tools to find out the dynamic on the market.
During the analysis stage, feedback from the stakeholder groups would be compared to determine areas of agreement as well as areas of divergence