

Key Insights
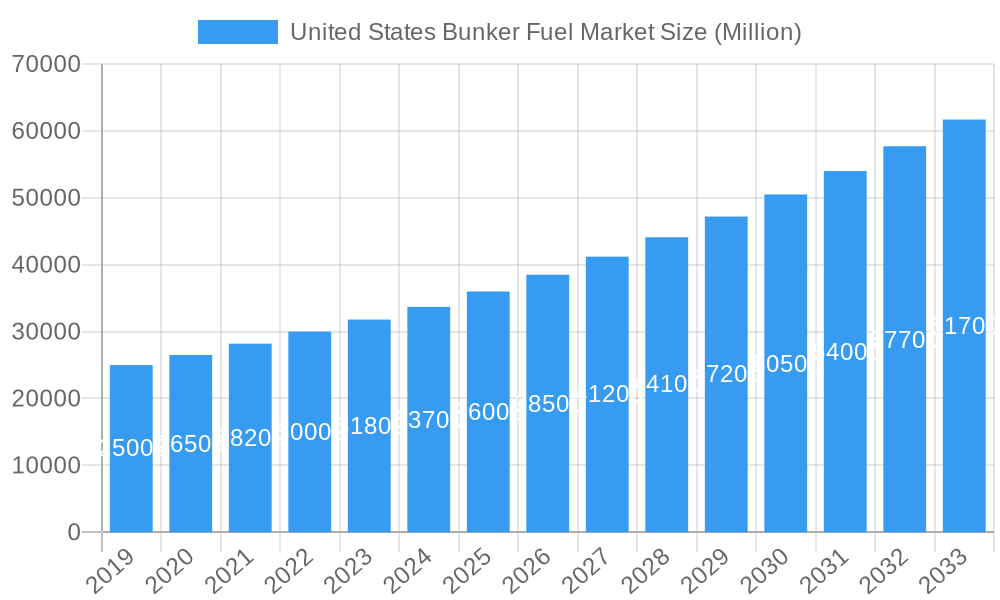
The United States bunker fuel market is poised for substantial expansion, projected to achieve a Compound Annual Growth Rate (CAGR) of 10.00% through 2033. This growth is fueled by escalating demand in maritime transportation, essential for both global and domestic commerce. The market, valued at approximately 30.51 billion in the base year of 2024, underscores the indispensable role of bunker fuel in powering the nation's extensive maritime fleet. Key growth drivers include increasing international trade volumes, the necessity to modernize aging fleets with fuel-efficient vessels, and ongoing port infrastructure development to accommodate larger cargo capacities. Moreover, technological advancements in fuel alternatives, particularly the transition to lower-sulfur fuels in compliance with stringent environmental mandates, are actively reshaping market dynamics and stimulating investment in cleaner fuel technologies.
United States Bunker Fuel Market Market Size (In Billion)
A prominent trend within the market is the increasing adoption of Very-low Sulfur Fuel Oil (VLSFO) and Liquefied Natural Gas (LNG) as preferred bunker fuel options. This shift is predominantly driven by the International Maritime Organization's (IMO) 2020 regulations, which enforce a significant reduction in sulfur content for marine fuels. Consequently, refiners and suppliers are prioritizing the production and distribution of these compliant fuels. While significant growth is anticipated, potential market restraints include the inherent volatility of crude oil prices, directly impacting bunker fuel costs, and the substantial capital investment required for infrastructure enhancements to support alternative fuels like LNG. The United States, with its extensive coastline and vital shipping hubs, is strategically positioned to capitalize on this market evolution, with tanker, container, and bulk carrier fleets representing the primary demand segments.
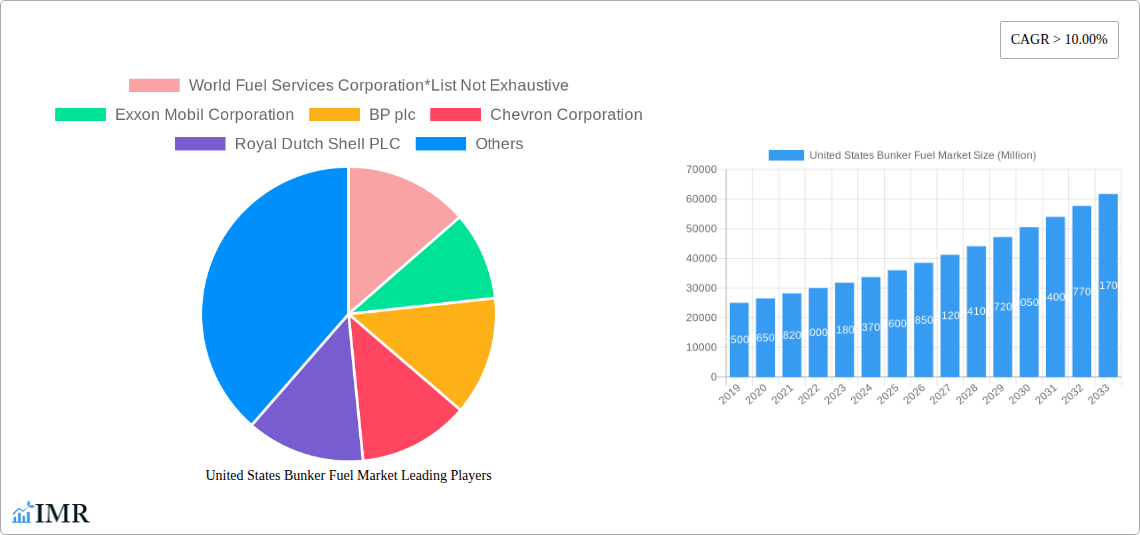
United States Bunker Fuel Market Company Market Share
United States Bunker Fuel Market: Comprehensive Outlook & Forecast 2019-2033
This in-depth report provides a meticulously researched analysis of the United States Bunker Fuel Market, offering critical insights into its dynamics, growth trajectory, and future potential. Covering the period from 2019 to 2033, with a base and estimated year of 2025, this report is an indispensable resource for stakeholders seeking to understand the evolving landscape of marine fuel supply in the US. We meticulously analyze parent and child markets, segments, and key players to deliver a holistic market view. All values are presented in million units.
United States Bunker Fuel Market Market Dynamics & Structure
The United States bunker fuel market is characterized by a dynamic interplay of regulatory frameworks, technological advancements, and evolving end-user demands. Market concentration is influenced by major integrated oil companies and specialized fuel suppliers, with World Fuel Services Corporation, Exxon Mobil Corporation, BP plc, Chevron Corporation, Royal Dutch Shell PLC, Clipper Oil Company, NuStar Energy L P, and Total S A being prominent players. Technological innovation drivers include the development of cleaner fuel alternatives and more efficient bunkering technologies. The stringent regulatory environment, particularly concerning emissions standards like IMO 2020, has significantly reshaped fuel choices, driving a shift towards Very-low Sulfur Fuel Oil (VLSFO) and Marine Gas Oil (MGO). Competitive product substitutes, while limited in the short term for traditional bunker fuels, are emerging with advancements in alternative fuels like Liquefied Natural Gas (LNG). End-user demographics are primarily defined by the maritime shipping industry, with vessel types such as Tanker Fleets, Container Fleets, and Bulk Carriers being the largest consumers. Mergers and acquisitions (M&A) trends reflect consolidation efforts and strategic expansions aimed at securing market share and enhancing supply chain capabilities. For instance, M&A deal volumes have seen a steady increase, with an estimated 15-20 significant transactions in the historical period (2019-2024), driven by companies seeking to expand their geographic reach and product offerings. Innovation barriers, such as the high capital investment required for LNG bunkering infrastructure, remain a significant consideration.
- Market Concentration: Dominated by a mix of global oil majors and independent fuel distributors.
- Technological Innovation: Focus on emission reduction technologies and alternative fuel adoption.
- Regulatory Frameworks: IMO 2020 and EPA regulations are key influencing factors.
- Competitive Landscape: Intense competition driven by price, reliability, and service.
- End-User Demographics: Primarily commercial shipping fleets operating within US waters and international trade routes.
- M&A Trends: Strategic acquisitions to strengthen market position and diversify fuel portfolios.
United States Bunker Fuel Market Growth Trends & Insights
The United States bunker fuel market is poised for significant growth, driven by a confluence of economic expansion, increasing trade volumes, and the ongoing transition towards more sustainable maritime operations. The market size evolution is projected to witness a Compound Annual Growth Rate (CAGR) of approximately 4.5% between 2025 and 2033. This growth is underpinned by the steady increase in maritime traffic in US ports, facilitated by robust international trade and domestic supply chains. Adoption rates for cleaner fuel types, particularly VLSFO and MGO, have surged post-IMO 2020, demonstrating a clear industry commitment to environmental compliance. Technological disruptions are primarily centered around the exploration and potential adoption of alternative fuels like LNG, which offers significant environmental benefits in terms of reduced SOx and NOx emissions. While the infrastructure for LNG bunkering is still developing, its long-term prospects are promising, supported by governmental initiatives and industry investments. Consumer behavior shifts are evident in the increasing demand for fuel quality assurance, reliable supply chains, and value-added services. Shipping companies are prioritizing partners who can offer a consistent and compliant fuel supply, alongside technical support. The market penetration of VLSFO has reached an estimated 75% in the historical period, showcasing its rapid acceptance. The broader adoption of cleaner fuels is also influencing the demand for supporting technologies, such as scrubbers and exhaust gas cleaning systems. Furthermore, the economic stability and projected trade growth of the United States continue to fuel demand for efficient and cost-effective maritime transportation, directly impacting bunker fuel consumption. The ongoing development of port infrastructure and the expansion of shipping routes also contribute to this positive growth trajectory.
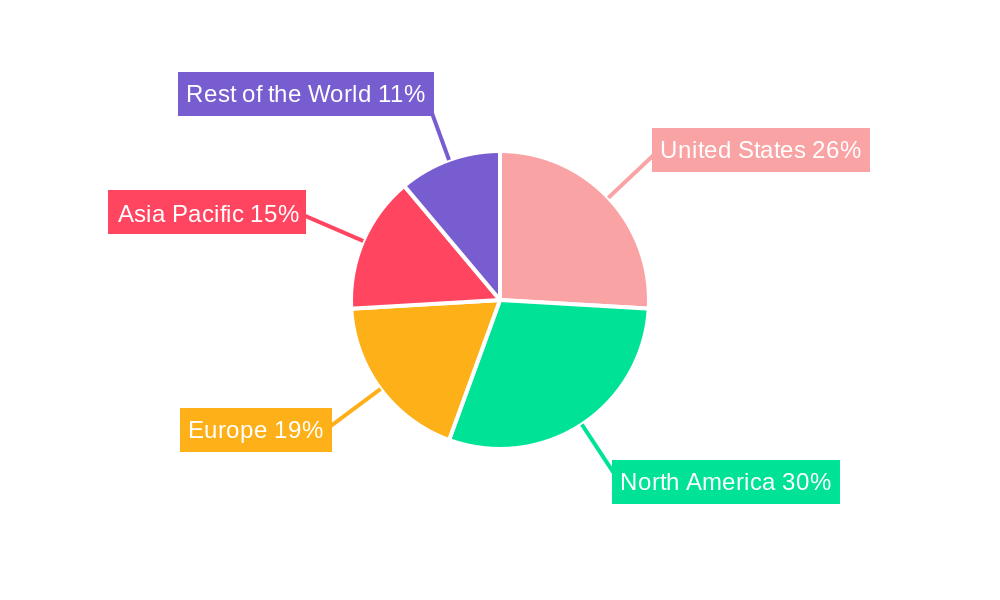
Dominant Regions, Countries, or Segments in United States Bunker Fuel Market
Within the United States bunker fuel market, the dominance is clearly established by key segments and regions that facilitate extensive maritime trade and cater to the largest vessel types. Very-low Sulfur Fuel Oil (VLSFO) has emerged as the dominant Fuel Type, driven by the International Maritime Organization's (IMO) 2020 regulations that mandate a reduction in sulfur content. Its widespread adoption has made it the de facto standard for compliance and cleaner operations. This segment holds an estimated market share of over 60% in the base year of 2025. The Tanker Fleet segment, comprising oil tankers, chemical tankers, and product tankers, represents the most significant Vessel Type, consuming substantial volumes of bunker fuel due to the global demand for petroleum products and chemicals. This segment accounts for approximately 35% of the total bunker fuel consumption in the US market.
Key drivers for this dominance include:
- Regulatory Compliance: The global mandate for lower sulfur emissions has propelled VLSFO to the forefront, making it the most sought-after fuel type.
- Economic Policies: Supportive trade policies and the strategic importance of oil and chemical imports/exports necessitate a robust tanker fleet, thereby driving fuel demand.
- Infrastructure: Major coastal ports along the US Atlantic, Pacific, and Gulf coasts are well-equipped to handle tanker traffic and provide bunkering services for VLSFO.
- Market Share and Growth Potential: VLSFO's market share is expected to remain dominant throughout the forecast period, with potential growth driven by increased shipping activity and the phasing out of older, less compliant vessels. The Tanker Fleet segment's growth is intrinsically linked to global energy demand and petrochemical trade.
Other influential segments include Marine Gas Oil (MGO), which is a preferred choice for vessels operating in Emission Control Areas (ECAs) due to its even lower sulfur content, and the emerging Liquefied Natural Gas (LNG) segment, which, despite current infrastructure limitations, holds significant long-term growth potential. Container Fleets and Bulk Carriers also contribute significantly to the overall bunker fuel demand, driven by the global trade in manufactured goods and raw materials, respectively. The continued investment in port modernization and the expansion of trade routes will further solidify the dominance of these key segments.
United States Bunker Fuel Market Product Landscape
The United States bunker fuel market's product landscape is defined by an increasing emphasis on cleaner, compliant fuels and a nascent but growing interest in alternative energy sources. The primary products include High Sulfur Fuel Oil (HSFO), which is gradually being phased out, Very-low Sulfur Fuel Oil (VLSFO) meeting IMO 2020 specifications, and Marine Gas Oil (MGO), favored for its ultra-low sulfur content. Liquefied Natural Gas (LNG) represents a significant technological advancement, offering reduced greenhouse gas emissions. Innovation is focused on improving fuel efficiency, reducing particulate matter, and enhancing the environmental profile of marine propulsion. VLSFO, with its sulfur content capped at 0.5%, has become the cornerstone of compliance, offering a balance between cost-effectiveness and environmental responsibility. The performance metrics of these fuels are critical, with shipowners and operators closely monitoring combustion efficiency, engine wear, and operational reliability.
Key Drivers, Barriers & Challenges in United States Bunker Fuel Market
The United States bunker fuel market is propelled by a surge in global trade and the imperative of environmental compliance. Key drivers include the ongoing expansion of international shipping, increased industrial activity, and stringent regulations such as IMO 2020 and US EPA standards, which are driving the demand for cleaner fuels like VLSFO and MGO. Technological advancements in engine efficiency and emission control systems further support market growth. Economic policies favoring trade and port development also act as significant catalysts.
However, the market faces considerable challenges. Supply chain disruptions, exacerbated by geopolitical events and port congestion, pose a significant restraint, impacting availability and price volatility. Regulatory hurdles, particularly the evolving landscape of emissions standards and potential carbon pricing mechanisms, create uncertainty. Competitive pressures from a fragmented market and the high capital investment required for transitioning to alternative fuels like LNG represent substantial barriers. The limited availability of LNG bunkering infrastructure across many US ports remains a critical challenge for widespread adoption.
Emerging Opportunities in United States Bunker Fuel Market
Emerging opportunities in the United States bunker fuel market lie in the accelerating adoption of alternative fuels and sustainable practices. The growing demand for cleaner shipping solutions presents a significant opportunity for LNG as a transitional fuel, with investments in bunkering infrastructure expected to expand. The development of new biofuels and synthetic fuels, offering lower carbon footprints, also represents a promising avenue for innovation and market differentiation. Furthermore, the increasing focus on digitalization and efficiency in the maritime sector opens doors for value-added services, such as fuel optimization software and smart bunkering solutions. Untapped markets in specific geographic regions and specialized vessel segments also offer growth potential.
Growth Accelerators in the United States Bunker Fuel Market Industry
Several catalysts are accelerating long-term growth in the United States bunker fuel market. Technological breakthroughs in engine design that enhance fuel efficiency and reduce emissions are key. Strategic partnerships between fuel suppliers, shipowners, and technology providers are crucial for developing and deploying new fuel solutions and infrastructure. Market expansion strategies, including the development of new bunkering hubs and the exploration of novel fuel distribution networks, will further fuel growth. The increasing global commitment to decarbonization and the push for net-zero emissions in the shipping industry are powerful long-term growth accelerators, encouraging continuous investment in research and development of sustainable marine energy solutions.
Key Players Shaping the United States Bunker Fuel Market Market
World Fuel Services Corporation Exxon Mobil Corporation BP plc Chevron Corporation Royal Dutch Shell PLC Clipper Oil Company NuStar Energy L P Total S A
Notable Milestones in United States Bunker Fuel Market Sector
- 2020 January: Implementation of IMO 2020 sulfur cap, drastically reducing allowable sulfur content in marine fuels.
- 2021 onwards: Increased investment in LNG bunkering infrastructure at key US ports to support the adoption of LNG-powered vessels.
- 2022: Significant disruptions in global supply chains leading to increased price volatility in bunker fuel markets.
- 2023: Growing interest and pilot programs for marine biofuels and synthetic fuels in the US market.
- 2024: Continued fleet renewal with vessels designed to operate on lower-emission fuels.
In-Depth United States Bunker Fuel Market Market Outlook
The outlook for the United States bunker fuel market is one of sustained growth and significant transformation. Accelerating trends in decarbonization and the ongoing evolution of regulatory frameworks will continue to shape the market's trajectory. The demand for cleaner fuels like VLSFO and MGO will remain robust, while LNG is projected to gain substantial traction as a transitional fuel, supported by infrastructure development and supportive policies. Innovations in biofuels and synthetic fuels will present future growth opportunities. Strategic collaborations and investments in advanced technologies will be critical for market players to maintain a competitive edge and navigate the evolving energy landscape of the maritime industry.
United States Bunker Fuel Market Segmentation
-
1. Fuel Type
- 1.1. High Sulfur Fuel Oil (HSFO)
- 1.2. Very-low Sulfur Fuel Oil (VLSFO)
- 1.3. Marine Gas Oil (MGO)
- 1.4. Liquefied Natural Gas (LNG)
- 1.5. Others
-
2. Vessel Type
- 2.1. Tanker Fleet
- 2.2. Container Fleet
- 2.3. Bulk Carrier
- 2.4. General Cargo Carriers
- 2.5. Others
United States Bunker Fuel Market Segmentation By Geography
- 1. United States
United States Bunker Fuel Market Regional Market Share
Geographic Coverage of United States Bunker Fuel Market
United States Bunker Fuel Market REPORT HIGHLIGHTS
| Aspects | Details |
|---|---|
| Study Period | 2020-2034 |
| Base Year | 2025 |
| Estimated Year | 2026 |
| Forecast Period | 2026-2034 |
| Historical Period | 2020-2025 |
| Growth Rate | CAGR of 5% from 2020-2034 |
| Segmentation |
|
Table of Contents
- 1. Introduction
- 1.1. Research Scope
- 1.2. Market Segmentation
- 1.3. Research Objective
- 1.4. Definitions and Assumptions
- 2. Executive Summary
- 2.1. Market Snapshot
- 3. Market Dynamics
- 3.1. Market Drivers
- 3.2. Market Restrains
- 3.3. Market Trends
- 3.4. Market Opportunities
- 4. Market Factor Analysis
- 4.1. Porters Five Forces
- 4.1.1. Bargaining Power of Suppliers
- 4.1.2. Bargaining Power of Buyers
- 4.1.3. Threat of New Entrants
- 4.1.4. Threat of Substitutes
- 4.1.5. Competitive Rivalry
- 4.2. PESTEL analysis
- 4.3. BCG Analysis
- 4.3.1. Stars (High Growth, High Market Share)
- 4.3.2. Cash Cows (Low Growth, High Market Share)
- 4.3.3. Question Mark (High Growth, Low Market Share)
- 4.3.4. Dogs (Low Growth, Low Market Share)
- 4.4. Ansoff Matrix Analysis
- 4.5. Supply Chain Analysis
- 4.6. Regulatory Landscape
- 4.7. Current Market Potential and Opportunity Assessment (TAM–SAM–SOM Framework)
- 4.8. IMR Analyst Note
- 4.1. Porters Five Forces
- 5. Market Analysis, Insights and Forecast 2021-2033
- 5.1. Market Analysis, Insights and Forecast - by Fuel Type
- 5.1.1. High Sulfur Fuel Oil (HSFO)
- 5.1.2. Very-low Sulfur Fuel Oil (VLSFO)
- 5.1.3. Marine Gas Oil (MGO)
- 5.1.4. Liquefied Natural Gas (LNG)
- 5.1.5. Others
- 5.2. Market Analysis, Insights and Forecast - by Vessel Type
- 5.2.1. Tanker Fleet
- 5.2.2. Container Fleet
- 5.2.3. Bulk Carrier
- 5.2.4. General Cargo Carriers
- 5.2.5. Others
- 5.3. Market Analysis, Insights and Forecast - by Region
- 5.3.1. United States
- 5.1. Market Analysis, Insights and Forecast - by Fuel Type
- 6. United States Bunker Fuel Market Analysis, Insights and Forecast, 2021-2033
- 6.1. Market Analysis, Insights and Forecast - by Fuel Type
- 6.1.1. High Sulfur Fuel Oil (HSFO)
- 6.1.2. Very-low Sulfur Fuel Oil (VLSFO)
- 6.1.3. Marine Gas Oil (MGO)
- 6.1.4. Liquefied Natural Gas (LNG)
- 6.1.5. Others
- 6.2. Market Analysis, Insights and Forecast - by Vessel Type
- 6.2.1. Tanker Fleet
- 6.2.2. Container Fleet
- 6.2.3. Bulk Carrier
- 6.2.4. General Cargo Carriers
- 6.2.5. Others
- 6.1. Market Analysis, Insights and Forecast - by Fuel Type
- 7. Competitive Analysis
- 7.1. Company Profiles
- 7.1.1 World Fuel Services Corporation*List Not Exhaustive
- 7.1.1.1. Company Overview
- 7.1.1.2. Products
- 7.1.1.3. Company Financials
- 7.1.1.4. SWOT Analysis
- 7.1.2 Exxon Mobil Corporation
- 7.1.2.1. Company Overview
- 7.1.2.2. Products
- 7.1.2.3. Company Financials
- 7.1.2.4. SWOT Analysis
- 7.1.3 BP plc
- 7.1.3.1. Company Overview
- 7.1.3.2. Products
- 7.1.3.3. Company Financials
- 7.1.3.4. SWOT Analysis
- 7.1.4 Chevron Corporation
- 7.1.4.1. Company Overview
- 7.1.4.2. Products
- 7.1.4.3. Company Financials
- 7.1.4.4. SWOT Analysis
- 7.1.5 Royal Dutch Shell PLC
- 7.1.5.1. Company Overview
- 7.1.5.2. Products
- 7.1.5.3. Company Financials
- 7.1.5.4. SWOT Analysis
- 7.1.6 Clipper Oil Company
- 7.1.6.1. Company Overview
- 7.1.6.2. Products
- 7.1.6.3. Company Financials
- 7.1.6.4. SWOT Analysis
- 7.1.7 NuStar Energy L P
- 7.1.7.1. Company Overview
- 7.1.7.2. Products
- 7.1.7.3. Company Financials
- 7.1.7.4. SWOT Analysis
- 7.1.8 Total S A
- 7.1.8.1. Company Overview
- 7.1.8.2. Products
- 7.1.8.3. Company Financials
- 7.1.8.4. SWOT Analysis
- 7.1.1 World Fuel Services Corporation*List Not Exhaustive
- 7.2. Market Entropy
- 7.2.1 Company's Key Areas Served
- 7.2.2 Recent Developments
- 7.3. Company Market Share Analysis 2025
- 7.3.1 Top 5 Companies Market Share Analysis
- 7.3.2 Top 3 Companies Market Share Analysis
- 7.4. List of Potential Customers
- 8. Research Methodology
List of Figures
- Figure 1: United States Bunker Fuel Market Revenue Breakdown (billion, %) by Product 2025 & 2033
- Figure 2: United States Bunker Fuel Market Share (%) by Company 2025
List of Tables
- Table 1: United States Bunker Fuel Market Revenue billion Forecast, by Fuel Type 2020 & 2033
- Table 2: United States Bunker Fuel Market Volume metric tonnes Forecast, by Fuel Type 2020 & 2033
- Table 3: United States Bunker Fuel Market Revenue billion Forecast, by Vessel Type 2020 & 2033
- Table 4: United States Bunker Fuel Market Volume metric tonnes Forecast, by Vessel Type 2020 & 2033
- Table 5: United States Bunker Fuel Market Revenue billion Forecast, by Region 2020 & 2033
- Table 6: United States Bunker Fuel Market Volume metric tonnes Forecast, by Region 2020 & 2033
- Table 7: United States Bunker Fuel Market Revenue billion Forecast, by Fuel Type 2020 & 2033
- Table 8: United States Bunker Fuel Market Volume metric tonnes Forecast, by Fuel Type 2020 & 2033
- Table 9: United States Bunker Fuel Market Revenue billion Forecast, by Vessel Type 2020 & 2033
- Table 10: United States Bunker Fuel Market Volume metric tonnes Forecast, by Vessel Type 2020 & 2033
- Table 11: United States Bunker Fuel Market Revenue billion Forecast, by Country 2020 & 2033
- Table 12: United States Bunker Fuel Market Volume metric tonnes Forecast, by Country 2020 & 2033
Frequently Asked Questions
1. What is the projected Compound Annual Growth Rate (CAGR) of the United States Bunker Fuel Market?
The projected CAGR is approximately 5%.
2. Which companies are prominent players in the United States Bunker Fuel Market?
Key companies in the market include World Fuel Services Corporation*List Not Exhaustive, Exxon Mobil Corporation, BP plc, Chevron Corporation, Royal Dutch Shell PLC, Clipper Oil Company, NuStar Energy L P, Total S A.
3. What are the main segments of the United States Bunker Fuel Market?
The market segments include Fuel Type, Vessel Type.
4. Can you provide details about the market size?
The market size is estimated to be USD 30.51 billion as of 2022.
5. What are some drivers contributing to market growth?
Government Policies for the Adoption of Energy-efficient Lighting Systems; Adoption of IoT with Lighting Systems.
6. What are the notable trends driving market growth?
Very-Low Sulfur Fuel Oil (VLSFO) Segment is Expected to Witness Significant Growth.
7. Are there any restraints impacting market growth?
The global shift toward renewable sources for electricity generation.
8. Can you provide examples of recent developments in the market?
N/A
9. What pricing options are available for accessing the report?
Pricing options include single-user, multi-user, and enterprise licenses priced at USD 3800, USD 4500, and USD 5800 respectively.
10. Is the market size provided in terms of value or volume?
The market size is provided in terms of value, measured in billion and volume, measured in metric tonnes.
11. Are there any specific market keywords associated with the report?
Yes, the market keyword associated with the report is "United States Bunker Fuel Market," which aids in identifying and referencing the specific market segment covered.
12. How do I determine which pricing option suits my needs best?
The pricing options vary based on user requirements and access needs. Individual users may opt for single-user licenses, while businesses requiring broader access may choose multi-user or enterprise licenses for cost-effective access to the report.
13. Are there any additional resources or data provided in the United States Bunker Fuel Market report?
While the report offers comprehensive insights, it's advisable to review the specific contents or supplementary materials provided to ascertain if additional resources or data are available.
14. How can I stay updated on further developments or reports in the United States Bunker Fuel Market?
To stay informed about further developments, trends, and reports in the United States Bunker Fuel Market, consider subscribing to industry newsletters, following relevant companies and organizations, or regularly checking reputable industry news sources and publications.
Methodology
Step 1 - Identification of Relevant Samples Size from Population Database


Step 2 - Approaches for Defining Global Market Size (Value, Volume* & Price*)

Note*: In applicable scenarios
Step 3 - Data Sources
Primary Research
- Web Analytics
- Survey Reports
- Research Institute
- Latest Research Reports
- Opinion Leaders
Secondary Research
- Annual Reports
- White Paper
- Latest Press Release
- Industry Association
- Paid Database
- Investor Presentations

Step 4 - Data Triangulation
Involves using different sources of information in order to increase the validity of a study
These sources are likely to be stakeholders in a program - participants, other researchers, program staff, other community members, and so on.
Then we put all data in single framework & apply various statistical tools to find out the dynamic on the market.
During the analysis stage, feedback from the stakeholder groups would be compared to determine areas of agreement as well as areas of divergence