

Key Insights
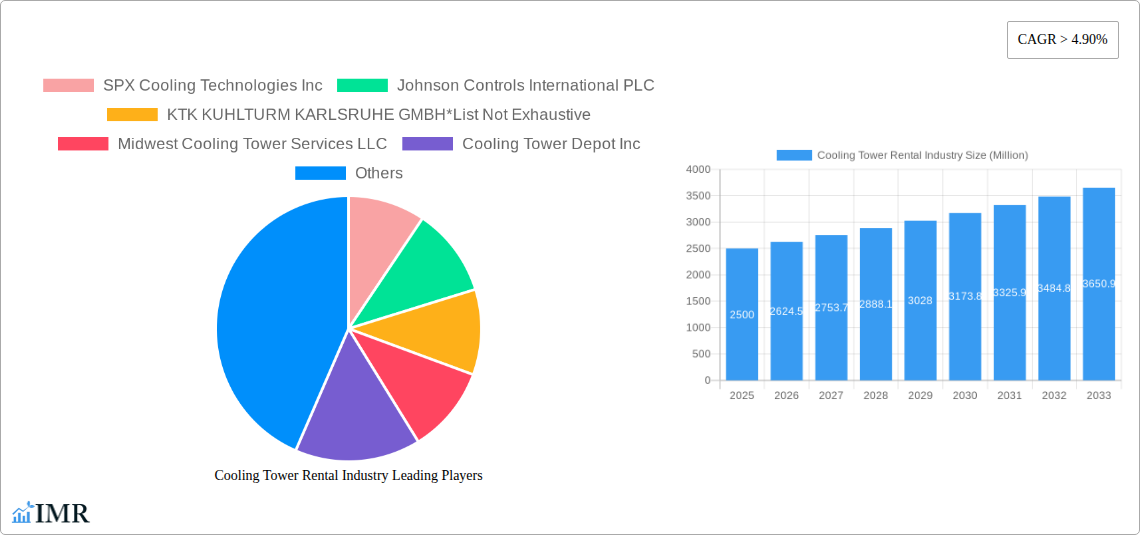
The cooling tower rental market is experiencing robust growth, driven by increasing demand across various sectors. A compound annual growth rate (CAGR) exceeding 4.90% indicates a significant expansion, projected to continue through 2033. This growth is fueled by several key factors. Firstly, the rising adoption of temporary cooling solutions in industries like construction, manufacturing, and data centers reduces upfront capital expenditure and offers flexibility to adjust capacity based on project needs. Secondly, the increasing focus on energy efficiency and sustainability is pushing adoption of rental solutions offering advanced technologies and optimized energy consumption. Lastly, the convenience and cost-effectiveness of rental services, particularly for short-term projects or unexpected equipment failures, contribute significantly to market expansion. The market is segmented by type (wet, dry, hybrid) and end-user (commercial, industrial), with the industrial segment currently dominating due to higher cooling demands. Geographically, North America and Europe hold significant market share, but the Asia-Pacific region exhibits strong growth potential due to rapid industrialization and infrastructure development. Major players like SPX Cooling Technologies, Johnson Controls, and Aggreko are actively shaping the market through technological advancements, strategic partnerships, and expansion into new regions.
The competitive landscape is characterized by a mix of large multinational corporations and specialized rental providers. Large companies offer a wider range of equipment and global reach, while smaller, regional providers cater to niche markets and offer localized services. Challenges facing the market include fluctuating raw material prices, supply chain disruptions, and the need for skilled technicians to operate and maintain these complex systems. However, the ongoing investments in infrastructure development and the rise in industrial activity across emerging economies are expected to offset these challenges, ensuring continued growth and expansion of the cooling tower rental market over the forecast period. The shift towards sustainable and energy-efficient technologies will also drive innovation and further fuel market expansion in the coming years.
Cooling Tower Rental Market Report: 2019-2033
This comprehensive report provides a detailed analysis of the Cooling Tower Rental market, encompassing market dynamics, growth trends, regional analysis, product landscape, key players, and future outlook. The study period spans from 2019 to 2033, with 2025 serving as the base and estimated year. This report is essential for industry professionals, investors, and stakeholders seeking a deep understanding of this dynamic market.
Cooling Tower Rental Industry Market Dynamics & Structure
The global cooling tower rental market is characterized by moderate concentration, with a few major players and numerous smaller regional operators. Technological innovation, primarily focusing on energy efficiency and remote monitoring, is a key driver. Stringent environmental regulations, particularly concerning water consumption and emissions, shape market dynamics. Competitive substitutes include evaporative coolers and air-cooled systems, although cooling towers often maintain a competitive edge in high-heat applications. The end-user demographics are predominantly industrial (power generation, refineries, manufacturing) and commercial (HVAC in large buildings). M&A activity has been relatively stable, with consolidation among smaller players a recurring trend.
- Market Concentration: Moderately concentrated, with top 5 players holding approximately xx% market share in 2024.
- Technological Innovation: Focus on energy efficiency, automation, and remote monitoring capabilities.
- Regulatory Framework: Stringent environmental regulations driving demand for advanced, energy-efficient solutions.
- Competitive Substitutes: Evaporative coolers and air-cooled systems pose some level of competition.
- M&A Activity: xx deals recorded between 2019 and 2024, with an average deal value of $xx million.
- Innovation Barriers: High R&D costs and stringent regulatory compliance requirements.
Cooling Tower Rental Industry Growth Trends & Insights
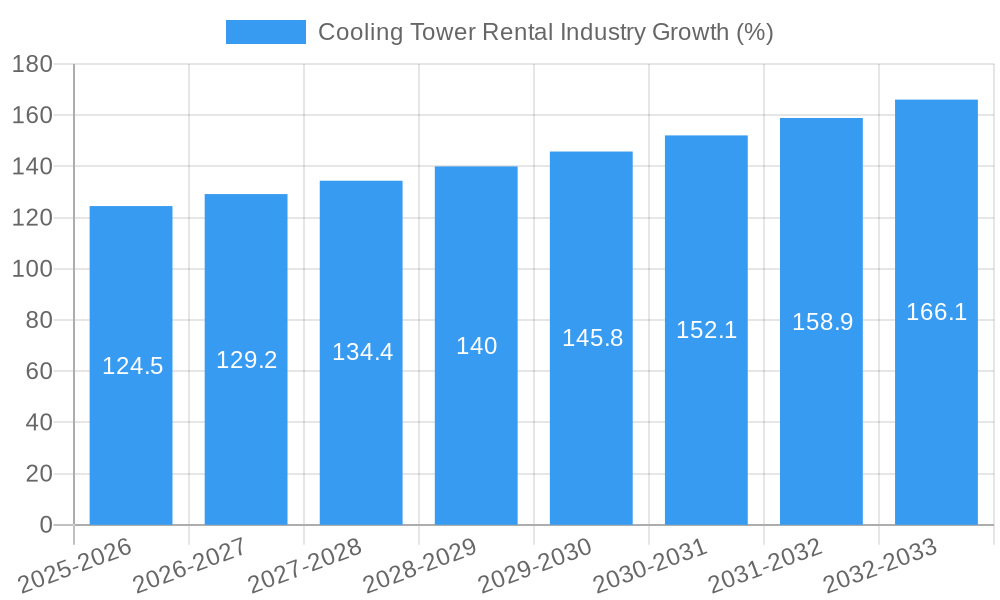
The cooling tower rental market experienced fluctuating growth during the historical period (2019-2024), significantly impacted by the COVID-19 pandemic. Post-pandemic recovery is expected to drive substantial growth during the forecast period (2025-2033). Adoption rates are rising across various industries driven by increased operational efficiency, reduced capital expenditure requirements and flexibility to meet short-term cooling demands. Technological disruptions, such as IoT integration and AI-powered predictive maintenance, are expected to further enhance market growth. The shift towards sustainable practices is influencing consumer behavior, with a rising preference for energy-efficient and environmentally friendly cooling solutions. The market is projected to reach $xx million by 2033, exhibiting a CAGR of xx% during the forecast period.
Dominant Regions, Countries, or Segments in Cooling Tower Rental Industry
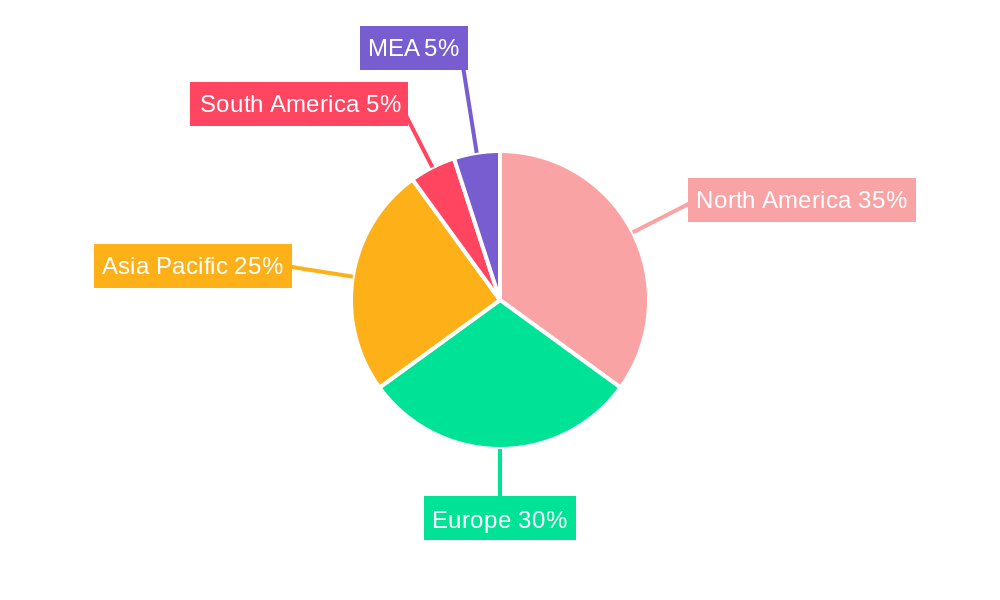
North America and Europe currently dominate the cooling tower rental market, driven by robust industrial activity and stringent environmental regulations. Within these regions, the industrial segment (specifically, power generation and refineries) constitutes the largest end-user group. The Wet cooling tower type holds the largest market share due to its cost-effectiveness and widespread applicability. Asia-Pacific is expected to show significant growth in the forecast period due to rapid industrialization and infrastructure development.
- Leading Region: North America
- Leading Segment (Type): Wet cooling towers
- Leading Segment (End User): Industrial (power generation, refineries)
- Key Growth Drivers:
- Strong industrial growth in developing economies.
- Increasing demand for energy-efficient cooling solutions.
- Stringent environmental regulations promoting sustainable cooling technologies.
- Growing adoption of rental services due to operational flexibility and cost-effectiveness.
Cooling Tower Rental Industry Product Landscape
Cooling tower rental offerings encompass a range of capacities and configurations to cater to diverse cooling needs. Innovations focus on advanced materials, improved energy efficiency, and remote monitoring capabilities for optimized performance and reduced maintenance. Key features often include advanced controls, modular designs, and customizable configurations to meet specific application requirements. The market is witnessing a rising trend toward more compact and environmentally friendly units.
Key Drivers, Barriers & Challenges in Cooling Tower Rental Industry
Key Drivers:
- Growing industrialization and infrastructure development in emerging markets.
- Increasing demand for energy-efficient and sustainable cooling solutions.
- Rise in short-term cooling needs across diverse industries.
Key Challenges & Restraints:
- Fluctuations in raw material prices impacting manufacturing costs.
- Stringent environmental regulations increasing compliance costs.
- Intense competition among rental providers, potentially leading to price pressure.
- Supply chain disruptions and logistics challenges.
Emerging Opportunities in Cooling Tower Rental Industry
- Expansion into underserved markets, particularly in developing economies.
- Development of specialized cooling solutions for niche applications (e.g., data centers, renewable energy).
- Leveraging technological advancements such as IoT and AI for predictive maintenance and optimized energy management.
Growth Accelerators in the Cooling Tower Rental Industry
Strategic partnerships and collaborations among rental companies and technology providers are expected to accelerate market growth. Technological advancements, especially in energy efficiency and remote monitoring, will further fuel demand. The expansion into new geographic regions and diversification of service offerings will also significantly contribute to market expansion.
Key Players Shaping the Cooling Tower Rental Industry Market
- SPX Cooling Technologies Inc
- Johnson Controls International PLC
- KTK KUHLTURM KARLSRUHE GMBH
- Midwest Cooling Tower Services LLC
- Cooling Tower Depot Inc
- Caterpillar Inc
- Aggreko PLC
- Baltimore Aircoil Co
- Carrier Rental Systems Inc
- United Rentals Inc
Notable Milestones in Cooling Tower Rental Industry Sector
- 2020 Q2: Significant drop in demand due to COVID-19-related shutdowns in various industries.
- 2021 Q3: Gradual market recovery as industries resumed operations.
- 2022: Increased focus on energy-efficient and sustainable cooling solutions.
- 2023: Several key players launched advanced monitoring and control systems for their rental cooling towers.
In-Depth Cooling Tower Rental Industry Market Outlook
The cooling tower rental market is poised for strong growth driven by increasing industrial activity, rising demand for energy-efficient cooling, and technological advancements. Strategic partnerships, geographic expansion, and service diversification will play a critical role in shaping the market's future. The focus on sustainable solutions and adoption of advanced technologies will continue to drive the market's expansion in the coming years.
Cooling Tower Rental Industry Segmentation
-
1. Type
- 1.1. Wet
- 1.2. Dry
- 1.3. Hybrid
-
2. End User
- 2.1. Commercial
- 2.2. Industrial
Cooling Tower Rental Industry Segmentation By Geography
- 1. North America
- 2. Europe
- 3. Asia Pacific
- 4. Middle East and Africa
- 5. South America
Cooling Tower Rental Industry REPORT HIGHLIGHTS
| Aspects | Details |
|---|---|
| Study Period | 2019-2033 |
| Base Year | 2024 |
| Estimated Year | 2025 |
| Forecast Period | 2025-2033 |
| Historical Period | 2019-2024 |
| Growth Rate | CAGR of > 4.90% from 2019-2033 |
| Segmentation |
|
Table of Contents
- 1. Introduction
- 1.1. Research Scope
- 1.2. Market Segmentation
- 1.3. Research Methodology
- 1.4. Definitions and Assumptions
- 2. Executive Summary
- 2.1. Introduction
- 3. Market Dynamics
- 3.1. Introduction
- 3.2. Market Drivers
- 3.2.1. 4.; Favorable Government Policies
- 3.3. Market Restrains
- 3.3.1. 4.; Rising Emphasis on Other Alternative Clean Energy Sources
- 3.4. Market Trends
- 3.4.1. Industrial Segment to Dominate the Market
- 4. Market Factor Analysis
- 4.1. Porters Five Forces
- 4.2. Supply/Value Chain
- 4.3. PESTEL analysis
- 4.4. Market Entropy
- 4.5. Patent/Trademark Analysis
- 5. Global Cooling Tower Rental Industry Analysis, Insights and Forecast, 2019-2031
- 5.1. Market Analysis, Insights and Forecast - by Type
- 5.1.1. Wet
- 5.1.2. Dry
- 5.1.3. Hybrid
- 5.2. Market Analysis, Insights and Forecast - by End User
- 5.2.1. Commercial
- 5.2.2. Industrial
- 5.3. Market Analysis, Insights and Forecast - by Region
- 5.3.1. North America
- 5.3.2. Europe
- 5.3.3. Asia Pacific
- 5.3.4. Middle East and Africa
- 5.3.5. South America
- 5.1. Market Analysis, Insights and Forecast - by Type
- 6. North America Cooling Tower Rental Industry Analysis, Insights and Forecast, 2019-2031
- 6.1. Market Analysis, Insights and Forecast - by Type
- 6.1.1. Wet
- 6.1.2. Dry
- 6.1.3. Hybrid
- 6.2. Market Analysis, Insights and Forecast - by End User
- 6.2.1. Commercial
- 6.2.2. Industrial
- 6.1. Market Analysis, Insights and Forecast - by Type
- 7. Europe Cooling Tower Rental Industry Analysis, Insights and Forecast, 2019-2031
- 7.1. Market Analysis, Insights and Forecast - by Type
- 7.1.1. Wet
- 7.1.2. Dry
- 7.1.3. Hybrid
- 7.2. Market Analysis, Insights and Forecast - by End User
- 7.2.1. Commercial
- 7.2.2. Industrial
- 7.1. Market Analysis, Insights and Forecast - by Type
- 8. Asia Pacific Cooling Tower Rental Industry Analysis, Insights and Forecast, 2019-2031
- 8.1. Market Analysis, Insights and Forecast - by Type
- 8.1.1. Wet
- 8.1.2. Dry
- 8.1.3. Hybrid
- 8.2. Market Analysis, Insights and Forecast - by End User
- 8.2.1. Commercial
- 8.2.2. Industrial
- 8.1. Market Analysis, Insights and Forecast - by Type
- 9. Middle East and Africa Cooling Tower Rental Industry Analysis, Insights and Forecast, 2019-2031
- 9.1. Market Analysis, Insights and Forecast - by Type
- 9.1.1. Wet
- 9.1.2. Dry
- 9.1.3. Hybrid
- 9.2. Market Analysis, Insights and Forecast - by End User
- 9.2.1. Commercial
- 9.2.2. Industrial
- 9.1. Market Analysis, Insights and Forecast - by Type
- 10. South America Cooling Tower Rental Industry Analysis, Insights and Forecast, 2019-2031
- 10.1. Market Analysis, Insights and Forecast - by Type
- 10.1.1. Wet
- 10.1.2. Dry
- 10.1.3. Hybrid
- 10.2. Market Analysis, Insights and Forecast - by End User
- 10.2.1. Commercial
- 10.2.2. Industrial
- 10.1. Market Analysis, Insights and Forecast - by Type
- 11. North America Cooling Tower Rental Industry Analysis, Insights and Forecast, 2019-2031
- 11.1. Market Analysis, Insights and Forecast - By Country/Sub-region
- 11.1.1 United States
- 11.1.2 Canada
- 11.1.3 Mexico
- 12. Europe Cooling Tower Rental Industry Analysis, Insights and Forecast, 2019-2031
- 12.1. Market Analysis, Insights and Forecast - By Country/Sub-region
- 12.1.1 Germany
- 12.1.2 United Kingdom
- 12.1.3 France
- 12.1.4 Spain
- 12.1.5 Italy
- 12.1.6 Spain
- 12.1.7 Belgium
- 12.1.8 Netherland
- 12.1.9 Nordics
- 12.1.10 Rest of Europe
- 13. Asia Pacific Cooling Tower Rental Industry Analysis, Insights and Forecast, 2019-2031
- 13.1. Market Analysis, Insights and Forecast - By Country/Sub-region
- 13.1.1 China
- 13.1.2 Japan
- 13.1.3 India
- 13.1.4 South Korea
- 13.1.5 Southeast Asia
- 13.1.6 Australia
- 13.1.7 Indonesia
- 13.1.8 Phillipes
- 13.1.9 Singapore
- 13.1.10 Thailandc
- 13.1.11 Rest of Asia Pacific
- 14. South America Cooling Tower Rental Industry Analysis, Insights and Forecast, 2019-2031
- 14.1. Market Analysis, Insights and Forecast - By Country/Sub-region
- 14.1.1 Brazil
- 14.1.2 Argentina
- 14.1.3 Peru
- 14.1.4 Chile
- 14.1.5 Colombia
- 14.1.6 Ecuador
- 14.1.7 Venezuela
- 14.1.8 Rest of South America
- 15. North America Cooling Tower Rental Industry Analysis, Insights and Forecast, 2019-2031
- 15.1. Market Analysis, Insights and Forecast - By Country/Sub-region
- 15.1.1 United States
- 15.1.2 Canada
- 15.1.3 Mexico
- 16. MEA Cooling Tower Rental Industry Analysis, Insights and Forecast, 2019-2031
- 16.1. Market Analysis, Insights and Forecast - By Country/Sub-region
- 16.1.1 United Arab Emirates
- 16.1.2 Saudi Arabia
- 16.1.3 South Africa
- 16.1.4 Rest of Middle East and Africa
- 17. Competitive Analysis
- 17.1. Global Market Share Analysis 2024
- 17.2. Company Profiles
- 17.2.1 SPX Cooling Technologies Inc
- 17.2.1.1. Overview
- 17.2.1.2. Products
- 17.2.1.3. SWOT Analysis
- 17.2.1.4. Recent Developments
- 17.2.1.5. Financials (Based on Availability)
- 17.2.2 Johnson Controls International PLC
- 17.2.2.1. Overview
- 17.2.2.2. Products
- 17.2.2.3. SWOT Analysis
- 17.2.2.4. Recent Developments
- 17.2.2.5. Financials (Based on Availability)
- 17.2.3 KTK KUHLTURM KARLSRUHE GMBH*List Not Exhaustive
- 17.2.3.1. Overview
- 17.2.3.2. Products
- 17.2.3.3. SWOT Analysis
- 17.2.3.4. Recent Developments
- 17.2.3.5. Financials (Based on Availability)
- 17.2.4 Midwest Cooling Tower Services LLC
- 17.2.4.1. Overview
- 17.2.4.2. Products
- 17.2.4.3. SWOT Analysis
- 17.2.4.4. Recent Developments
- 17.2.4.5. Financials (Based on Availability)
- 17.2.5 Cooling Tower Depot Inc
- 17.2.5.1. Overview
- 17.2.5.2. Products
- 17.2.5.3. SWOT Analysis
- 17.2.5.4. Recent Developments
- 17.2.5.5. Financials (Based on Availability)
- 17.2.6 Caterpillar Inc
- 17.2.6.1. Overview
- 17.2.6.2. Products
- 17.2.6.3. SWOT Analysis
- 17.2.6.4. Recent Developments
- 17.2.6.5. Financials (Based on Availability)
- 17.2.7 Aggreko PLC
- 17.2.7.1. Overview
- 17.2.7.2. Products
- 17.2.7.3. SWOT Analysis
- 17.2.7.4. Recent Developments
- 17.2.7.5. Financials (Based on Availability)
- 17.2.8 Baltimore Aircoil Co
- 17.2.8.1. Overview
- 17.2.8.2. Products
- 17.2.8.3. SWOT Analysis
- 17.2.8.4. Recent Developments
- 17.2.8.5. Financials (Based on Availability)
- 17.2.9 Carrier Rental Systems Inc
- 17.2.9.1. Overview
- 17.2.9.2. Products
- 17.2.9.3. SWOT Analysis
- 17.2.9.4. Recent Developments
- 17.2.9.5. Financials (Based on Availability)
- 17.2.10 United Rentals Inc
- 17.2.10.1. Overview
- 17.2.10.2. Products
- 17.2.10.3. SWOT Analysis
- 17.2.10.4. Recent Developments
- 17.2.10.5. Financials (Based on Availability)
- 17.2.1 SPX Cooling Technologies Inc
List of Figures
- Figure 1: Global Cooling Tower Rental Industry Revenue Breakdown (Million, %) by Region 2024 & 2032
- Figure 2: North America Cooling Tower Rental Industry Revenue (Million), by Country 2024 & 2032
- Figure 3: North America Cooling Tower Rental Industry Revenue Share (%), by Country 2024 & 2032
- Figure 4: Europe Cooling Tower Rental Industry Revenue (Million), by Country 2024 & 2032
- Figure 5: Europe Cooling Tower Rental Industry Revenue Share (%), by Country 2024 & 2032
- Figure 6: Asia Pacific Cooling Tower Rental Industry Revenue (Million), by Country 2024 & 2032
- Figure 7: Asia Pacific Cooling Tower Rental Industry Revenue Share (%), by Country 2024 & 2032
- Figure 8: South America Cooling Tower Rental Industry Revenue (Million), by Country 2024 & 2032
- Figure 9: South America Cooling Tower Rental Industry Revenue Share (%), by Country 2024 & 2032
- Figure 10: North America Cooling Tower Rental Industry Revenue (Million), by Country 2024 & 2032
- Figure 11: North America Cooling Tower Rental Industry Revenue Share (%), by Country 2024 & 2032
- Figure 12: MEA Cooling Tower Rental Industry Revenue (Million), by Country 2024 & 2032
- Figure 13: MEA Cooling Tower Rental Industry Revenue Share (%), by Country 2024 & 2032
- Figure 14: North America Cooling Tower Rental Industry Revenue (Million), by Type 2024 & 2032
- Figure 15: North America Cooling Tower Rental Industry Revenue Share (%), by Type 2024 & 2032
- Figure 16: North America Cooling Tower Rental Industry Revenue (Million), by End User 2024 & 2032
- Figure 17: North America Cooling Tower Rental Industry Revenue Share (%), by End User 2024 & 2032
- Figure 18: North America Cooling Tower Rental Industry Revenue (Million), by Country 2024 & 2032
- Figure 19: North America Cooling Tower Rental Industry Revenue Share (%), by Country 2024 & 2032
- Figure 20: Europe Cooling Tower Rental Industry Revenue (Million), by Type 2024 & 2032
- Figure 21: Europe Cooling Tower Rental Industry Revenue Share (%), by Type 2024 & 2032
- Figure 22: Europe Cooling Tower Rental Industry Revenue (Million), by End User 2024 & 2032
- Figure 23: Europe Cooling Tower Rental Industry Revenue Share (%), by End User 2024 & 2032
- Figure 24: Europe Cooling Tower Rental Industry Revenue (Million), by Country 2024 & 2032
- Figure 25: Europe Cooling Tower Rental Industry Revenue Share (%), by Country 2024 & 2032
- Figure 26: Asia Pacific Cooling Tower Rental Industry Revenue (Million), by Type 2024 & 2032
- Figure 27: Asia Pacific Cooling Tower Rental Industry Revenue Share (%), by Type 2024 & 2032
- Figure 28: Asia Pacific Cooling Tower Rental Industry Revenue (Million), by End User 2024 & 2032
- Figure 29: Asia Pacific Cooling Tower Rental Industry Revenue Share (%), by End User 2024 & 2032
- Figure 30: Asia Pacific Cooling Tower Rental Industry Revenue (Million), by Country 2024 & 2032
- Figure 31: Asia Pacific Cooling Tower Rental Industry Revenue Share (%), by Country 2024 & 2032
- Figure 32: Middle East and Africa Cooling Tower Rental Industry Revenue (Million), by Type 2024 & 2032
- Figure 33: Middle East and Africa Cooling Tower Rental Industry Revenue Share (%), by Type 2024 & 2032
- Figure 34: Middle East and Africa Cooling Tower Rental Industry Revenue (Million), by End User 2024 & 2032
- Figure 35: Middle East and Africa Cooling Tower Rental Industry Revenue Share (%), by End User 2024 & 2032
- Figure 36: Middle East and Africa Cooling Tower Rental Industry Revenue (Million), by Country 2024 & 2032
- Figure 37: Middle East and Africa Cooling Tower Rental Industry Revenue Share (%), by Country 2024 & 2032
- Figure 38: South America Cooling Tower Rental Industry Revenue (Million), by Type 2024 & 2032
- Figure 39: South America Cooling Tower Rental Industry Revenue Share (%), by Type 2024 & 2032
- Figure 40: South America Cooling Tower Rental Industry Revenue (Million), by End User 2024 & 2032
- Figure 41: South America Cooling Tower Rental Industry Revenue Share (%), by End User 2024 & 2032
- Figure 42: South America Cooling Tower Rental Industry Revenue (Million), by Country 2024 & 2032
- Figure 43: South America Cooling Tower Rental Industry Revenue Share (%), by Country 2024 & 2032
List of Tables
- Table 1: Global Cooling Tower Rental Industry Revenue Million Forecast, by Region 2019 & 2032
- Table 2: Global Cooling Tower Rental Industry Revenue Million Forecast, by Type 2019 & 2032
- Table 3: Global Cooling Tower Rental Industry Revenue Million Forecast, by End User 2019 & 2032
- Table 4: Global Cooling Tower Rental Industry Revenue Million Forecast, by Region 2019 & 2032
- Table 5: Global Cooling Tower Rental Industry Revenue Million Forecast, by Country 2019 & 2032
- Table 6: United States Cooling Tower Rental Industry Revenue (Million) Forecast, by Application 2019 & 2032
- Table 7: Canada Cooling Tower Rental Industry Revenue (Million) Forecast, by Application 2019 & 2032
- Table 8: Mexico Cooling Tower Rental Industry Revenue (Million) Forecast, by Application 2019 & 2032
- Table 9: Global Cooling Tower Rental Industry Revenue Million Forecast, by Country 2019 & 2032
- Table 10: Germany Cooling Tower Rental Industry Revenue (Million) Forecast, by Application 2019 & 2032
- Table 11: United Kingdom Cooling Tower Rental Industry Revenue (Million) Forecast, by Application 2019 & 2032
- Table 12: France Cooling Tower Rental Industry Revenue (Million) Forecast, by Application 2019 & 2032
- Table 13: Spain Cooling Tower Rental Industry Revenue (Million) Forecast, by Application 2019 & 2032
- Table 14: Italy Cooling Tower Rental Industry Revenue (Million) Forecast, by Application 2019 & 2032
- Table 15: Spain Cooling Tower Rental Industry Revenue (Million) Forecast, by Application 2019 & 2032
- Table 16: Belgium Cooling Tower Rental Industry Revenue (Million) Forecast, by Application 2019 & 2032
- Table 17: Netherland Cooling Tower Rental Industry Revenue (Million) Forecast, by Application 2019 & 2032
- Table 18: Nordics Cooling Tower Rental Industry Revenue (Million) Forecast, by Application 2019 & 2032
- Table 19: Rest of Europe Cooling Tower Rental Industry Revenue (Million) Forecast, by Application 2019 & 2032
- Table 20: Global Cooling Tower Rental Industry Revenue Million Forecast, by Country 2019 & 2032
- Table 21: China Cooling Tower Rental Industry Revenue (Million) Forecast, by Application 2019 & 2032
- Table 22: Japan Cooling Tower Rental Industry Revenue (Million) Forecast, by Application 2019 & 2032
- Table 23: India Cooling Tower Rental Industry Revenue (Million) Forecast, by Application 2019 & 2032
- Table 24: South Korea Cooling Tower Rental Industry Revenue (Million) Forecast, by Application 2019 & 2032
- Table 25: Southeast Asia Cooling Tower Rental Industry Revenue (Million) Forecast, by Application 2019 & 2032
- Table 26: Australia Cooling Tower Rental Industry Revenue (Million) Forecast, by Application 2019 & 2032
- Table 27: Indonesia Cooling Tower Rental Industry Revenue (Million) Forecast, by Application 2019 & 2032
- Table 28: Phillipes Cooling Tower Rental Industry Revenue (Million) Forecast, by Application 2019 & 2032
- Table 29: Singapore Cooling Tower Rental Industry Revenue (Million) Forecast, by Application 2019 & 2032
- Table 30: Thailandc Cooling Tower Rental Industry Revenue (Million) Forecast, by Application 2019 & 2032
- Table 31: Rest of Asia Pacific Cooling Tower Rental Industry Revenue (Million) Forecast, by Application 2019 & 2032
- Table 32: Global Cooling Tower Rental Industry Revenue Million Forecast, by Country 2019 & 2032
- Table 33: Brazil Cooling Tower Rental Industry Revenue (Million) Forecast, by Application 2019 & 2032
- Table 34: Argentina Cooling Tower Rental Industry Revenue (Million) Forecast, by Application 2019 & 2032
- Table 35: Peru Cooling Tower Rental Industry Revenue (Million) Forecast, by Application 2019 & 2032
- Table 36: Chile Cooling Tower Rental Industry Revenue (Million) Forecast, by Application 2019 & 2032
- Table 37: Colombia Cooling Tower Rental Industry Revenue (Million) Forecast, by Application 2019 & 2032
- Table 38: Ecuador Cooling Tower Rental Industry Revenue (Million) Forecast, by Application 2019 & 2032
- Table 39: Venezuela Cooling Tower Rental Industry Revenue (Million) Forecast, by Application 2019 & 2032
- Table 40: Rest of South America Cooling Tower Rental Industry Revenue (Million) Forecast, by Application 2019 & 2032
- Table 41: Global Cooling Tower Rental Industry Revenue Million Forecast, by Country 2019 & 2032
- Table 42: United States Cooling Tower Rental Industry Revenue (Million) Forecast, by Application 2019 & 2032
- Table 43: Canada Cooling Tower Rental Industry Revenue (Million) Forecast, by Application 2019 & 2032
- Table 44: Mexico Cooling Tower Rental Industry Revenue (Million) Forecast, by Application 2019 & 2032
- Table 45: Global Cooling Tower Rental Industry Revenue Million Forecast, by Country 2019 & 2032
- Table 46: United Arab Emirates Cooling Tower Rental Industry Revenue (Million) Forecast, by Application 2019 & 2032
- Table 47: Saudi Arabia Cooling Tower Rental Industry Revenue (Million) Forecast, by Application 2019 & 2032
- Table 48: South Africa Cooling Tower Rental Industry Revenue (Million) Forecast, by Application 2019 & 2032
- Table 49: Rest of Middle East and Africa Cooling Tower Rental Industry Revenue (Million) Forecast, by Application 2019 & 2032
- Table 50: Global Cooling Tower Rental Industry Revenue Million Forecast, by Type 2019 & 2032
- Table 51: Global Cooling Tower Rental Industry Revenue Million Forecast, by End User 2019 & 2032
- Table 52: Global Cooling Tower Rental Industry Revenue Million Forecast, by Country 2019 & 2032
- Table 53: Global Cooling Tower Rental Industry Revenue Million Forecast, by Type 2019 & 2032
- Table 54: Global Cooling Tower Rental Industry Revenue Million Forecast, by End User 2019 & 2032
- Table 55: Global Cooling Tower Rental Industry Revenue Million Forecast, by Country 2019 & 2032
- Table 56: Global Cooling Tower Rental Industry Revenue Million Forecast, by Type 2019 & 2032
- Table 57: Global Cooling Tower Rental Industry Revenue Million Forecast, by End User 2019 & 2032
- Table 58: Global Cooling Tower Rental Industry Revenue Million Forecast, by Country 2019 & 2032
- Table 59: Global Cooling Tower Rental Industry Revenue Million Forecast, by Type 2019 & 2032
- Table 60: Global Cooling Tower Rental Industry Revenue Million Forecast, by End User 2019 & 2032
- Table 61: Global Cooling Tower Rental Industry Revenue Million Forecast, by Country 2019 & 2032
- Table 62: Global Cooling Tower Rental Industry Revenue Million Forecast, by Type 2019 & 2032
- Table 63: Global Cooling Tower Rental Industry Revenue Million Forecast, by End User 2019 & 2032
- Table 64: Global Cooling Tower Rental Industry Revenue Million Forecast, by Country 2019 & 2032
Frequently Asked Questions
1. What is the projected Compound Annual Growth Rate (CAGR) of the Cooling Tower Rental Industry?
The projected CAGR is approximately > 4.90%.
2. Which companies are prominent players in the Cooling Tower Rental Industry?
Key companies in the market include SPX Cooling Technologies Inc, Johnson Controls International PLC, KTK KUHLTURM KARLSRUHE GMBH*List Not Exhaustive, Midwest Cooling Tower Services LLC, Cooling Tower Depot Inc, Caterpillar Inc, Aggreko PLC, Baltimore Aircoil Co, Carrier Rental Systems Inc, United Rentals Inc.
3. What are the main segments of the Cooling Tower Rental Industry?
The market segments include Type, End User.
4. Can you provide details about the market size?
The market size is estimated to be USD XX Million as of 2022.
5. What are some drivers contributing to market growth?
4.; Favorable Government Policies.
6. What are the notable trends driving market growth?
Industrial Segment to Dominate the Market.
7. Are there any restraints impacting market growth?
4.; Rising Emphasis on Other Alternative Clean Energy Sources.
8. Can you provide examples of recent developments in the market?
Restrictions and impacts related to COVID-19 significantly reduced activities like air travel and commuting. This reduced the demand for fuels for transportation, and the shutdown restrictions on refineries affected the downstream sector in 2020. Since cooling towers play a major role in refinery operations, the shutdowns and reduced production rates affected the market for cooling tower rental.
9. What pricing options are available for accessing the report?
Pricing options include single-user, multi-user, and enterprise licenses priced at USD 4750, USD 5250, and USD 8750 respectively.
10. Is the market size provided in terms of value or volume?
The market size is provided in terms of value, measured in Million.
11. Are there any specific market keywords associated with the report?
Yes, the market keyword associated with the report is "Cooling Tower Rental Industry," which aids in identifying and referencing the specific market segment covered.
12. How do I determine which pricing option suits my needs best?
The pricing options vary based on user requirements and access needs. Individual users may opt for single-user licenses, while businesses requiring broader access may choose multi-user or enterprise licenses for cost-effective access to the report.
13. Are there any additional resources or data provided in the Cooling Tower Rental Industry report?
While the report offers comprehensive insights, it's advisable to review the specific contents or supplementary materials provided to ascertain if additional resources or data are available.
14. How can I stay updated on further developments or reports in the Cooling Tower Rental Industry?
To stay informed about further developments, trends, and reports in the Cooling Tower Rental Industry, consider subscribing to industry newsletters, following relevant companies and organizations, or regularly checking reputable industry news sources and publications.
Methodology
Step 1 - Identification of Relevant Samples Size from Population Database


Step 2 - Approaches for Defining Global Market Size (Value, Volume* & Price*)

Note*: In applicable scenarios
Step 3 - Data Sources
Primary Research
- Web Analytics
- Survey Reports
- Research Institute
- Latest Research Reports
- Opinion Leaders
Secondary Research
- Annual Reports
- White Paper
- Latest Press Release
- Industry Association
- Paid Database
- Investor Presentations

Step 4 - Data Triangulation
Involves using different sources of information in order to increase the validity of a study
These sources are likely to be stakeholders in a program - participants, other researchers, program staff, other community members, and so on.
Then we put all data in single framework & apply various statistical tools to find out the dynamic on the market.
During the analysis stage, feedback from the stakeholder groups would be compared to determine areas of agreement as well as areas of divergence
