

Key Insights
The European Power-to-Gas (PtG) market is projected for significant expansion, driven by the imperative for renewable energy integration and industrial decarbonization. With an anticipated Compound Annual Growth Rate (CAGR) of 11.35%, the market is expected to reach a valuation of $46.76 billion by 2025. This growth trajectory is propelled by the escalating deployment of renewable energy sources, stringent environmental mandates targeting carbon emission reduction, and the rising demand for sustainable energy solutions across industrial and transportation sectors. The market encompasses advancements in Power-to-Hydrogen and Power-to-Methane technologies, including various electrolysis methods. Segmentation spans capacity (by kW ranges), end-user industries (utilities, industrial, commercial), and key geographical markets, with Germany, the UK, France, and Spain at the forefront. Key market trends include technological innovations focused on enhancing electrolysis efficiency and reducing costs.
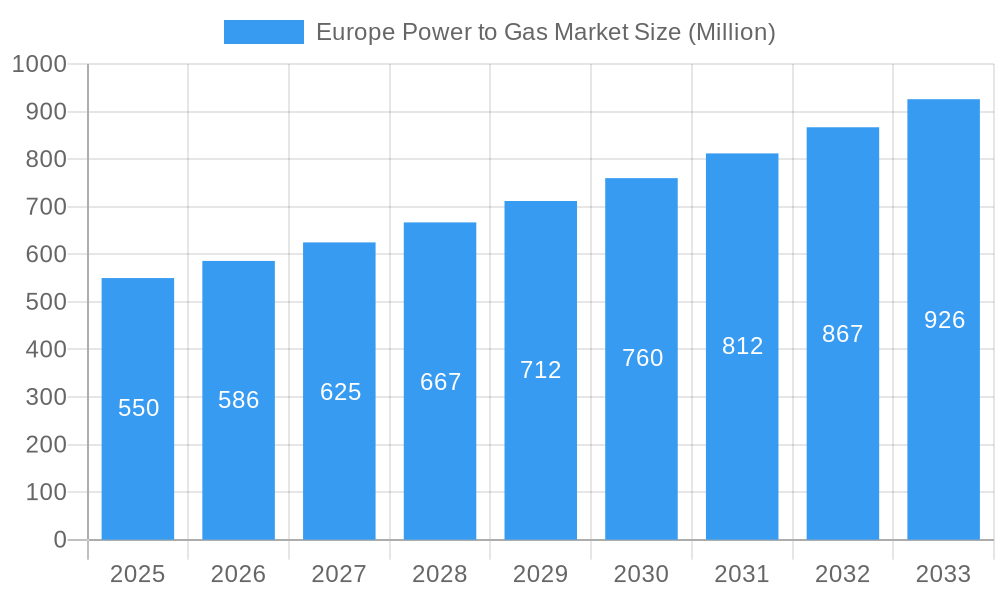
Europe Power to Gas Market Market Size (In Billion)
However, significant challenges persist, including substantial upfront capital requirements for PtG infrastructure, the necessity for advanced energy storage solutions, and the development of efficient distribution networks for hydrogen and methane. The competitive environment features established energy conglomerates such as Siemens Energy AG and Sempra Energy, alongside specialized PtG technology developers like Ineratec GmbH and Electrochaea GmbH. The forecast period (2025-2033) indicates sustained market growth, supported by governmental incentive programs, increasing carbon pricing, and a heightened focus on energy security and sustainability. Strategic market entry necessitates addressing technical and economic impediments while leveraging the substantial potential of PtG technology to support Europe's clean energy transition. Detailed analysis of country-specific policies, grid infrastructure evolution, and regulatory frameworks is vital for precise market forecasting.
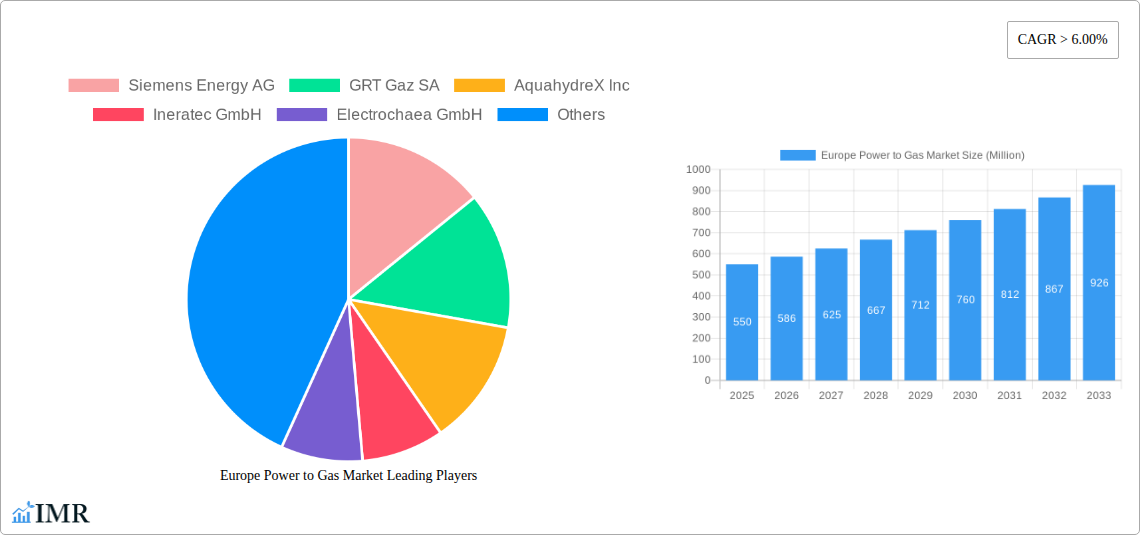
Europe Power to Gas Market Company Market Share
Europe Power to Gas Market: A Comprehensive Market Analysis (2019-2033)
This comprehensive report provides an in-depth analysis of the Europe Power to Gas market, encompassing market dynamics, growth trends, regional performance, product landscape, challenges, opportunities, and key players. With a study period spanning 2019-2033, a base year of 2025, and a forecast period of 2025-2033, this report offers invaluable insights for industry professionals, investors, and strategic decision-makers. The report segments the market by technology (Power-to-Hydrogen – including Alkaline Water Electrolysis, PEM, SOEC; Power-to-Methane – including Chemical and Biological), capacity (More than 1000 KW, 100 to 1000 KW, Less than 100 KW), end-user (Utilities, Industrial, Commercial), and location (United Kingdom, Germany, France, Spain, Others).
Europe Power to Gas Market Dynamics & Structure
The European Power to Gas market is experiencing significant growth driven by the increasing need for renewable energy integration and decarbonization efforts. Market concentration is moderate, with a few large players and numerous smaller, specialized companies. Technological innovation, particularly in electrolysis and methanation technologies, is a key driver, spurring efficiency improvements and cost reductions. Stringent environmental regulations across Europe are pushing the adoption of power-to-gas technologies. Competitive substitutes include conventional natural gas and other energy storage solutions, but power-to-gas offers unique advantages in terms of renewability and grid flexibility. The end-user segment is diverse, with utilities, industrial sectors (e.g., chemical production), and commercial applications showing strong growth potential. M&A activity within the sector is relatively frequent, reflecting consolidation efforts and technological acquisition strategies.
- Market Concentration: Moderate (xx%)
- M&A Deal Volume (2019-2024): xx deals
- Innovation Barriers: High initial investment costs, technological maturity of specific processes, and grid integration challenges.
Europe Power to Gas Market Growth Trends & Insights
The European Power to Gas market is projected to experience robust growth throughout the forecast period (2025-2033). Driven by supportive government policies, increasing renewable energy generation, and rising demand for energy storage solutions, the market size is expected to reach xx Million by 2033, exhibiting a CAGR of xx% from 2025 to 2033. Early adoption has been largely concentrated in Germany and the United Kingdom, but other countries are quickly catching up. Technological advancements, such as increased efficiency in electrolysis and improved methanation processes, are accelerating market penetration. Shifting consumer preferences towards sustainable energy sources and corporate sustainability goals are further reinforcing market growth.
Dominant Regions, Countries, or Segments in Europe Power to Gas Market
Germany and the United Kingdom are currently leading the European Power to Gas market due to supportive government policies, well-established renewable energy infrastructure, and robust research and development activities. However, France and Spain are rapidly emerging as significant markets, fuelled by increasing renewable energy capacity and ambitious decarbonization targets. The Power-to-Hydrogen segment currently holds the largest market share, driven by its established technological maturity and versatility of applications. Within the capacity segment, the “100 to 1000 KW” range is currently the most dominant, reflecting the balance between project economics and scalability. The industrial end-user segment displays the highest growth potential, owing to the significant energy consumption and decarbonization needs of various industrial processes.
- Key Drivers (Germany & UK): Subsidies, Renewable Energy Integration Targets, R&D Funding.
- Key Drivers (France & Spain): Growing Renewable Energy Capacity, Decarbonization Policies.
- Market Share (2025): Germany (xx%), UK (xx%), France (xx%), Spain (xx%), Others (xx%)
- Growth Potential: Industrial Segment (xx%)
Europe Power to Gas Market Product Landscape
The Power to Gas market features a diverse range of products, including various electrolyzer technologies (Alkaline, PEM, SOEC) for Power-to-Hydrogen and different methanation processes (biological, chemical) for Power-to-Methane. Continuous innovation focuses on improving efficiency, reducing costs, and enhancing scalability. Recent advancements have led to more compact, modular systems, increasing the accessibility and deployment flexibility of Power to Gas technology. Unique selling propositions include enhanced energy storage capabilities, improved grid stability, and the production of synthetic renewable fuels.
Key Drivers, Barriers & Challenges in Europe Power to Gas Market
Key Drivers: The primary drivers include stringent environmental regulations promoting renewable energy adoption, supportive government policies and incentives, growing demand for energy storage solutions, and technological advancements improving efficiency and reducing costs. The EU's Green Deal and national decarbonization strategies are powerful catalysts.
Key Challenges: High capital expenditure for Power to Gas infrastructure, limited access to grid connection and integration complexities, and uncertainties regarding long-term feedstock availability present considerable barriers. Furthermore, competition from other energy storage solutions, including batteries, poses a competitive challenge. Supply chain complexities, particularly regarding the availability of critical materials for electrolyzers, represent an additional obstacle.
Emerging Opportunities in Europe Power to Gas Market
Emerging opportunities include the integration of Power to Gas into large-scale renewable energy projects, expansion into new market segments such as transportation (e.g., hydrogen refueling), and the development of innovative business models, such as Power Purchase Agreements (PPAs) for Power to Gas projects. Untapped markets in Eastern Europe and smaller countries represent significant potential for growth.
Growth Accelerators in the Europe Power to Gas Market Industry
Technological breakthroughs in high-efficiency electrolyzers and methanation technologies are set to significantly accelerate market growth. Strategic partnerships between energy companies, technology providers, and research institutions are fostering innovation and accelerating deployment. Expanding market penetration through government subsidies, tax credits, and other financial incentives will continue to drive adoption rates and market expansion.
Key Players Shaping the Europe Power to Gas Market Market
- Siemens Energy AG
- GRT Gaz SA
- AquahydreX Inc
- Ineratec GmbH
- Electrochaea GmbH
- Sempra Energy
- Nel ASA
Notable Milestones in Europe Power to Gas Market Sector
- March 2022: ERM Dolphyn and Source Energie partner to develop a 200 MW floating wind-to-hydrogen project in the UK (Commissioning: 2027).
- March 2022: Sunfire wins contract to supply electrolysis equipment for Finland's first industrial-scale green hydrogen plant (20 MW capacity, EUR 70 million investment).
In-Depth Europe Power to Gas Market Market Outlook
The future of the European Power to Gas market is bright. Continued technological advancements, supportive policy frameworks, and rising demand for decarbonized energy will drive sustained growth throughout the forecast period. Strategic investments in research and development, along with the expansion of grid infrastructure to accommodate increased renewable energy and hydrogen transport, will be crucial for realizing the full potential of this market. Opportunities abound for companies that can effectively navigate technological challenges and leverage the increasing demand for sustainable energy solutions.
Europe Power to Gas Market Segmentation
-
1. Technology
- 1.1. Power-to
- 1.2. Power-to-Methane (incl. Chemical and Biological)
-
2. Capacity
- 2.1. More than 1000 KW
- 2.2. 100 to 1000 KW
- 2.3. Less than 100 KW
-
3. End-User
- 3.1. Utilities
- 3.2. Industrial
- 3.3. Commercial
-
4. Location
- 4.1. United Kingdom
- 4.2. Germany
- 4.3. France
- 4.4. Spain
- 4.5. Others
Europe Power to Gas Market Segmentation By Geography
-
1. Europe
- 1.1. United Kingdom
- 1.2. Germany
- 1.3. France
- 1.4. Italy
- 1.5. Spain
- 1.6. Netherlands
- 1.7. Belgium
- 1.8. Sweden
- 1.9. Norway
- 1.10. Poland
- 1.11. Denmark
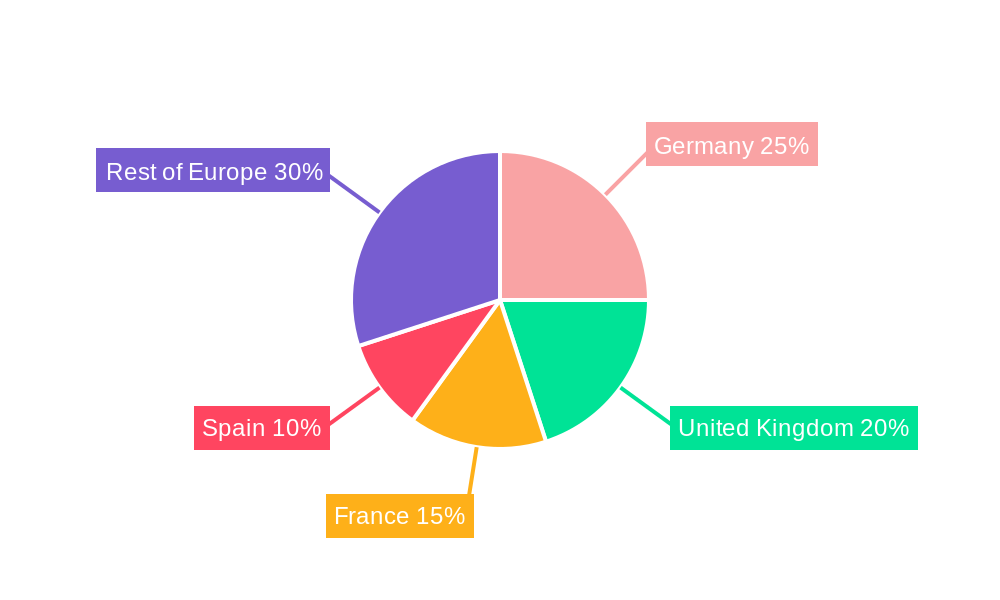
Europe Power to Gas Market Regional Market Share
Geographic Coverage of Europe Power to Gas Market
Europe Power to Gas Market REPORT HIGHLIGHTS
| Aspects | Details |
|---|---|
| Study Period | 2020-2034 |
| Base Year | 2025 |
| Estimated Year | 2026 |
| Forecast Period | 2026-2034 |
| Historical Period | 2020-2025 |
| Growth Rate | CAGR of 11.35% from 2020-2034 |
| Segmentation |
|
Table of Contents
- 1. Introduction
- 1.1. Research Scope
- 1.2. Market Segmentation
- 1.3. Research Objective
- 1.4. Definitions and Assumptions
- 2. Executive Summary
- 2.1. Market Snapshot
- 3. Market Dynamics
- 3.1. Market Drivers
- 3.2. Market Restrains
- 3.3. Market Trends
- 3.4. Market Opportunities
- 4. Market Factor Analysis
- 4.1. Porters Five Forces
- 4.1.1. Bargaining Power of Suppliers
- 4.1.2. Bargaining Power of Buyers
- 4.1.3. Threat of New Entrants
- 4.1.4. Threat of Substitutes
- 4.1.5. Competitive Rivalry
- 4.2. PESTEL analysis
- 4.3. BCG Analysis
- 4.3.1. Stars (High Growth, High Market Share)
- 4.3.2. Cash Cows (Low Growth, High Market Share)
- 4.3.3. Question Mark (High Growth, Low Market Share)
- 4.3.4. Dogs (Low Growth, Low Market Share)
- 4.4. Ansoff Matrix Analysis
- 4.5. Supply Chain Analysis
- 4.6. Regulatory Landscape
- 4.7. Current Market Potential and Opportunity Assessment (TAM–SAM–SOM Framework)
- 4.8. IMR Analyst Note
- 4.1. Porters Five Forces
- 5. Market Analysis, Insights and Forecast 2021-2033
- 5.1. Market Analysis, Insights and Forecast - by Technology
- 5.1.1. Power-to
- 5.1.2. Power-to-Methane (incl. Chemical and Biological)
- 5.2. Market Analysis, Insights and Forecast - by Capacity
- 5.2.1. More than 1000 KW
- 5.2.2. 100 to 1000 KW
- 5.2.3. Less than 100 KW
- 5.3. Market Analysis, Insights and Forecast - by End-User
- 5.3.1. Utilities
- 5.3.2. Industrial
- 5.3.3. Commercial
- 5.4. Market Analysis, Insights and Forecast - by Location
- 5.4.1. United Kingdom
- 5.4.2. Germany
- 5.4.3. France
- 5.4.4. Spain
- 5.4.5. Others
- 5.5. Market Analysis, Insights and Forecast - by Region
- 5.5.1. Europe
- 5.1. Market Analysis, Insights and Forecast - by Technology
- 6. Europe Power to Gas Market Analysis, Insights and Forecast, 2021-2033
- 6.1. Market Analysis, Insights and Forecast - by Technology
- 6.1.1. Power-to
- 6.1.2. Power-to-Methane (incl. Chemical and Biological)
- 6.2. Market Analysis, Insights and Forecast - by Capacity
- 6.2.1. More than 1000 KW
- 6.2.2. 100 to 1000 KW
- 6.2.3. Less than 100 KW
- 6.3. Market Analysis, Insights and Forecast - by End-User
- 6.3.1. Utilities
- 6.3.2. Industrial
- 6.3.3. Commercial
- 6.4. Market Analysis, Insights and Forecast - by Location
- 6.4.1. United Kingdom
- 6.4.2. Germany
- 6.4.3. France
- 6.4.4. Spain
- 6.4.5. Others
- 6.1. Market Analysis, Insights and Forecast - by Technology
- 7. Competitive Analysis
- 7.1. Company Profiles
- 7.1.1 Siemens Energy AG
- 7.1.1.1. Company Overview
- 7.1.1.2. Products
- 7.1.1.3. Company Financials
- 7.1.1.4. SWOT Analysis
- 7.1.2 GRT Gaz SA
- 7.1.2.1. Company Overview
- 7.1.2.2. Products
- 7.1.2.3. Company Financials
- 7.1.2.4. SWOT Analysis
- 7.1.3 AquahydreX Inc
- 7.1.3.1. Company Overview
- 7.1.3.2. Products
- 7.1.3.3. Company Financials
- 7.1.3.4. SWOT Analysis
- 7.1.4 Ineratec GmbH
- 7.1.4.1. Company Overview
- 7.1.4.2. Products
- 7.1.4.3. Company Financials
- 7.1.4.4. SWOT Analysis
- 7.1.5 Electrochaea GmbH
- 7.1.5.1. Company Overview
- 7.1.5.2. Products
- 7.1.5.3. Company Financials
- 7.1.5.4. SWOT Analysis
- 7.1.6 Sempra Energy
- 7.1.6.1. Company Overview
- 7.1.6.2. Products
- 7.1.6.3. Company Financials
- 7.1.6.4. SWOT Analysis
- 7.1.7 Nel ASA
- 7.1.7.1. Company Overview
- 7.1.7.2. Products
- 7.1.7.3. Company Financials
- 7.1.7.4. SWOT Analysis
- 7.1.1 Siemens Energy AG
- 7.2. Market Entropy
- 7.2.1 Company's Key Areas Served
- 7.2.2 Recent Developments
- 7.3. Company Market Share Analysis 2025
- 7.3.1 Top 5 Companies Market Share Analysis
- 7.3.2 Top 3 Companies Market Share Analysis
- 7.4. List of Potential Customers
- 8. Research Methodology
List of Figures
- Figure 1: Europe Power to Gas Market Revenue Breakdown (billion, %) by Product 2025 & 2033
- Figure 2: Europe Power to Gas Market Share (%) by Company 2025
List of Tables
- Table 1: Europe Power to Gas Market Revenue billion Forecast, by Technology 2020 & 2033
- Table 2: Europe Power to Gas Market Volume Gigawatt Forecast, by Technology 2020 & 2033
- Table 3: Europe Power to Gas Market Revenue billion Forecast, by Capacity 2020 & 2033
- Table 4: Europe Power to Gas Market Volume Gigawatt Forecast, by Capacity 2020 & 2033
- Table 5: Europe Power to Gas Market Revenue billion Forecast, by End-User 2020 & 2033
- Table 6: Europe Power to Gas Market Volume Gigawatt Forecast, by End-User 2020 & 2033
- Table 7: Europe Power to Gas Market Revenue billion Forecast, by Location 2020 & 2033
- Table 8: Europe Power to Gas Market Volume Gigawatt Forecast, by Location 2020 & 2033
- Table 9: Europe Power to Gas Market Revenue billion Forecast, by Region 2020 & 2033
- Table 10: Europe Power to Gas Market Volume Gigawatt Forecast, by Region 2020 & 2033
- Table 11: Europe Power to Gas Market Revenue billion Forecast, by Technology 2020 & 2033
- Table 12: Europe Power to Gas Market Volume Gigawatt Forecast, by Technology 2020 & 2033
- Table 13: Europe Power to Gas Market Revenue billion Forecast, by Capacity 2020 & 2033
- Table 14: Europe Power to Gas Market Volume Gigawatt Forecast, by Capacity 2020 & 2033
- Table 15: Europe Power to Gas Market Revenue billion Forecast, by End-User 2020 & 2033
- Table 16: Europe Power to Gas Market Volume Gigawatt Forecast, by End-User 2020 & 2033
- Table 17: Europe Power to Gas Market Revenue billion Forecast, by Location 2020 & 2033
- Table 18: Europe Power to Gas Market Volume Gigawatt Forecast, by Location 2020 & 2033
- Table 19: Europe Power to Gas Market Revenue billion Forecast, by Country 2020 & 2033
- Table 20: Europe Power to Gas Market Volume Gigawatt Forecast, by Country 2020 & 2033
- Table 21: United Kingdom Europe Power to Gas Market Revenue (billion) Forecast, by Application 2020 & 2033
- Table 22: United Kingdom Europe Power to Gas Market Volume (Gigawatt) Forecast, by Application 2020 & 2033
- Table 23: Germany Europe Power to Gas Market Revenue (billion) Forecast, by Application 2020 & 2033
- Table 24: Germany Europe Power to Gas Market Volume (Gigawatt) Forecast, by Application 2020 & 2033
- Table 25: France Europe Power to Gas Market Revenue (billion) Forecast, by Application 2020 & 2033
- Table 26: France Europe Power to Gas Market Volume (Gigawatt) Forecast, by Application 2020 & 2033
- Table 27: Italy Europe Power to Gas Market Revenue (billion) Forecast, by Application 2020 & 2033
- Table 28: Italy Europe Power to Gas Market Volume (Gigawatt) Forecast, by Application 2020 & 2033
- Table 29: Spain Europe Power to Gas Market Revenue (billion) Forecast, by Application 2020 & 2033
- Table 30: Spain Europe Power to Gas Market Volume (Gigawatt) Forecast, by Application 2020 & 2033
- Table 31: Netherlands Europe Power to Gas Market Revenue (billion) Forecast, by Application 2020 & 2033
- Table 32: Netherlands Europe Power to Gas Market Volume (Gigawatt) Forecast, by Application 2020 & 2033
- Table 33: Belgium Europe Power to Gas Market Revenue (billion) Forecast, by Application 2020 & 2033
- Table 34: Belgium Europe Power to Gas Market Volume (Gigawatt) Forecast, by Application 2020 & 2033
- Table 35: Sweden Europe Power to Gas Market Revenue (billion) Forecast, by Application 2020 & 2033
- Table 36: Sweden Europe Power to Gas Market Volume (Gigawatt) Forecast, by Application 2020 & 2033
- Table 37: Norway Europe Power to Gas Market Revenue (billion) Forecast, by Application 2020 & 2033
- Table 38: Norway Europe Power to Gas Market Volume (Gigawatt) Forecast, by Application 2020 & 2033
- Table 39: Poland Europe Power to Gas Market Revenue (billion) Forecast, by Application 2020 & 2033
- Table 40: Poland Europe Power to Gas Market Volume (Gigawatt) Forecast, by Application 2020 & 2033
- Table 41: Denmark Europe Power to Gas Market Revenue (billion) Forecast, by Application 2020 & 2033
- Table 42: Denmark Europe Power to Gas Market Volume (Gigawatt) Forecast, by Application 2020 & 2033
Frequently Asked Questions
1. What is the projected Compound Annual Growth Rate (CAGR) of the Europe Power to Gas Market?
The projected CAGR is approximately 11.35%.
2. Which companies are prominent players in the Europe Power to Gas Market?
Key companies in the market include Siemens Energy AG, GRT Gaz SA, AquahydreX Inc, Ineratec GmbH, Electrochaea GmbH, Sempra Energy, Nel ASA.
3. What are the main segments of the Europe Power to Gas Market?
The market segments include Technology, Capacity, End-User, Location.
4. Can you provide details about the market size?
The market size is estimated to be USD 46.76 billion as of 2022.
5. What are some drivers contributing to market growth?
4.; Growing Demand to Develop the Natural Gas Infrastructure4.; Increase in Offshore Oil and Gas Exploration and Production (E&P) Activities.
6. What are the notable trends driving market growth?
Germany is going to dominate the market.
7. Are there any restraints impacting market growth?
4.; High Volatility of Oil and Gas Prices.
8. Can you provide examples of recent developments in the market?
In March 2022. Environmental Resources Management's (ERM) ERM Dolphyn and Source Energie have entered into a partnership to develop a 200 floating wind to hydrogen project in the United Kingdom. The project is expected to be commissioned by 2027 and is likely to produce green hydrogen.
9. What pricing options are available for accessing the report?
Pricing options include single-user, multi-user, and enterprise licenses priced at USD 4750, USD 5250, and USD 8750 respectively.
10. Is the market size provided in terms of value or volume?
The market size is provided in terms of value, measured in billion and volume, measured in Gigawatt.
11. Are there any specific market keywords associated with the report?
Yes, the market keyword associated with the report is "Europe Power to Gas Market," which aids in identifying and referencing the specific market segment covered.
12. How do I determine which pricing option suits my needs best?
The pricing options vary based on user requirements and access needs. Individual users may opt for single-user licenses, while businesses requiring broader access may choose multi-user or enterprise licenses for cost-effective access to the report.
13. Are there any additional resources or data provided in the Europe Power to Gas Market report?
While the report offers comprehensive insights, it's advisable to review the specific contents or supplementary materials provided to ascertain if additional resources or data are available.
14. How can I stay updated on further developments or reports in the Europe Power to Gas Market?
To stay informed about further developments, trends, and reports in the Europe Power to Gas Market, consider subscribing to industry newsletters, following relevant companies and organizations, or regularly checking reputable industry news sources and publications.
Methodology
Step 1 - Identification of Relevant Samples Size from Population Database


Step 2 - Approaches for Defining Global Market Size (Value, Volume* & Price*)

Note*: In applicable scenarios
Step 3 - Data Sources
Primary Research
- Web Analytics
- Survey Reports
- Research Institute
- Latest Research Reports
- Opinion Leaders
Secondary Research
- Annual Reports
- White Paper
- Latest Press Release
- Industry Association
- Paid Database
- Investor Presentations

Step 4 - Data Triangulation
Involves using different sources of information in order to increase the validity of a study
These sources are likely to be stakeholders in a program - participants, other researchers, program staff, other community members, and so on.
Then we put all data in single framework & apply various statistical tools to find out the dynamic on the market.
During the analysis stage, feedback from the stakeholder groups would be compared to determine areas of agreement as well as areas of divergence