

Key Insights
The Liquefied Petroleum Gas (LPG) market is poised for significant expansion, projected to achieve a Compound Annual Growth Rate (CAGR) of 3.9%. This growth trajectory is underpinned by increasing urbanization and escalating energy requirements in developing economies, particularly within the Asia-Pacific and Middle East & Africa regions. The growing adoption of LPG for residential cooking and heating, especially in areas lacking natural gas infrastructure, is a primary demand driver. Commercial and industrial sectors are also increasingly integrating LPG into their operations, contributing to market volume. While the automotive sector continues to utilize LPG, it faces competition from emerging electric vehicle technologies. The global LPG market size was valued at 123.14 billion in the base year 2024. Key market restraints include price volatility linked to crude oil and environmental considerations surrounding greenhouse gas emissions, necessitating a focus on sustainable sourcing and cleaner utilization technologies.
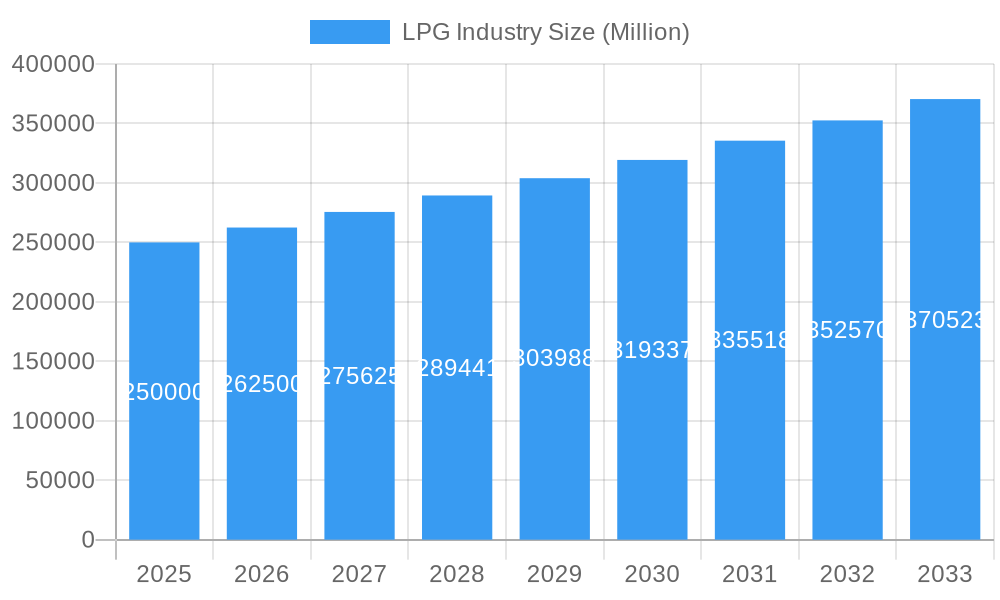
LPG Industry Market Size (In Billion)
The LPG industry's segmentation by production source (crude oil and natural gas liquids) and application presents opportunities for strategic market penetration. Leading entities such as ExxonMobil, Novatek, and Sinopec are actively influencing market dynamics through strategic investments and technological advancements. Geographically, North America, Europe, and Asia-Pacific are identified as key growth drivers. The future of the LPG market depends on effectively addressing environmental concerns, diversifying supply chains, and adapting to evolving energy landscapes. Innovations in LPG storage and transportation are crucial for enhancing efficiency and reducing costs. Government policies promoting LPG infrastructure and its adoption as a cleaner alternative to conventional fuels will significantly shape the market's future. Despite the global shift towards renewable energy sources, sustained demand from developing economies and industrial applications will support robust growth in the forecast period, indicating a positive outlook for the LPG market. Continued research into specific market segments, including emerging market potential and technological advancements, will further illuminate this dynamic industry.
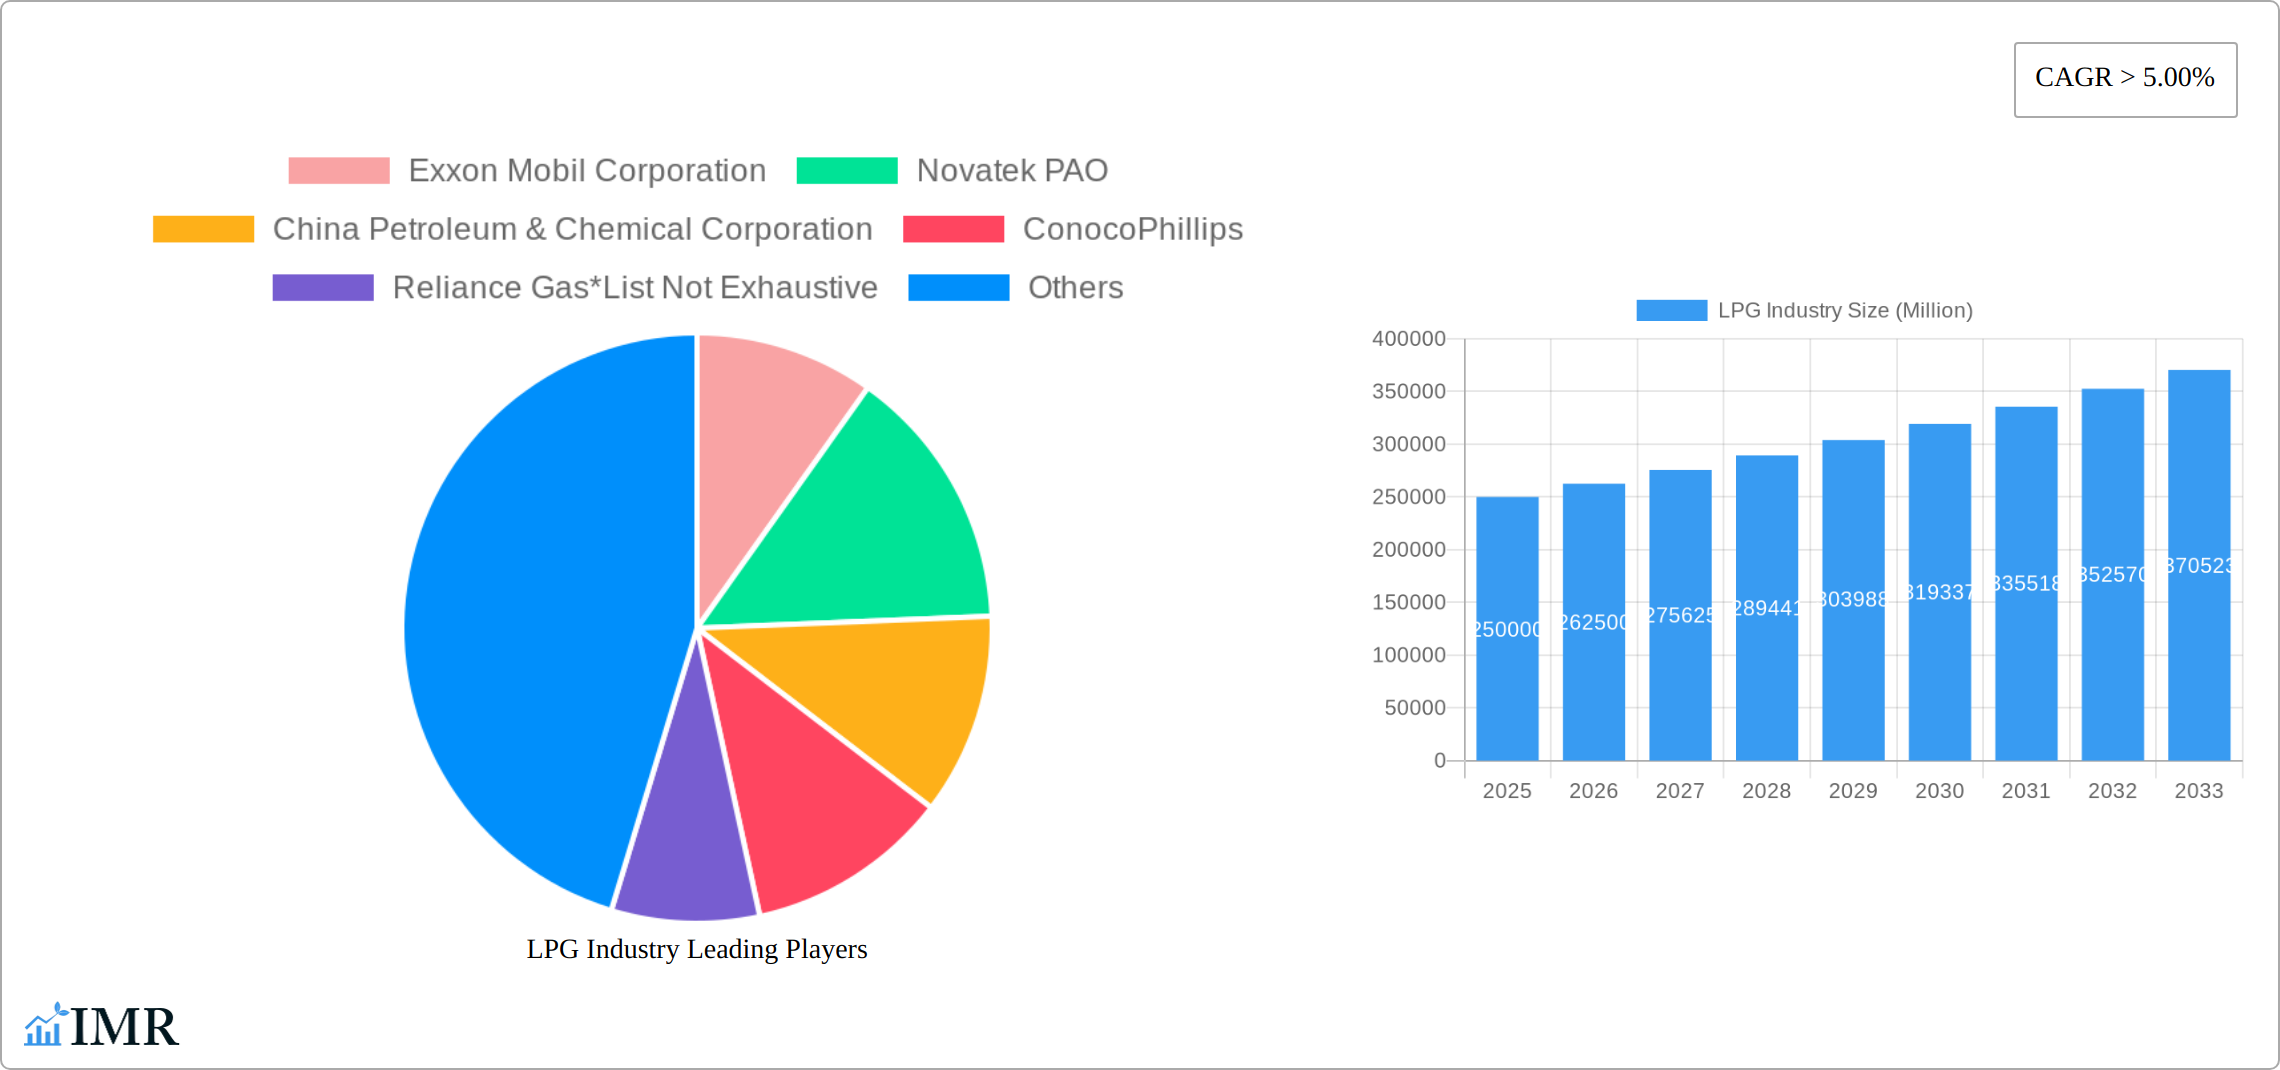
LPG Industry Company Market Share
LPG Industry Market Report: 2019-2033
This comprehensive report provides a detailed analysis of the Liquefied Petroleum Gas (LPG) industry, encompassing market dynamics, growth trends, regional dominance, key players, and future outlook. The study period covers 2019-2033, with a base year of 2025 and a forecast period of 2025-2033. The report leverages extensive primary and secondary research to deliver actionable insights for industry professionals, investors, and stakeholders. We analyze both parent (energy sector) and child (LPG) markets to provide a holistic understanding.
LPG Industry Market Dynamics & Structure
The global LPG market, valued at xx million units in 2024, is characterized by moderate concentration, with a few major players holding significant market share. Exxon Mobil Corporation, Novatek PAO, China Petroleum & Chemical Corporation, and others dominate production and distribution. Technological innovation, particularly in LPG storage and transportation, plays a crucial role, alongside regulatory frameworks governing safety and emissions. The market faces competition from alternative fuels like natural gas and electricity, especially in the residential and commercial sectors. End-user demographics, particularly in developing economies with rising energy demand, are key drivers. M&A activity, though not rampant, shapes the industry landscape, with xx major deals recorded between 2019 and 2024.
- Market Concentration: Moderately concentrated, with top 5 players holding xx% market share in 2024.
- Technological Innovation: Focus on efficient storage, transportation, and cleaner combustion technologies.
- Regulatory Framework: Stringent safety and environmental regulations influence market dynamics.
- Competitive Substitutes: Natural gas, electricity, and biofuels present competitive challenges.
- End-User Demographics: Rising energy demand in developing economies fuels market growth.
- M&A Trends: xx major mergers and acquisitions recorded between 2019 and 2024, with an average deal value of xx million units.
LPG Industry Growth Trends & Insights
The global LPG market exhibited a CAGR of xx% during the historical period (2019-2024), driven by increasing demand from residential, commercial, and industrial sectors, coupled with growth in autofuel applications. Technological advancements, particularly in LPG autogas vehicles, contributed significantly. However, fluctuating crude oil prices and concerns about greenhouse gas emissions impacted growth. Consumer behavior shifts towards cleaner energy sources present both challenges and opportunities. The forecast period (2025-2033) projects a CAGR of xx%, with significant growth expected in emerging markets, propelled by infrastructure development and rising disposable incomes. Market penetration in underdeveloped regions is a key factor in growth potential.
Dominant Regions, Countries, or Segments in LPG Industry
The Asia-Pacific region dominates the LPG market, accounting for xx% of global consumption in 2024, followed by the Middle East and Africa. Within this, India and China are leading consumers, driven by robust economic growth and expanding energy needs. In terms of source of production, Natural Gas Liquids (NGL) are gaining prominence. The residential sector is the largest consumer segment, representing xx% of total demand in 2024, followed by the commercial & industrial sector.
- Key Drivers (Asia-Pacific): Rapid urbanization, rising disposable incomes, and increasing industrialization.
- Key Drivers (NGL): Abundant natural gas reserves and cost-effective extraction methods.
- Key Drivers (Residential): Growing household consumption in developing economies.
LPG Industry Product Landscape
The LPG industry encompasses a diverse product portfolio, ranging from various grades of LPG tailored for specific applications (residential, commercial, industrial) to sophisticated storage and dispensing equipment. This includes everything from small, portable cylinders to large-scale storage tanks and automated filling stations. Product innovation is a key driver, focusing on enhancing energy efficiency, bolstering safety features through advanced technologies like leak detection systems and automated shut-off valves, and minimizing environmental impact through reduced emissions and sustainable sourcing of raw materials. The growing adoption of blended LPG fuels, incorporating bio-components derived from renewable sources like used cooking oil or agricultural waste, is gaining significant momentum, propelled by heightened environmental concerns and government incentives aimed at reducing carbon emissions. These bio-LPG blends offer a pathway towards a more sustainable energy future while maintaining the advantages of LPG's clean burning properties.
Key Drivers, Barriers & Challenges in LPG Industry
Key Drivers: The LPG industry's growth is fueled by several key factors. Rising energy demand, particularly in rapidly developing economies across Asia and Africa, presents a significant opportunity. Increasing industrialization and urbanization contribute to heightened demand for reliable and efficient energy sources, with LPG often proving a cost-effective solution. Furthermore, government initiatives promoting LPG adoption as a cleaner alternative to traditional fuels like kerosene or firewood, alongside investments in expanding distribution networks, especially in underserved rural areas, play a vital role in market expansion. The relative affordability of LPG compared to other fuels, especially in regions with volatile electricity prices, contributes to its widespread appeal.
Key Challenges: Despite the considerable growth potential, the LPG industry faces substantial challenges. Price volatility, directly tied to fluctuating crude oil prices in the global market, poses a significant risk to profitability and price stability. Stringent environmental regulations, aimed at reducing greenhouse gas emissions, necessitate investments in cleaner technologies and sustainable practices, adding to operational costs. Intense competition from alternative fuels, such as natural gas and renewable energy sources, further pressures margins. Supply chain disruptions, particularly in times of geopolitical instability or natural disasters, can lead to shortages and price spikes. Finally, inadequate infrastructure, especially in remote or developing regions, hampers efficient distribution and restricts market penetration. The combined impact of these challenges translates into significant financial losses; estimates suggest annual revenue losses in the range of xx million units due to these factors. Addressing these challenges requires strategic planning, innovation, and collaboration across the entire value chain.
Emerging Opportunities in LPG Industry
Untapped markets in sub-Saharan Africa and Latin America represent substantial growth opportunities for LPG providers. These regions have large populations with limited access to reliable and clean cooking fuels, creating a significant demand for LPG. Furthermore, innovative applications of LPG are expanding beyond traditional uses. The chemical industry, for example, utilizes LPG as a feedstock in various manufacturing processes, representing a significant potential for market expansion. The aforementioned growing consumer preference for cleaner, more sustainable fuels drives the demand for bio-LPG blends, offering a compelling value proposition for environmentally conscious consumers and businesses.
Growth Accelerators in the LPG Industry
Technological advancements in LPG extraction, transportation, and storage will play a crucial role. Strategic partnerships between LPG producers, distributors, and technology providers will facilitate market expansion. Investments in infrastructure development, particularly in emerging markets, are essential for sustained growth.
Key Players Shaping the LPG Industry Market
Notable Milestones in LPG Industry Sector
- October 2022: Maire Tecnimont S.p.A. was awarded a USD 380 million Engineering, Procurement, and Construction (EPC) contract for a new LPG extraction plant in Algeria, signifying significant investment in expanding global LPG production capacity.
- February 2022: Indian Oil Corp. announced plans to invest USD 43-46 million in expanding its LPG bottling capacity in Northeast India, reflecting the growing domestic demand and the company's commitment to strengthening its distribution network in this region.
- [Add another recent milestone here with details - Year, Company, and Brief Description]
In-Depth LPG Industry Market Outlook
The LPG industry is poised for continued growth, driven by robust demand from developing economies and technological advancements promoting efficiency and sustainability. Strategic partnerships and infrastructure development will be key to unlocking the full potential of this market. The market is projected to reach xx million units by 2033, presenting significant opportunities for both established players and new entrants.
LPG Industry Segmentation
-
1. Source of Production
- 1.1. Crude Oil
- 1.2. Natural Gas Liquids
-
2. Application
- 2.1. Residential
- 2.2. Commercial & Industrial
- 2.3. Autofuels
- 2.4. Other Applications
LPG Industry Segmentation By Geography
-
1. North America
- 1.1. United States
- 1.2. Canada
- 1.3. Rest of North America
-
2. Europe
- 2.1. Norway
- 2.2. Netherlands
- 2.3. United Kingdom
- 2.4. Germany
- 2.5. Rest of Europe
-
3. Asia Pacific
- 3.1. China
- 3.2. India
- 3.3. South Korea
- 3.4. Japan
- 3.5. Rest of Asia Pacific
-
4. Middle East and Africa
- 4.1. Saudi Arabia
- 4.2. Qatar
- 4.3. South Africa
- 4.4. Rest of Middle East and Africa
-
5. South America
- 5.1. Brazil
- 5.2. Argentina
- 5.3. Chile
- 5.4. Rest of South America
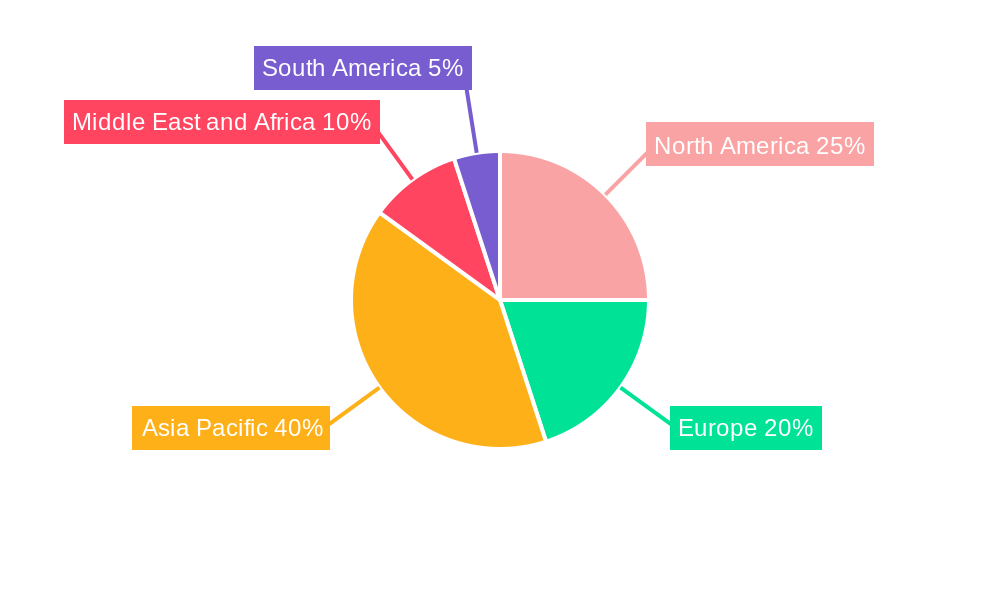
LPG Industry Regional Market Share
Geographic Coverage of LPG Industry
LPG Industry REPORT HIGHLIGHTS
| Aspects | Details |
|---|---|
| Study Period | 2020-2034 |
| Base Year | 2025 |
| Estimated Year | 2026 |
| Forecast Period | 2026-2034 |
| Historical Period | 2020-2025 |
| Growth Rate | CAGR of 3.9% from 2020-2034 |
| Segmentation |
|
Table of Contents
- 1. Introduction
- 1.1. Research Scope
- 1.2. Market Segmentation
- 1.3. Research Objective
- 1.4. Definitions and Assumptions
- 2. Executive Summary
- 2.1. Market Snapshot
- 3. Market Dynamics
- 3.1. Market Drivers
- 3.2. Market Restrains
- 3.3. Market Trends
- 3.4. Market Opportunities
- 4. Market Factor Analysis
- 4.1. Porters Five Forces
- 4.1.1. Bargaining Power of Suppliers
- 4.1.2. Bargaining Power of Buyers
- 4.1.3. Threat of New Entrants
- 4.1.4. Threat of Substitutes
- 4.1.5. Competitive Rivalry
- 4.2. PESTEL analysis
- 4.3. BCG Analysis
- 4.3.1. Stars (High Growth, High Market Share)
- 4.3.2. Cash Cows (Low Growth, High Market Share)
- 4.3.3. Question Mark (High Growth, Low Market Share)
- 4.3.4. Dogs (Low Growth, Low Market Share)
- 4.4. Ansoff Matrix Analysis
- 4.5. Supply Chain Analysis
- 4.6. Regulatory Landscape
- 4.7. Current Market Potential and Opportunity Assessment (TAM–SAM–SOM Framework)
- 4.8. IMR Analyst Note
- 4.1. Porters Five Forces
- 5. Market Analysis, Insights and Forecast 2021-2033
- 5.1. Market Analysis, Insights and Forecast - by Source of Production
- 5.1.1. Crude Oil
- 5.1.2. Natural Gas Liquids
- 5.2. Market Analysis, Insights and Forecast - by Application
- 5.2.1. Residential
- 5.2.2. Commercial & Industrial
- 5.2.3. Autofuels
- 5.2.4. Other Applications
- 5.3. Market Analysis, Insights and Forecast - by Region
- 5.3.1. North America
- 5.3.2. Europe
- 5.3.3. Asia Pacific
- 5.3.4. Middle East and Africa
- 5.3.5. South America
- 5.1. Market Analysis, Insights and Forecast - by Source of Production
- 6. Global LPG Industry Analysis, Insights and Forecast, 2021-2033
- 6.1. Market Analysis, Insights and Forecast - by Source of Production
- 6.1.1. Crude Oil
- 6.1.2. Natural Gas Liquids
- 6.2. Market Analysis, Insights and Forecast - by Application
- 6.2.1. Residential
- 6.2.2. Commercial & Industrial
- 6.2.3. Autofuels
- 6.2.4. Other Applications
- 6.1. Market Analysis, Insights and Forecast - by Source of Production
- 7. North America LPG Industry Analysis, Insights and Forecast, 2020-2032
- 7.1. Market Analysis, Insights and Forecast - by Source of Production
- 7.1.1. Crude Oil
- 7.1.2. Natural Gas Liquids
- 7.2. Market Analysis, Insights and Forecast - by Application
- 7.2.1. Residential
- 7.2.2. Commercial & Industrial
- 7.2.3. Autofuels
- 7.2.4. Other Applications
- 7.1. Market Analysis, Insights and Forecast - by Source of Production
- 8. Europe LPG Industry Analysis, Insights and Forecast, 2020-2032
- 8.1. Market Analysis, Insights and Forecast - by Source of Production
- 8.1.1. Crude Oil
- 8.1.2. Natural Gas Liquids
- 8.2. Market Analysis, Insights and Forecast - by Application
- 8.2.1. Residential
- 8.2.2. Commercial & Industrial
- 8.2.3. Autofuels
- 8.2.4. Other Applications
- 8.1. Market Analysis, Insights and Forecast - by Source of Production
- 9. Asia Pacific LPG Industry Analysis, Insights and Forecast, 2020-2032
- 9.1. Market Analysis, Insights and Forecast - by Source of Production
- 9.1.1. Crude Oil
- 9.1.2. Natural Gas Liquids
- 9.2. Market Analysis, Insights and Forecast - by Application
- 9.2.1. Residential
- 9.2.2. Commercial & Industrial
- 9.2.3. Autofuels
- 9.2.4. Other Applications
- 9.1. Market Analysis, Insights and Forecast - by Source of Production
- 10. Middle East and Africa LPG Industry Analysis, Insights and Forecast, 2020-2032
- 10.1. Market Analysis, Insights and Forecast - by Source of Production
- 10.1.1. Crude Oil
- 10.1.2. Natural Gas Liquids
- 10.2. Market Analysis, Insights and Forecast - by Application
- 10.2.1. Residential
- 10.2.2. Commercial & Industrial
- 10.2.3. Autofuels
- 10.2.4. Other Applications
- 10.1. Market Analysis, Insights and Forecast - by Source of Production
- 11. South America LPG Industry Analysis, Insights and Forecast, 2020-2032
- 11.1. Market Analysis, Insights and Forecast - by Source of Production
- 11.1.1. Crude Oil
- 11.1.2. Natural Gas Liquids
- 11.2. Market Analysis, Insights and Forecast - by Application
- 11.2.1. Residential
- 11.2.2. Commercial & Industrial
- 11.2.3. Autofuels
- 11.2.4. Other Applications
- 11.1. Market Analysis, Insights and Forecast - by Source of Production
- 12. Competitive Analysis
- 12.1. Company Profiles
- 12.1.1 Exxon Mobil Corporation
- 12.1.1.1. Company Overview
- 12.1.1.2. Products
- 12.1.1.3. Company Financials
- 12.1.1.4. SWOT Analysis
- 12.1.2 Novatek PAO
- 12.1.2.1. Company Overview
- 12.1.2.2. Products
- 12.1.2.3. Company Financials
- 12.1.2.4. SWOT Analysis
- 12.1.3 China Petroleum & Chemical Corporation
- 12.1.3.1. Company Overview
- 12.1.3.2. Products
- 12.1.3.3. Company Financials
- 12.1.3.4. SWOT Analysis
- 12.1.4 ConocoPhillips
- 12.1.4.1. Company Overview
- 12.1.4.2. Products
- 12.1.4.3. Company Financials
- 12.1.4.4. SWOT Analysis
- 12.1.5 Reliance Gas*List Not Exhaustive
- 12.1.5.1. Company Overview
- 12.1.5.2. Products
- 12.1.5.3. Company Financials
- 12.1.5.4. SWOT Analysis
- 12.1.6 QatarEnergy
- 12.1.6.1. Company Overview
- 12.1.6.2. Products
- 12.1.6.3. Company Financials
- 12.1.6.4. SWOT Analysis
- 12.1.7 BP PLC
- 12.1.7.1. Company Overview
- 12.1.7.2. Products
- 12.1.7.3. Company Financials
- 12.1.7.4. SWOT Analysis
- 12.1.8 Indian Oil Corporation Ltd
- 12.1.8.1. Company Overview
- 12.1.8.2. Products
- 12.1.8.3. Company Financials
- 12.1.8.4. SWOT Analysis
- 12.1.9 Gazprom PJSC
- 12.1.9.1. Company Overview
- 12.1.9.2. Products
- 12.1.9.3. Company Financials
- 12.1.9.4. SWOT Analysis
- 12.1.10 Abu Dhabi National Oil Company (ADNOC)
- 12.1.10.1. Company Overview
- 12.1.10.2. Products
- 12.1.10.3. Company Financials
- 12.1.10.4. SWOT Analysis
- 12.1.1 Exxon Mobil Corporation
- 12.2. Market Entropy
- 12.2.1 Company's Key Areas Served
- 12.2.2 Recent Developments
- 12.3. Company Market Share Analysis 2025
- 12.3.1 Top 5 Companies Market Share Analysis
- 12.3.2 Top 3 Companies Market Share Analysis
- 12.4. List of Potential Customers
- 13. Research Methodology
List of Figures
- Figure 1: Global LPG Industry Revenue Breakdown (billion, %) by Region 2025 & 2033
- Figure 2: North America LPG Industry Revenue (billion), by Source of Production 2025 & 2033
- Figure 3: North America LPG Industry Revenue Share (%), by Source of Production 2025 & 2033
- Figure 4: North America LPG Industry Revenue (billion), by Application 2025 & 2033
- Figure 5: North America LPG Industry Revenue Share (%), by Application 2025 & 2033
- Figure 6: North America LPG Industry Revenue (billion), by Country 2025 & 2033
- Figure 7: North America LPG Industry Revenue Share (%), by Country 2025 & 2033
- Figure 8: Europe LPG Industry Revenue (billion), by Source of Production 2025 & 2033
- Figure 9: Europe LPG Industry Revenue Share (%), by Source of Production 2025 & 2033
- Figure 10: Europe LPG Industry Revenue (billion), by Application 2025 & 2033
- Figure 11: Europe LPG Industry Revenue Share (%), by Application 2025 & 2033
- Figure 12: Europe LPG Industry Revenue (billion), by Country 2025 & 2033
- Figure 13: Europe LPG Industry Revenue Share (%), by Country 2025 & 2033
- Figure 14: Asia Pacific LPG Industry Revenue (billion), by Source of Production 2025 & 2033
- Figure 15: Asia Pacific LPG Industry Revenue Share (%), by Source of Production 2025 & 2033
- Figure 16: Asia Pacific LPG Industry Revenue (billion), by Application 2025 & 2033
- Figure 17: Asia Pacific LPG Industry Revenue Share (%), by Application 2025 & 2033
- Figure 18: Asia Pacific LPG Industry Revenue (billion), by Country 2025 & 2033
- Figure 19: Asia Pacific LPG Industry Revenue Share (%), by Country 2025 & 2033
- Figure 20: Middle East and Africa LPG Industry Revenue (billion), by Source of Production 2025 & 2033
- Figure 21: Middle East and Africa LPG Industry Revenue Share (%), by Source of Production 2025 & 2033
- Figure 22: Middle East and Africa LPG Industry Revenue (billion), by Application 2025 & 2033
- Figure 23: Middle East and Africa LPG Industry Revenue Share (%), by Application 2025 & 2033
- Figure 24: Middle East and Africa LPG Industry Revenue (billion), by Country 2025 & 2033
- Figure 25: Middle East and Africa LPG Industry Revenue Share (%), by Country 2025 & 2033
- Figure 26: South America LPG Industry Revenue (billion), by Source of Production 2025 & 2033
- Figure 27: South America LPG Industry Revenue Share (%), by Source of Production 2025 & 2033
- Figure 28: South America LPG Industry Revenue (billion), by Application 2025 & 2033
- Figure 29: South America LPG Industry Revenue Share (%), by Application 2025 & 2033
- Figure 30: South America LPG Industry Revenue (billion), by Country 2025 & 2033
- Figure 31: South America LPG Industry Revenue Share (%), by Country 2025 & 2033
List of Tables
- Table 1: Global LPG Industry Revenue billion Forecast, by Source of Production 2020 & 2033
- Table 2: Global LPG Industry Revenue billion Forecast, by Application 2020 & 2033
- Table 3: Global LPG Industry Revenue billion Forecast, by Region 2020 & 2033
- Table 4: Global LPG Industry Revenue billion Forecast, by Source of Production 2020 & 2033
- Table 5: Global LPG Industry Revenue billion Forecast, by Application 2020 & 2033
- Table 6: Global LPG Industry Revenue billion Forecast, by Country 2020 & 2033
- Table 7: United States LPG Industry Revenue (billion) Forecast, by Application 2020 & 2033
- Table 8: Canada LPG Industry Revenue (billion) Forecast, by Application 2020 & 2033
- Table 9: Rest of North America LPG Industry Revenue (billion) Forecast, by Application 2020 & 2033
- Table 10: Global LPG Industry Revenue billion Forecast, by Source of Production 2020 & 2033
- Table 11: Global LPG Industry Revenue billion Forecast, by Application 2020 & 2033
- Table 12: Global LPG Industry Revenue billion Forecast, by Country 2020 & 2033
- Table 13: Norway LPG Industry Revenue (billion) Forecast, by Application 2020 & 2033
- Table 14: Netherlands LPG Industry Revenue (billion) Forecast, by Application 2020 & 2033
- Table 15: United Kingdom LPG Industry Revenue (billion) Forecast, by Application 2020 & 2033
- Table 16: Germany LPG Industry Revenue (billion) Forecast, by Application 2020 & 2033
- Table 17: Rest of Europe LPG Industry Revenue (billion) Forecast, by Application 2020 & 2033
- Table 18: Global LPG Industry Revenue billion Forecast, by Source of Production 2020 & 2033
- Table 19: Global LPG Industry Revenue billion Forecast, by Application 2020 & 2033
- Table 20: Global LPG Industry Revenue billion Forecast, by Country 2020 & 2033
- Table 21: China LPG Industry Revenue (billion) Forecast, by Application 2020 & 2033
- Table 22: India LPG Industry Revenue (billion) Forecast, by Application 2020 & 2033
- Table 23: South Korea LPG Industry Revenue (billion) Forecast, by Application 2020 & 2033
- Table 24: Japan LPG Industry Revenue (billion) Forecast, by Application 2020 & 2033
- Table 25: Rest of Asia Pacific LPG Industry Revenue (billion) Forecast, by Application 2020 & 2033
- Table 26: Global LPG Industry Revenue billion Forecast, by Source of Production 2020 & 2033
- Table 27: Global LPG Industry Revenue billion Forecast, by Application 2020 & 2033
- Table 28: Global LPG Industry Revenue billion Forecast, by Country 2020 & 2033
- Table 29: Saudi Arabia LPG Industry Revenue (billion) Forecast, by Application 2020 & 2033
- Table 30: Qatar LPG Industry Revenue (billion) Forecast, by Application 2020 & 2033
- Table 31: South Africa LPG Industry Revenue (billion) Forecast, by Application 2020 & 2033
- Table 32: Rest of Middle East and Africa LPG Industry Revenue (billion) Forecast, by Application 2020 & 2033
- Table 33: Global LPG Industry Revenue billion Forecast, by Source of Production 2020 & 2033
- Table 34: Global LPG Industry Revenue billion Forecast, by Application 2020 & 2033
- Table 35: Global LPG Industry Revenue billion Forecast, by Country 2020 & 2033
- Table 36: Brazil LPG Industry Revenue (billion) Forecast, by Application 2020 & 2033
- Table 37: Argentina LPG Industry Revenue (billion) Forecast, by Application 2020 & 2033
- Table 38: Chile LPG Industry Revenue (billion) Forecast, by Application 2020 & 2033
- Table 39: Rest of South America LPG Industry Revenue (billion) Forecast, by Application 2020 & 2033
Frequently Asked Questions
1. What is the projected Compound Annual Growth Rate (CAGR) of the LPG Industry?
The projected CAGR is approximately 3.9%.
2. Which companies are prominent players in the LPG Industry?
Key companies in the market include Exxon Mobil Corporation, Novatek PAO, China Petroleum & Chemical Corporation, ConocoPhillips, Reliance Gas*List Not Exhaustive, QatarEnergy, BP PLC, Indian Oil Corporation Ltd, Gazprom PJSC, Abu Dhabi National Oil Company (ADNOC).
3. What are the main segments of the LPG Industry?
The market segments include Source of Production, Application.
4. Can you provide details about the market size?
The market size is estimated to be USD 123.14 billion as of 2022.
5. What are some drivers contributing to market growth?
4.; Increasing Demand for Gasoline and Diesel Across the Globe4.; Rapid Expansion of Automotive Industry.
6. What are the notable trends driving market growth?
LPG Extracted from Natural Gas Liquids to Dominate the Market.
7. Are there any restraints impacting market growth?
4.; Strict Mandates by the Global Organizations on VGO Composition.
8. Can you provide examples of recent developments in the market?
In October 2022, Maire Tecnimont S.p.A. announced that its principal subsidiary, Tecnimont S.p.A., was awarded an EPC contract by SONATRACH's Direction Centrale Engineering & Project Management for the execution of an LPG extraction plant within the existing Rhourde El Baguel oil and gas treatment complex in northeastern Algeria. The total contract value is around USD 380 million.
9. What pricing options are available for accessing the report?
Pricing options include single-user, multi-user, and enterprise licenses priced at USD 4750, USD 5250, and USD 8750 respectively.
10. Is the market size provided in terms of value or volume?
The market size is provided in terms of value, measured in billion.
11. Are there any specific market keywords associated with the report?
Yes, the market keyword associated with the report is "LPG Industry," which aids in identifying and referencing the specific market segment covered.
12. How do I determine which pricing option suits my needs best?
The pricing options vary based on user requirements and access needs. Individual users may opt for single-user licenses, while businesses requiring broader access may choose multi-user or enterprise licenses for cost-effective access to the report.
13. Are there any additional resources or data provided in the LPG Industry report?
While the report offers comprehensive insights, it's advisable to review the specific contents or supplementary materials provided to ascertain if additional resources or data are available.
14. How can I stay updated on further developments or reports in the LPG Industry?
To stay informed about further developments, trends, and reports in the LPG Industry, consider subscribing to industry newsletters, following relevant companies and organizations, or regularly checking reputable industry news sources and publications.
Methodology
Step 1 - Identification of Relevant Samples Size from Population Database


Step 2 - Approaches for Defining Global Market Size (Value, Volume* & Price*)

Note*: In applicable scenarios
Step 3 - Data Sources
Primary Research
- Web Analytics
- Survey Reports
- Research Institute
- Latest Research Reports
- Opinion Leaders
Secondary Research
- Annual Reports
- White Paper
- Latest Press Release
- Industry Association
- Paid Database
- Investor Presentations

Step 4 - Data Triangulation
Involves using different sources of information in order to increase the validity of a study
These sources are likely to be stakeholders in a program - participants, other researchers, program staff, other community members, and so on.
Then we put all data in single framework & apply various statistical tools to find out the dynamic on the market.
During the analysis stage, feedback from the stakeholder groups would be compared to determine areas of agreement as well as areas of divergence